
ABSTRACT
Mitigating and adapting to climate change includes a requirement to evaluate the role of future land uses in delivering robust integrated responses that are sensitive to local landscape contexts. In practice, this emphasises the need for community engagement, planning and inclusive decision-making. Community engagement may be potentially facilitated by the use of spatially explicit quantitative scenarios of land-use change in combination with interactive visualisation. This requires a coherent framework to integrate spatial data modelling, analytical capabilities and visualisation tools in a format that will also engage diverse public audiences. These challenges were explored with a case study of virtual landscapes from N-E Scotland that was used to test preferences for scenarios of future land use. Visualisations employed texture-based rendering rather than full photo-realistic rendering to facilitate interactivity and this provided additional scope for audiences to explore multiple future scenarios compared to the present landscape. Interactive voting in a virtual landscape theatre suggested preferences for visual diversity, good stewardship and perceived naturalness that should be considered in developing planned responses to change. Further investigation of preferences was conducted using interactive 3D features located within the landscape. Study findings are reviewed against objectives for inclusive engagement in the Digital Earth agenda and used to make further recommendations on the use of scenarios and visualisation tools. In particular, technical advances in user engagement need to be developed in conjunction with emerging good practice that addresses ethical, behavioural and inclusion issues so that the content is presented in as transparent and unbiased format as possible.
1. Introduction
The Digital Earth agenda recognises the key role of geo-information science and technology in responding to the high likelihood that the planet will henceforth experience rates of environmental and climate change that are unprecedented in human history (Goodchild Citation2008). In order to bridge diverse scientific, public and policy perspectives on this issue, a need for innovative research has been defined that links integrated geospatial modelling, scenario planning, inclusive decision-making and participatory processes (Craglia et al. Citation2012). Scenarios can provide a key tool in developing this agenda because they act as ‘boundary objects’ at the interface between scientific knowledge (e.g. models of change) and public policy in providing alternative visions of the future (Hulme and Dessai Citation2008). In a participatory setting, scenarios can therefore be used to develop inclusive and interactive decision-making, including a shared realisation of different influencing factors, and whether these factors are either within or outside the control of different participants (Brown and Castellazzi Citation2014). Nevertheless, it is commonly reported that participatory scenario exercises encounter problems due to the complexity of issues associated with environmental change and the sometimes abstract portrayal of the scenarios to participants (Vervoort et al. Citation2014). This difficulty can often be attributed to the perceived remoteness of future scenarios from participants’ everyday experiences, a challenge that has been particularly recognised with regard to climate change and ascribed to the ‘psychological distance’ that people encounter with such issues, unless they have direct experience of its effects (Spence, Poortinga, and Pidgeon Citation2012). This remoteness, together with the inherent uncertainty of the future, can engender a ‘wait and see’ attitude that leads to unplanned reactive responses rather than the proactive adaptation responses needed to anticipate, prepare and plan for change.
Literature on behaviour change with regard to issues of climate and environmental change has identified a need for more comprehensive and emotionally engaging media for science communication (Lorenzoni, Nicholson-Cole, and Whitmarsh Citation2007; Moser and Dilling Citation2007). Better understanding of emotional responses and risk perception are increasingly recognised as crucial in stimulating positive responses if they are linked appropriately to the scientific evidence (Spence and Pidgeon Citation2010). Previous work has shown how landscape visualisation techniques can help in communicating the issues by referencing prospective changes against a familiar setting using virtual reality representations that integrate topography, land cover, infrastructure and settlements (Tress and Tress Citation2003; Sheppard Citation2005; Brown et al. Citation2006; Jude et al. Citation2008). The toolbox of visualisation techniques may therefore be used to facilitate future visioning and planning for change which can be particularly relevant at the level of local communities (Burch et al. Citation2010; Sheppard et al. Citation2011). It can also build upon previous work that has shown the advantages of a place-based approach in engaging people with climate change issues (Scannell and Gifford Citation2013) as consistent with the ‘think global, act local’ axiom highlighted by the Digital Earth agenda (Goodchild Citation2008).
The use of scenarios and landscape visualisation to convey information in a form that is inclusive but not misleading has therefore become a salient topic for research. It has been further stimulated by technological developments in high-resolution data that emphasise the need to address conflicting notions on the use of ‘realism' (Glander and Döllner Citation2009) together with related issues on the appropriate communication of risk and uncertainty (Sheppard and Cizek Citation2009). Based upon this emerging research agenda, three key challenges for scenario visualisation have been used to frame the experiences reported in this paper (Shaw et al. Citation2009): ethical issues of using visual imagery in a way that is both defensible and dramatic; the difficulties of including all stakeholders in the participatory process; and the best use of research outcomes to inform policy and local decision-making.
1.1. Scenarios and landscape change
In order to address the limitations of predictive models and forecasting when faced with the inherent uncertainties of future change, scenario-based approaches are designed to provide multiple alternative descriptions of the future (Wilkinson and Eidinow Citation2008). A successful scenario process will communicate the potential interaction between different drivers of change in a format that maintains consistency between related variables as well as providing future descriptions that are plausible and engaging for participants but that also challenge existing mental models. An important distinction exists between scenarios that aim to be exploratory (i.e. ‘what could happen?’) and those that are normative based upon visions or targeted futures (i.e. ‘what should happen?’). Many scenario exercises proceed by developing qualitative narratives of change (i.e. descriptive ‘storyline’) but recent advances in integrated assessment modelling have also further developed scenario quantification through model simulation.
For exploring land-use change, the dominant mode for quantification has been to develop spatially explicit large-scale land-use models which are then downscaled to landscape level (Rounsevell et al. Citation2006; Verburg et al. Citation2006). These models can integrate climate change scenarios in combination with socioeconomic drivers (e.g. trade patterns; policy objectives) using a structured framework, such as that of the Intergovernmental Panel on Climate Change (IPCC) Special Report on Emission Scenarios (SRES; Nakicenovic et al. Citation2000) or Millennium Ecosystem Assessment (MEA Citation2005). More recently, the IPCC have developed a new scenario framework (Ebi et al. Citation2014) that incorporates and expands the original SRES structure but the SRES remain probably the most familiar and popular reference frame for scenario exercises, hence its adoption in the present study. Land-use modelling routines aim to reconcile relative priorities in demand for land (e.g. for crops) with their potential supply based upon biophysical land capability criteria to define land values. Land-use allocation is then implemented using techniques such as rules (Rounsevell et al. Citation2006), cellular automata (de Nijs, de Niet, and Crommentuijn Citation2004), linear programming (Holman et al. Citation2005) or empirical–statistical routines (Verburg et al. Citation2006), usually applying top-down optimisation criteria (e.g. maximised profitability). However, the challenges involved in robust downscaling to landscape level have led to the development of alternative cross-scale approaches that aim to also incorporate bottom-up factors (e.g. traditional land-use management that is not necessarily based on maximum profitability) that can be just as important in shaping the local landscape as top-down influences (Brown and Castellazzi Citation2014).
Normative approaches can provide an alternative route for scenario development by facilitating the coherent description of future visions and preferences, including plausible pathways to realise these goals. For example, Waldhardt et al. (Citation2010) used an expert-driven and rule-based normative approach to develop a scenario of a future multifunctional landscape in the Wetterau region of Hesse (Germany), which was compared with the present-day landscape using selected indicators.
In the present case study, a freely available tool (LandSFACTS; Castellazzi et al. Citation2010, 2012) has been used to integrate both top-down and bottom-up constraints on scenarios using a rule-based approach. Such tools can facilitate the linking of baseline geographic information system (GIS) data with the rationale that defines each scenario, when codified as a series of rules, to generate a coherent package of quantified spatio-temporal outputs consistent with the original scenario framework and descriptions.
1.2. Visualisation techniques and technology
Visualisation techniques can be used in a variety of different settings, depending on their association with specific types of decision (Lange Citation2011). Initially, they can be used to improve awareness within the local community of landscape features, either individually or in groups. They can also be used to communicate different aspects of change, such as climate change and socioeconomic scenarios (e.g. flooding, vegetation change) (Wang, Wan, and Palmer Citation2010). Based upon these initial visualisations, the participants can then investigate potential response options and learn collectively what this might mean for the local landscape and community. Ode et al. (Citation2009) describe tests of public preferences for landscapes with respect to visual concepts, using landscape visualisations of different representations of vegetation succession, and by interpreting findings in terms of, for example, stewardship and perceived naturalness. Fry et al. (Citation2009) showed that landscape characteristics (e.g. stewardship, coherence, naturalness, complexity, scale/openness and historicity) have common conceptual ground with ecological concepts, allowing the definition of indicators based on quantifiable measures of land cover and land-use features. Theoretical underpinning of such concepts is provided by the Biophilia hypothesis that humans have affiliations with nature rooted in our biology (Kellert and Wilson Citation1993), evolutionary influences on landscape preferences (Falk and Balling Citation2010) and use of information aiding environmental understanding (Kaplan and Kaplan Citation1989). The scope for testing public responses to future landscapes in relation to landscape preferences has been investigated in a variety of studies. These have included both exploratory and normative scenario approaches, with land-use management options modified to reflect alternative scenarios of mitigating and adapting to climate change, and the information also used to elicit local stakeholder perspectives of potential future land uses (Dockerty et al. Citation2006; Sheppard and Cizek Citation2009). However, visualisations have primarily been based upon interpretation of qualitative scenario descriptions rather than linking with quantitative model simulations as employed for the present study.
In order to allow people to be immersed in computer models to explore landscapes of the past, present and future, virtual reality labs with large screens have been designed with additional emphasis on multi-user interaction. The first mobile unit of its kind in the UK is the Virtual Landscape Theatre (VLT Citation2012), which is used for scientific research as well as engagement with the public on issues of landscape change. Other virtual theatres such as CAVE immersive lab (Gaspar and Bastos Citation2011) or Keele Active Virtual Environment (Richardson et al. Citation2013) are able to perform similar functions. In Van Lammeren et al. (Citation2010), a dedicated multi-layered visualisation of current and future land use is adopted through evaluation of three different visualisation types: coloured raster cells, 2D-icons and 3D-icons. At lower viewpoints, 3D-shapes and 3D-icons can be seen. At higher viewpoints, the 3D-icons change into 2D-icons; finally, above an altitude of 1800 m, 2D-icons will switch into colour cells. The experiment consisted of three parts: part 1 measured the user's accuracy and efficiency in relation to the land-use visualisation; part 2 focused on the appreciation and usability of the interface, and the aesthetic experience and recognisability of the type of visualisation; part 3 revealed the effect of the appreciation of the three types of visualisation on the effective appraisal of an environment.
Recently, there is a trend to create methods and tools for investigating landscape time-depth and historical scenarios through the use of 3D modelling tools and virtual reality engines (Vasáros Citation2008; Verhagen Citation2008), further encouraged by new technological developments that enhance performance and interactivity. For example, virtual reality head-mounted display such as Oculus Rift (Oculus VR 2014) and Sony's Project Morpheus (Sony 2014) provide a 90° horizontal and 110° vertical stereoscopic 3D perspective. The result is the sensation that you are looking around a very realistic 3D world. In Rua and Alvito (Citation2011), 3D models, virtual reality and game engines (Bethesda Softworks Citation2011) are combined as a tool for reconstruction of cultural heritage, including avatars driven by artificial intelligence (AI). AI scripts are added to assign a set of predetermined actions and reactions such as going for a walk or complex actions amounting to a defined daily timetable, or pre-defined dialogues. Today, 3D software programs such as Maya, 3D Max, Vega Prime, Octaga or specialised landscape tools such as Visual Nature Studio (VNS) provide a high degree of visual realism for landscape, rendered as images or animations (Bishop and Miller Citation2007; Ball, Capanni, and Watt Citation2008; Wang, Wan, and Palmer Citation2012; Wang et al. Citation2015).
2. Case study background
The Scottish Government has recently developed a Land Use Strategy (LUS; Scottish Government Citation2011) which aims to integrate policy objectives for reducing greenhouse gas emissions by 80% by 2050 together with other priorities such as food security, biodiversity, enhanced water quality and climate change adaptation. The LUS promotes use of an ecosystem approach as a means of integrated management of land, water and living resources (UNEP Citation2010) linked to increased public participation and planning for the future. This is also consistent with the European Landscape Convention (Council of Europe Citation2000) which promotes integrated perspectives on landscapes including visual, cultural and social qualities with ecological functions.
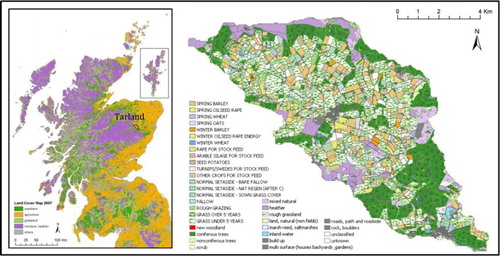
To inform public dialogue on meeting the goals for the LUS in Scotland, a series of land-use scenarios were developed by the present study based upon an integrated framework linking socioeconomic change and climate change, as guided by the general structure of the IPCC SRES. The focal area for these scenarios was the district of Tarland, N-E Scotland (; Brown and Castellazzi Citation2014). This district is at the transition between the uplands (areas of higher elevation with generally uncultivated land) and the lowlands (areas of lower elevation areas that are usually cultivated land), hence land-use change could potentially follow a variety of future directions depending on the interaction of macro-scale drivers with local factors.
Figure 1. Location of the Tarland catchment in Scotland and its current land uses.
This paper evaluates the use of landscape visualisation techniques, as implemented for the Tarland district scenarios, as a basis for exploring public responses to land-use change and their perceptions of the resulting landscapes. These findings are then contextualised against the use of visualisation in advancing the wider Digital Earth agenda including recommendations for further using such engagement and research to encourage proactive and participatory planning for change. A particular feature of the scenarios presented here is that they link climate change with other drivers associated with socioeconomic change (including policy targets), and hence the role of the local community in adapting to these larger scale external drivers of change.
3. Methodology
The main steps involved can be summarised as follows:
Compilation of spatial datasets comprising land cover and use, and terrain to represent the present-day landscape;
Generation of alternative land-use scenarios using the LandSFACTS toolkit;
Creation of 3D models using existing land use, and modifications reflecting alternative land uses driven by scenarios; 3D models' interaction and usability of the interface;
Development of landscape preferences using visualisations of each scenario from different viewpoints;
Elicitation of public opinions on future land uses using a virtual reality environment.
3.1. Land-use scenarios
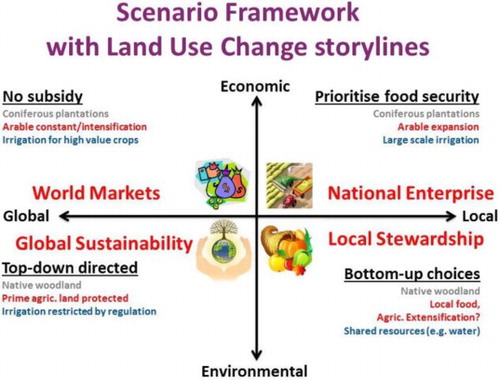
Scenario development was guided by the IPCC SRES framework which references scenarios against two axes that define major uncertainties in future global change: scale of governance (regional versus global) and societal values (market-oriented versus environmental). For the Tarland scenarios, the SRES were further refined using stakeholder engagement (workshops; solicited feedback, etc.) to identify key land-use issues for Scotland in each storyline (Brown and Castellazzi Citation2014), particularly accounting for the viability of Scottish Government aspirations to expand national woodland cover from 17% to 25% by 2050 (). Hence, four Tarland scenarios for 2050 were developed using the general SRES framework adjusted to the local context.
World Markets (WM) scenario depicts a world where globalisation and market forces dominate, meaning that land use receives no government subsidies and there is little environmental protection. This favours concentration of arable land on the most productive land and coniferous afforestation on the less productive land.
National Enterprise (NE) scenario depicts protectionism at the national and European levels, particularly concerning food security with land being subsidised to provide this. Environmental protection and regulation are therefore a lower priority. This would encourage arable land to be expanded including large-scale irrigation if necessary to transfer water to productive areas. Woodland expansion by coniferous plantations would only occur on the poorer quality land.
Global Sustainability (GS) scenario depicts global cooperation and binding treaties for a high degree of environmental protection. Land-use planning is strongly regulated resulting in zoning associated with best utilisation of natural resources. Prime agricultural land is protected but irrigation is restricted by regulation. Woodland expansion would occur on non-prime land using native woodlands.
Local Stewardship (LS) scenario represents a world where decision-making is dominated by local issues, particularly related to sustainable solutions to local food and energy needs. For Tarland, that would mean arable expansion on prime land with irrigation if needed. Woodland expansion of native woodland would therefore happen on semi-natural areas to support local demands for fibres and energy.
Figure 2. Scenarios of land-use change for Scotland based upon the IPCC SRES framework (adapted from Brown and Castellazzi Citation2014).
Using a ‘storyline and simulation’ approach, the qualitative scenarios were converted into spatially explicit quantitative realisations using a cross-scale approach to integrate global, regional and local factors influencing land use using rule-based constraints (; Brown and Castellazzi Citation2014). The baseline landscape was defined using the Ordnance Survey (OS) Mastermap® topography in vector format (OS Citation2015), where land uses (field, forest patch, buildings, etc.) are represented as polygons. The broad OS land-use classification was complemented with detailed cropping systems at the field scale from agricultural subsidy data records (Integrated Agricultural Control System data for Scotland made available by the Scottish Government). Existing woodland, which was not assumed to change by 2050, was incorporated into all future scenarios. Spatial datasets and scenarios’ constraints were integrated using the LandSFACTS toolkit (Castellazzi et al. Citation2010, Citation2012) to generate alternative land-use change simulations based upon rules consistent with the scenario assumptions (Brown and Castellazzi Citation2014). LandSFACTS is a stochastic modelling routine that provides spatio-temporal land-use allocations meeting the rule-based constraints associated with each scenario.
Figure 3. Inputs used by the LandSFACTS toolkit to create land-use scenarios (simplified from Brown and Castellazzi Citation2014).
3.2. 3D landscape creation
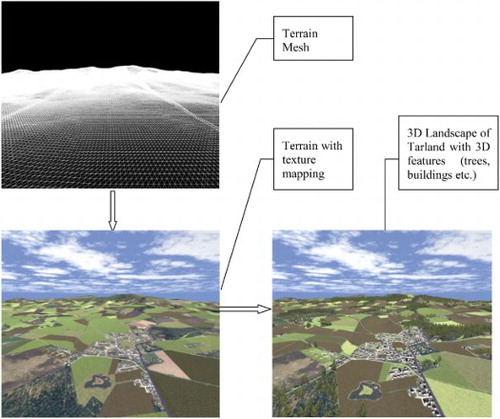
The procedure for 3D landscape creation consists of linked input, output and visualisation elements () that are used to create 3D models from the current land use and future scenario datasets. The visualisation tool used was PC-based, enabling the incorporation of interactive functionality for manipulating features such as wind farms in 3D models. The code is written in Virtual Reality Modelling Language (VRML) and JavaScript and implemented in a viewer (Octaga) that can support very large datasets. VRML provides a standard WWW format for 3D models, which provides spatial portioning and indexing consistent with Digital Earth principles and which may produce georeferenced applications using GeoVRML (Coffey, Beard, and Ryan Citation2007). The core part of the system consists of interaction and a user-interface to explore the rendered VRML structure with JavaScript programing.
Figure 4. Framework for 3D landscape visualisation with public participation.
OS digital elevation model raster data (OS Citation2015) was used to create a Digital Terrain Model of 16.5 km × 13.4 km at a 10-m resolution in VNS (3D Nature Citation2012). High-resolution aerial imagery (0.25 m) was utilised for background landscape textures. Extruded buildings and land-use units were derived from OS MasterMap data. A range of tree images representative of native woodlands and high-value coniferous plantation were sourced from commercially available foliage libraries (Xfrog Citation2011). Field crop examples (barley, wheat, oats, oilseed rape, peas and potatoes) were photographed, edited and incorporated into the model. Roads, streams and atmospheric effects were added from within VNS.
The present-day and future landscape representations were exported from VNS as a VRML 3D model for use in the VLT. The level of detail in each representation was set such that the landscape shown in each scenario would (a) be recognisable to local residents and (b) clearly show differences in land cover, particularly where changes could have an impact on human activities. Some compromises had to be made in order to achieve a reasonable frame rate – e.g. the number of tree images was limited to 20 trees per hectare, and crops were rendered out as ground textures rather than as assemblages of individual stems.
The geometry of 3D surfaces is generally represented on the computer as a continuous mesh of polygons (normally triangles). Then OS aerial images are applied into the 3D geometry with sky background and lighting. The footprints of buildings and forest are acquired and processed using ArcGIS. All of the 3D objects are modelled and rendered with different sizes and location which are presented in .
Figure 5. 3D landscape of Tarland.
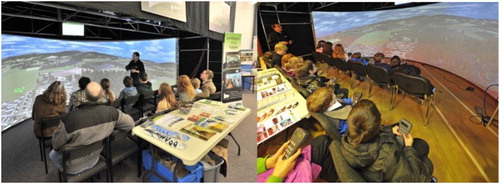
The main platform for representing alternative futures for public engagement was the VLT (Ball, Capanni, and Watt Citation2008) which is a mobile 160° curved screen (5.5 m long by 2.25 m high) and projection facility using three projectors, and four PCs with image blended synchronisation. It allows people to explore land planning options which will affect their local environment by moving around the virtual world. Interactive fly-throughs were generated from the 3D models in order to facilitate viewing and elicitation of opinions by the public in an immersive virtual reality environment. Additionally static landscape visualisations of each scenario, as viewed from different viewpoints, were developed from the 3D models for landscape preferences ().
Figure 6. Framework for 3D visualisation and simulation of Tarland land use.
3.3. Eliciting opinions on future land uses
Models representing alternative land-use change scenarios were used in the VLT to elicit public preferences regarding future land uses. Information sessions were designed to begin with a general introduction to global issues and then to transit towards a more detailed exploration of these issues in the local context using the scenarios at a landscape level. The interactive functions of the virtual landscape model were designed to incorporate a number of preset viewpoints and animated camera paths in addition to allowing interactive movements. The preset viewpoints were designed to include different perspectives on the landscape, contrasting a high-level ‘iconic’ overview (the ‘Queen's View') with lower-level more informal viewpoints that are familiar to local people and provide more local detail. Switching between data layers (i.e. current and future land uses) was enabled in the software using ‘hotkeys’. Participant reaction was delivered verbally, and recorded to summarise their changing perceptions, or obtained in a structured format though the use of voting handsets, with immediate display of audience votes. Handsets could be used to track individual opinions (e.g. of different types of stakeholder), without necessarily being available to the rest of the audience which may be useful when there is the potential for conflicting opinions between users (Miller et al. Citation2007).
Each session comprised:
introducing drivers of land-use change (e.g. economic, environmental) and their representation in the different future scenarios;
visual exploration of landscapes and scenarios from different viewpoints and voting for the preferred landscape scenario using interactive keypads;
discussion and agreement on local land-use topics for further investigation and deliberation (e.g. wind farm location/size; woodland location/type);
interactive exploration and voting on options for addressing local land-use issues based upon the preferred land-use scenario.
The 3D model and simulation of visual impacts of various land-use scenarios were used at events in the local (Tarland) area and wider national public engagement, including the British Science Festival at Birmingham. In total, six formal sessions (148 participants) were arranged for invited groups that consisted of land managers, natural heritage managers, planners, schools and youth groups, university students and the general public (). In addition, informal sessions of 20 min were run with up to 15 people for each session.
Table 1. Summary of workshop sessions including scenario voting preferences (‘Stakeholder’ indicates a person with a defined professional or occupational interest) (S1: WM; S2: NE; S3: GS; S4: LS).
The electronic voting system was used to record participant answers, and prompt group discussion. Votes on preferences for land-use scenarios were recorded, and analysed with respect to the nature and proportion of visible features. In addition, audience priorities for future land uses were recorded.
The use of 3D interactive imagery has been previously identified as a potential mechanism to enhance local decision-making on climate change (Schroth et al. Citation2014). Therefore, following on from the voting preferences, further user interactivity was developed to particularly explore how a chosen scenario could be refined to enhance local participation and inclusive decision-making. A ‘drag-and-drop’ feature that allows participants to choose where they would like to position elements (wind turbines, trees, houses, etc.) was added based upon a series of 3D icons (). The icons are coded in JavaScript to allow participants to select locations of the forest, housing development, access to the town, car parking, renewable energy, playgrounds and conservation area. It also provides functions for pointing out those areas where audiences definitely do not want such a feature. Icons were ‘dragged and dropped’ to audience-selected positions, with VRML code ‘ground clamping’ them to the terrain surface (i.e. the icons were automatically located at a vertical elevation consistent with the ground surface).
Figure 7. 3D icons of land-use features.

4. Results
demonstrates the different Tarland land-use scenarios presented in virtual landscape format. Key distinctions in land use are represented by the proportion of land allocated to arable (brown textures for tilled land), pasture (green textures for grassland), semi-natural land (darker green textures) and woodland (coniferous or deciduous 3D trees). This information was presented to both local people and those unfamiliar with the district in order to investigate potential differences in opinion ().
Figure 8. Static visualisations of the different Tarland land-use scenarios.
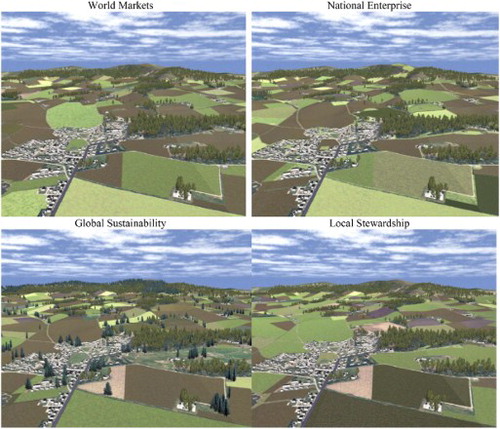
Figure 9. Eliciting public opinions on alternative future land uses in the VLT with: (a) non-local audience (Edinburgh) and (b) local audience.
The LS scenario was identified as having the strongest preference amongst audience groups ( and ). Recorded findings suggest positive responses for landscapes with a visible mix of land uses, good stewardship (i.e. active management to maintain land quality), elements of perceived naturalness and visual diversity. Woodland expansion to achieve climate change objectives may therefore be better achieved through smaller units in lower elevation land, linking existing lines of trees, and on other land of poorer quality. This strategy would appear to minimise potential conflict with existing land uses that are highly valued such as productive farmland or are important features of people's identification with their local landscape.
Table 2. Participant preference ratings for land-use scenarios in the 3D virtual environment.
The LS scenario visualisation was therefore chosen to explore further landscape preferences using interactive content. shows how the landscape of the LS scenario could be further modified according to participants’ preferences. For example, wind turbines are normally located upon the hill, trees are usually distributed with reference to existing woodland areas and buildings are mostly situated adjacent to existing settlements. The preferred location for new features varied by participant background but interaction with the visual landscapes allowed participants to develop a consensus option (). and shows how the result of preferred land-use scenarios varied by participants’ background. Commonality between audiences showed desire for amenity woodland adjacent to the village, quality recreation within the village, conservation interests and recognition of risks to water quality which some participants associated with pollution from increased agricultural activity. Both non-local and local audiences were positive towards small-scale wind turbines associated with farming or communities. Over half of the audiences prefer the new landscape feature of small-scale wind farm ().
Figure 10. 3D drag and drop of icons showing proposed location of new features adjacent to Tarland village.
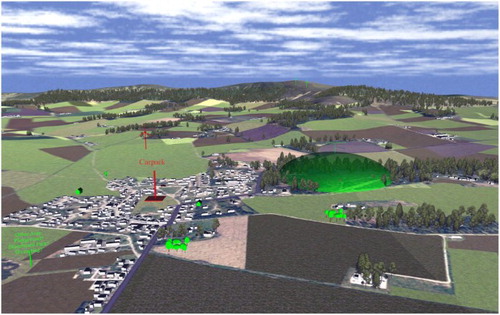
Table 3. Participant preference for land-use scenarios by their background.
Table 4. Preferred choice and location for new features varied by participants’ background.
Significant differences between audiences related to medium-sized wind farms on hills north of the village. Those unfamiliar with the area argued that renewable energy was a priority and highlighted open hilltops as opportunities for maximising energy return. Those familiar with the area, even if not residents, were conscious of the local significance of prominent hills and previous rejections of wind farm proposals.
5. Discussion and conclusion
In the Digital Earth agenda, sharing of scientific information about a changing planet is specifically intended to bring wider public involvement, including those who may have limited technical skills or computing resources (Goodchild et al. Citation2012). The use of visualisation can play a crucial role in this process by providing a user-friendly interface to spatial data that would otherwise require knowledge of GIS, as is evident in the popularity of tools such as Google Earth (Sheppard and Cizek Citation2009). In addition, landscape visualisation tools have the potential to capitalise on the advent of the era of ‘big data’ and the increased popularity of place-based citizen-science type initiatives by referencing information against a familiar background (Sheppard Citation2012). However, there are also issues to resolve and debate with regard to the use of visualisation in this interface between science, policy and public: these are referenced according to the three scenario-visualisation challenges of Shaw et al. (Citation2009) mentioned in Section 1.
In the case study presented here, engagement with stakeholders and the public has enabled dialogue, exchange of opinions and feedback on land use to be improved, now and in the future. The LS scenario emerged as the preferred future scenario across a range of different user sessions as justified by its combined benefits in linking the natural environment with local priorities and the importance of good land management. It also highlighted the importance that participants placed upon the role of communities in making land-use decisions that benefit the wider community. The results are being used to inform the improved design of tools for eliciting public responses to prospective changes in land-use planning. Although it is not possible to produce objective scenarios of future land uses, as scenarios all contain some subjective interpretations of change that require to be transparently declared, they nevertheless can provide a robust basis for exploration of land-use options with stakeholders and the public by presenting multiple alternative futures. Feedback on the use of interactive landscape visualisation for scenario exploration through a virtual reality environment was strongly positive. Over 80% reported it effective for capturing views on priorities for future land uses including the role of climate change in modifying existing options. Positive comments included ease of representation of alternative future land uses, and the opportunity to discuss benefits and risks associated with different scenarios. Negative comments related to static content of models and lack of texture in ground vegetation. VRML models are stored in a text file format and accordingly are much slower to load or run compared with binary format models. This limits the number of 3D and 2D objects that can be included in the model and therefore affects the level of realism. For the size and resolution of the Tarland model, as run on high-end PCs, we were limited to ca. 20 trees per hectare. This may be improved by use of other formats and simulation software.Footnote1
In this context, it is apparent that there are trade-offs between the level of detail in the models and their ease of use in representing and simulating land-use change. In the case study, full use of photorealism was not employed in the visualisations with an emphasis instead placed on a function-led approach that maximised user interactivity. Although participants commented on the aesthetic limitations of vegetation textures they did not consider this to affect their interpretation of landscape change. This has specific reference to the challenge identified by Shaw et al. (Citation2009) of the use of scenario visualisation in informing policy and local decision-making. In terms of enhanced awareness of change and recognition of the possibility that future changes may be rather different from the past or present, then the visualisations can be considered successful in promoting increased deliberation of the requirements for adaptation and the development of new response options. For this challenge, additional levels of detail may actually be a distraction or counter-productive in the public engagement process (Glander and Döllner Citation2009) and may lead to an assumption that future change is more predictable than it actually is in practice because of the illusion provided by a more detailed landscape representation (Brown et al. Citation2006). The communication of the uncertainties associated with scientific information in a transparent format, particularly with regard to future change, therefore remains an important direction for visualisation research in order to engage and inform audiences without applying misleading detail or exaggeration. Further interactive development of the LS scenario has shown the potential of interactive visualisation to further develop scenario storylines, which may be particularly pertinent for this example as the high level of local autonomy had previously meant that land-use change had been difficult to model (Brown and Castellazzi Citation2014).
The issue of ‘realism’ also links with another challenge of Shaw et al. (Citation2009): the ethical issues associated with producing visualisations that are both engaging through their dramatic content whilst also being scientifically defensible as plausible outcomes of land-use change. In the case study, the display of multiple alternative scenarios was considered particularly important to highlight the uncertainty of the future and to distinguish between those aspects of change that are either controllable or uncontrollable in terms of local decisions. The use of full photorealism for landscape visualisation could further enhance the dramatic content but this asks further questions of the scenario generation process and associated scientific framework (e.g. species and habitat composition for vegetation changes) that may not be able to be justified. This is particularly relevant because of the recognition that emotion can be a key influence in communicating climate change (Spence and Pidgeon Citation2010), especially when it is linked with notions of ‘place’ and ‘identity’ in the landscape that are often difficult to articulate because of the intangible and pluralistic benefits they provide (Tengberg et al. Citation2012). For example, the historic continuity of the landscape can have an important association with social and cultural memory, and hence be a key feature of community identity (Graham, Mason, and Newman Citation2009). These issues have been exemplified in rural landscapes of Scotland by the controversy associated with planned development of large wind farms which has resulted in official guidance on the use of visualisations (SNH Citation2014).
Hence, further research on the ethical dimensions linked to emotional responses from scenario visualisation would seem to be particularly pertinent. Linking of the visualisations to narrative descriptions to elaborate the scenario storyline appears to be particularly important here in terms of the development of scenarios as ‘mental models’ or ‘learning machines’ to think about the future (Berkhout, Hertin, and Jordan Citation2002; Nicholson-Cole Citation2005). The original SRES were ‘expert’ scenarios but stakeholders or the public can provide equally legitimate interpretations of the future, especially with facilitation to help disengage from the predilections of the present-day (so-called ‘business as usual scenarios’: Brown et al. Citation2015). Another approach that has proved useful in developing and communicating future land-use scenarios is to make the process iterative so that one set of outputs prompts further dialogue and interaction which can then be used to explore further options for change in the scenarios (Brown and Castellazzi Citation2014). In the visualisations for the case study, this was particularly investigated at the local level through the LS scenario which emphasised local decision-making. It should also be noted that although the present case study only presents a snapshot of the future (for the year 2050), scenario storylines can also be further developed through the use of transient scenarios to show pathways of change through quantitative simulations of the intervening years, a process that may also be further facilitated through visualisation-based time-series techniques (notably animation).
The third challenge of Shaw et al. (Citation2009) is related to the involvement of all members of the community. In this context, the visualisation process could certainly be identified as engaging sectors of the community that often normally do not become involved with the planning process because of either issues relating to its technical content or its assumed lack of relevance. As evidenced by the description of participants, the sessions included a broader spectrum of society than those ‘stakeholders’ that are normally associated with traditional planning processes, notably including younger people and others that are not typically engaged. However, enhanced engagement does not necessarily imply a more inclusive decision-making process. Nevertheless, as reported above the material was typically considered by participants to be more informative and compelling than that presented through the conventional planning process (e.g. static maps). In addition, the use of a visualisation theatre provided a platform for a shared deliberative experience which offers the possibility of it being used in developing collective rather than individual actions, as was trialled with the interactive content in the LS scenario. In this context, interaction with the scenario visualisations can be developed into a more active and creative forum for further developing scenario content rather than the original passive format. Recent technological developments in 3D stereoscopic viewing offer an alternative platform to develop interactive visualisation but an enhanced immersive experience may be a more individual experience than the shared platform that the theatre can provide.
Further research is therefore required on the use of different visualisation media with diverse audiences, including the role of data and time-intensive formats compared to more simple visualisations, together with the role of interactivity in considering different land-use options. The diffusion of 3D visualisation into the everyday world, particularly with gaming technology, has increased levels of expectation, particularly amongst younger generations. Further development of landscape visualisation may also include multi-sensory experiences (e.g. location-related sound) and the use of augmented reality in the planning and design of future environments (Lange Citation2011). This can also include further development in conjunction with the emerging principles of participatory GeoDesign (Cinderby Citation2010; Steiner et al. Citation2013).
The opportunity for further development of animation also remains to be tested. The terrain model and associated data used for the case study can be exported to Autodesk's FBX format, and imported into Autodesk's Maya modelling and animation software in order to add water elements, lighting, animations and hyper-links to other data (e.g. video clips and photographs). Objects such as virtual humans and cars can be animated by attaching them into created paths (random or predetermined). Development of tools currently includes the use of animated features to test impacts of changes in land-cover features on landscapes due to disturbance caused by movement.
For advancing the Digital Earth agenda, it is also pertinent to consider the accessibility and transferability of research and technology applied in the case study. Scenarios can be iteratively developed from simple qualitative to more complex quantitative descriptions depending upon time available and user feedback. The LandSFACTS modelling tool used for the simulations is freely available whilst also being flexible in its application but as with GIS software it takes time to become familiar with its potential. The use of GIS to manipulate geospatial data provides the key link with the more advanced visualisation capabilities presented herein and developed using specialist software and the VLT. However, this does not preclude the development of more portable visualisation in desktop settings or through now almost ubiquitous web technology (e.g. VRML). The key distinguishing feature of the VLT was its capacity to be used as an interactive participatory forum for viewing visualisations but this does not exclude adoption of lower-cost alternatives. As applications such as Google Earth have demonstrated (Sheppard and Cizek Citation2009), there are many alternative routes to engage a Digital Earth audience. The additional insights that can be provided by advanced immersive and inclusive visualisation are likely to occur when addressing challenges, such as responding to climate change, that have been termed ‘wicked’ problems because they defy conventional decision-making approaches (Shum Citation2003).
In conclusion, the case study supports previous work in identifying considerable technical scope for further development of landscape visualisation and its use in participatory scenario development. This is particularly enhanced by the increased availability of high-resolution data, which allows an enhanced focus on local issues. These advances can help to meet an increased demand and expectation for relevant information to understand, interpret and plan for change. In addition, the case study suggests the potential for visualisation to provide improved interactivity and user engagement to record perceptions and preferences. However, it is particularly important that these technical developments also proceed in tandem with new research to explore issues associated with inclusion, behaviours and ethics, so that guidelines for scientific transparency and good practice are also developed to ensure the technology is used in informative and constructive ways.
Disclosure statement
No potential conflict of interest was reported by the authors.
Funding
This work was supported by funding from the Land Use Theme of the Scottish Government Strategic Research Programme on Environmental Change.
Notes
1. For example, tests show export to Vega Scene Graph Binary format to be run in Vega Prime (Presagis Citation2012) could double or triple the number of trees per hectare compared with VRML-based models.
References
- 3D Nature. 2012. http://3dnature.com/.
- Ball, J., N. Capanni, and S. Watt. 2008. “Virtual Reality for Mutual Understanding in Landscape Planning.” International Journal of Social Sciences 27 (2): 78–88.
- Berkhout, F., J. Hertin, and A. Jordan. 2002. “Socio-economic Futures in Climate Change Impact Assessment: Using Scenarios as ‘Learning Machines’.” Global Environmental Change Human Policy Dimensions 12 (2): 83–95. doi: 10.1016/S0959-3780(02)00006-7
- Bethesda Softworks® (a ZeniMax Media Company). 2011. “The Elder Scrolls® IV: Shivering Isles™ (Oblivion) Emergent Game Technologies, Inc. – GamebryoTM, Gamebryo and FloodgateTM.” http://www.emergent.net/en/Products/Gamebryo/.
- Bishop, I. D., and D. R. Miller. 2007. “Visual Assessment of Off-shore Wind Turbines: The Influence of Distance, Contrast, Movement and Social Variables.” Renewable Energy 32 (5): 814–831. doi: 10.1016/j.renene.2006.03.009
- Brown, I., P. Berry, M. Everard, L. Firbank, P. Harrison, L. Lundy, C. Quine, J. Rowan, R. Wade, and K. Watts. 2015. “Identifying Robust Response Options to Manage Environmental Change Using an Ecosystem Approach: A Stress-testing Case Study for the UK.” Environmental Science & Policy 52: 74–88. doi: 10.1016/j.envsci.2015.05.005
- Brown, I., and M. Castellazzi. 2014. “Scenario Analysis for Regional Decision Making on Sustainable Multifunctional Landscapes.” Regional Environmental Change 14 (4): 1357–1371. doi: 10.1007/s10113-013-0579-3
- Brown, I., S. Jude, S. Koukoulas, R. Nicholls, M. Dickson, and M. Walkden. 2006. “Dynamic Simulation and Visualization of Coastal Erosion.” Computers, Environment and Urban Systems 30 (6): 840–860. doi: 10.1016/j.compenvurbsys.2005.08.002
- Burch, S., S. Sheppard, A. Shaw, and D. Flanders. 2010. “Planning for Climate Change in a Flood-prone Community: Municipal Barriers to Policy Action and the Use of Visualizations as Decision-support Tools.” Journal of Flood Risk Management 3 (2): 126–139. doi: 10.1111/j.1753-318X.2010.01062.x
- Castellazzi, M., I. Brown, A. Gimona, and L. Poggio. 2012. “Exploring Path-dependencies and Spatial Variability in Landscape Scale Scenarios for Ecosystem Services Assessments.” International Environmental Modelling and Software Society (iEMSs) 2012 International Congress. Managing resources of a limited planet: Pathways and visions under uncertainty, Leipzig, Germany. http://www.iemss.org/sites/iemss2012/proceedings.html.
- Castellazzi, M., J. Matthews, F. Angevin, C. Sausse, G. Wood, P. Burgess, I. Brown, K. Conrad, and J. Perry. 2010. “Simulation Scenarios of Spatio-temporal Arrangement of Crops at the Landscape Scale.” Environmental Modelling and Software 25 (12): 1881–1889. doi: 10.1016/j.envsoft.2010.04.006
- Cinderby, C. 2010. “How to Reach the ‘Hard-to-Reach’: The Development of Participatory Geographic Information Systems (P-GIS) for Inclusive Urban Design in UK Cities.” Area 42 (2): 239–251. doi: 10.1111/j.1475-4762.2009.00912.x
- Coffey, J., D. J. Beard, and D. A. Ryan. 2007. “Visualising Coastal Seabed Characteristics: Using VRML Models to Present Three Dimensional Spatial Data Via the Web.” Journal of Spatial Science 52 (1): 133–143. doi: 10.1080/14498596.2007.9635108
- Council of Europe. 2000. The European Landscape Convention. Firenze, ETS No. 176. http://conventions.coe.int/Treaty/en/Treaties/html/176.htm.
- Craglia, M., K. de Bie, D. Jackson, M. Pesaresi, G. Remetey-Fülöpp, C. Wang, A. Annoni, et al. 2012. “Digital Earth 2020: Towards the Vision for the Next Decade.” International Journal of Digital Earth 5 (1): 4–21. doi: 10.1080/17538947.2011.638500
- Dockerty, T., A. Lovett, K. Appleton, A. Bone, and G. Sunnenberg. 2006. “Developing Scenarios and Visualisations to Illustrate Potential Policy and Climatic Influences on Future Agricultural Landscapes.” Agriculture, Ecosystems and Environment 114 (1): 103–120. doi: 10.1016/j.agee.2005.11.008
- Ebi, K. L., S. Hallegatte, T. Kram, N. W. Arnell, T. R. Carter, J. Edmonds, E. Kriegler, et al. 2014. “A New Scenario Framework for Climate Change Research: Background, Process, and Future Directions.” Climatic Change 122 (3): 363–372. doi: 10.1007/s10584-013-0912-3
- Falk, J., and J. Balling. 2010. “Evolutionary Influence on Human Landscape Preference.” Environment and Behavior 42 (4): 479–493. doi: 10.1177/0013916509341244
- Fry, G., M. S. Tveit, Å. Ode, and M. D. Velarde. 2009. “The Ecology of Visual Landscapes: Exploring the Conceptual Common Ground of Visual and Ecological Landscape Indicators.” Ecological Indicators 9 (5): 933–947. doi: 10.1016/j.ecolind.2008.11.008
- Gaspar, M. S. F., and R. Bastos. 2011. “Accurate Infrared Tracking System for Immersive Virtual Environments.” International Journal of Creative Interfaces and Computer Graphics 2 (2): 318–320. doi: 10.4018/jcicg.2011070104
- Glander, T., and J. Döllner. 2009. “Abstract Representations for Interactive Visualization of Virtual 3D City Models.” Computers, Environment and Urban Systems 33 (5): 375–387. doi: 10.1016/j.compenvurbsys.2009.07.003
- Goodchild, M. F. 2008. “The Use Cases of Digital Earth.” International Journal of Digital Earth 1 (1): 31–42. doi: 10.1080/17538940701782528
- Goodchild, M. F., H. Guo, A. Annoni, L. Bian, K. de Bie, F. Campbell, and P. Woodgate. 2012. “Next-generation Digital Earth.” Proceedings of the National Academy of Sciences of the United States of America 109 (28): 11088–11094. doi: 10.1073/pnas.1202383109
- Graham, H., R. Mason, and A. Newman. 2009. Historic Environment, Sense of Place and Social Capital. Report commissioned by English Heritage.
- Holman, I. P., M. D. A. Rounsevell, S. Shackley, P. A. Harrison, R. J. Nicholls, P. M. Berry, and E. Audsley. 2005. “A Regional, Multi-sectoral and Integrated Assessment of the Impacts of Climate and Socioeconomic Change in the UK.” Climatic Change 71 (1–2): 9–41. doi: 10.1007/s10584-005-5927-y
- Hulme, M., and S. Dessai. 2008. “Negotiating Future Climates for Public Policy: A Critical Assessment of the Development of Climate Scenarios for the UK.” Environmental Science & Policy 11 (1): 54–70. doi: 10.1016/j.envsci.2007.09.003
- Jude, S. R., A. P. Jones, A. R. Watkinson, I. Brown, and J. A. Gill. 2008. “Investigating the Potential Role of Visualization Techniques in Participatory Coastal Management.” Coastal Management 36 (4): 331–349. doi: 10.1080/08920750802266346
- Kaplan, R., and S. Kaplan. 1989. The Experience of Nature. Cambridge: Cambridge University Press.
- Kellert, S., and E. Wilson. 1993. The Biophilia Hypothesis. Washington, DC: Island Press/Shearwater Books.
- Lange, E. 2011. “99 Volumes Later: We Can Visualise. Now What?” Landscape and Urban Planning 100 (4): 403–406. doi: 10.1016/j.landurbplan.2011.02.016
- Lorenzoni, I., S. Nicholson-Cole, and L. Whitmarsh. 2007. “Barriers Perceived to Engaging with Climate Change Among the UK Public and Their Policy Implications.” Global Environmental Change 17 (3–4): 445–459. doi: 10.1016/j.gloenvcha.2007.01.004
- MEA. 2005. Ecosystems and Human Well Being. Washington, DC: Island Press.
- Miller, D. R., J. Morrice, P. Horne, and J. Ball. 2007. “Integrating Programmes of Awareness and Education for Professionals and the Public.” Proceedings of environment 2007, Abu Dhabi.
- Moser, S. C., and L. Dilling. 2007. Creating a Climate for Change: Communicating Climate Change and Facilitating Social Change. Cambridge: Cambridge University Press.
- Nakicenovic, N., J. Alcamo, G. Davis, B. de Vries, J. Fenhann, S. Gaffin, K. Gregory, et al. 2000. Special Report on Emissions Scenarios. Working Group III, Intergovernmental Panel on Climate Change (IPCC). Cambridge: Cambridge University Press.
- Nicholson-Cole, S. A. 2005. “Representing Climate Change Futures: A Critique on the Use of Images for Visual Communication.” Computers, Environment and Urban Systems 29 (3): 255–273. doi: 10.1016/j.compenvurbsys.2004.05.002
- de Nijs, T. C. M., R. de Niet, and L. Crommentuijn. 2004. “Constructing Land Use Maps of the Netherlands in 2030.” Journal of Environmental Management 72 (1–2): 35–42. doi: 10.1016/j.jenvman.2004.03.015
- Ode, A., G. Fry, P. Messager, D. Miller, and M. Tveit. 2009. “Indicators of Perceived Naturalness as Drivers of Landscape Preference.” Journal of Environmental Management 90 (1): 375–383. doi: 10.1016/j.jenvman.2007.10.013
- Ordnance Survey. 2015. Accessed June 3, 2015. http://www.ordnancesurvey.co.uk/business-and-government/products/mastermap-products.html.
- Presagis. 2012. http://www.presagis.com/.
- Richardson, A., L. Bracegirdle, S. McLachlan, and S. R. Chapman. 2013. “Use of a Three-dimensional Virtual Environment to Teach Drug–Receptor Interactions.” American Journal of Pharmaceutical Education 77 (1): Article 11. doi:10.5688/ajpe77111
- Rounsevell, M. D. A., I. Reginster, M. B. Araujo, T. R. Carter, N. Dendoncker, F. Ewert, J. I. House, et al. 2006. “A Coherent Set of Future Land Use Change Scenarios for Europe.” Agriculture, Ecosystems and Environment 114 (1): 57–68. doi: 10.1016/j.agee.2005.11.027
- Rua, H., and P. Alvito. 2011. “Living the Past: 3D Models, Virtual Reality and Game Engines as Tools for Supporting Archaeology and the Reconstruction of Cultural Heritage – The Case-study of the Roman Villa of Casal de Freiria.” Journal of Archaeological Science 38 (12): 3296–3308. doi: 10.1016/j.jas.2011.07.015
- Scannell, L., and R. Gifford. 2013. “Personally Relevant Climate Change the Role of Place Attachment and Local Versus Global Message Framing in Engagement.” Environment and Behavior 45 (1): 60–85. doi: 10.1177/0013916511421196
- Schroth, O., J. Angel, S. R. J. Sheppard, and A. Dulic. 2014. “Visual Climate Change Communication: From Iconography to Locally Framed 3d Visualization.” Environmental Communication. doi:10.1080/17524032.2014.906478
- Scottish Government. 2011. Getting the Best from Our Land: A Land Use Strategy for Scotland. Edinburgh.
- Shaw, A., S. Sheppard, S. Burch, D. Flanders, A. Wiek, J. Carmichael, J. Robinson, and S. Cohen. 2009. “How Futures Matter – Synthesizing, Downscaling, and Visualizing Climate Change Scenarios for Participatory Capacity Building.” Elsevier Global Environmental Change 19 (4): 447–463. doi: 10.1016/j.gloenvcha.2009.04.002
- Sheppard, S. R. J. 2005. “Landscape Visualisation and Climate Change: The Potential for Influencing Perceptions and Behaviour.” Environmental Science & Policy 8 (6): 637–654. doi: 10.1016/j.envsci.2005.08.002
- Sheppard, S. R. J. 2012. Visualizing Climate Change: A Guide to Visual Communication of Climate Change and Developing Local Solutions. Abingdon: Earthscan/Routledge.
- Sheppard, S. R. J., and P. Cizek. 2009. “The Ethics of Google-Earth: Crossing Thresholds from Spatial Data to Landscape Visualization.” Journal of Environmental Management 90 (6): 2102–2117. doi: 10.1016/j.jenvman.2007.09.012
- Sheppard, S. R. J., A. Shaw, D. Flanders, S. Burch, A. Wiek, J. Carmichael, J. Robinson, and S. Cohen. 2011. “Future Visioning of Local Climate Change: A Framework for Community Engagement and Planning with Scenarios and Visualization.” Futures 43 (4): 400–412. doi: 10.1016/j.futures.2011.01.009
- Shum, S. J. B. 2003. “The Roots of Computer Supported Argument Visualization.” In Visualizing Argumentation – Tools for Collaborative and Educational Sense-making, edited by P. Kirschner, S. J. B. Shum, and C. S. Carr, 185–204. London: Springer-Verlag.
- SNH. 2014. Visual Representation of Wind Farms. Scottish Natural Heritage. Accessed June 2, 2015. http://www.snh.gov.uk/publications-data-and-research/publications/seitarch-the-catalogue/publication-detail/?id=846.
- Spence, A., and N. F. Pidgeon. 2010. “Framing and Communicating Climate Change: The Effects of Distance and Outcome Frame Manipulations.” Global Environmental Change 20 (4): 656–667. doi: 10.1016/j.gloenvcha.2010.07.002
- Spence, A., W. Poortinga, and N. Pidgeon. 2012. “The Psychological Distance of Climate Change.” Risk Analysis 32 (6): 957–972. doi: 10.1111/j.1539-6924.2011.01695.x
- Steiner, F., M. Simmons, M. Gallagher, J. Ranganathan, and C. Robertson. 2013. “The Ecological Imperative for Environmental Design and Planning.” Frontiers in Ecology and the Environment 11 (7): 355–361. doi: 10.1890/130052
- Tengberg, A., S. Fredholma, I. Eliassona, I. Knez, K. Saltzmana, and O. Wetterberg. 2012. “Cultural Ecosystem Services Provided by Landscapes: Assessment of Heritage Values and Identity.” Ecosystem Services 2: 14–26. doi: 10.1016/j.ecoser.2012.07.006
- Tress, B., and G. Tress. 2003. “Scenario Visualisation for Participatory Landscape Planning: A Study from Denmark.” Landscape and Urban Planning 64 (3): 161–178. doi: 10.1016/S0169-2046(02)00219-0
- UNEP. 2010. Report of the tenth meeting of the conference of the parties to the convention on biological diversity – COP 10, Japan, October.
- Van Lammeren, R., J. Houtkamp, S. Colijn, M. Hilferink, and A. Bouwman. 2010. “Affective Appraisal of 3D Land Use Visualization.” Computers, Environment and Urban Systems 34 (6): 465–475. doi: 10.1016/j.compenvurbsys.2010.07.001
- Vasáros, Z. 2008. “Authenticity and Accuracy of Virtual Reconstructions – A Critical Approach.” CAA2008 session – on the road to reconstructing the past, programs and abstracts, Budapest, April 2–6, 249. ISBN: 978-963-8046-95-6.
- Verburg, P. H., C. J. E. Schulp, N. Witte, and A. Veldkamp. 2006. “Downscaling of Land Use Change Scenarios to Assess the Dynamics of European Landscapes.” Agriculture, Ecosystems and Environment 114 (1): 39–56. doi: 10.1016/j.agee.2005.11.024
- Verhagen, P. 2008. “Dealing with Uncertainty in Archaeology.” CAA2008 session – on the road to reconstructing the past, programs and abstracts, Budapest, April 2–6, 99. ISBN: 978-963-8046-95-6.
- Vervoort, J. M., P. K. Thornton, P. Kristjanson, W. Förch, P. J. Ericksen, K. Kok, J. Ingram, et al. 2014. Challenges to Scenario-guided Adaptive Action on Food Security Under Climate Change. Global Environmental Change.
- VLT. 2012. http://www.hutton.ac.uk/learning/exhibits/vlt.
- Waldhardt, R., M. Bach, R. Borresch, L. Breuer, T. Diekötter, H.-G. Frede, S. Gäth, et al. 2010. “Evaluating Today's Landscape Multifunctionality and Providing an Alternative Future : A Normative Scenario Approach.” Ecology and Society 15 (3): 30. http://www.ecologyandsociety.org/vol15/iss3/art30/.
- Wang, C., D. Miller, Y. Jiang, and G. Donaldson-Selby. 2015. “Use of 3D Visualisation Tools for Representing Urban Greenspace Spatial Planning.” 2015 IEEE international conference on information science and control engineering, Shanghai, April 24–26, 2015.
- Wang, C., T. R. Wan, and I. Palmer. 2010. “Urban Flood Risk Analysis for Determining Optimal Flood Protection Levels Based on Digital Terrain Model and Flood Spreading Model.” The Visual Computer, Springer 26 (11): 1369–1381. doi: 10.1007/s00371-009-0414-5
- Wang, C., T. R. Wan, and I. J. Palmer. 2012. “Automatic Reconstruction of 3D Environment Using Real Terrain Data and Satellite Images.” Intelligent Automation and Soft Computing, TSI 18 (1): 49–63. doi: 10.1080/10798587.2012.10643226
- Wilkinson, A., and E. Eidinow. 2008. “Evolving Practices in Environmental Scenarios: A New Scenario Typology.” Environmental Research Letters 3 (4): 1–11. doi: 10.1088/1748-9326/3/4/045017
- Xfrog. 2011. http://xfrog.com/.