
ABSTRACT
Historically, Lop Nur was a large and famous salt lake that acted as an important geographic position along the ancient ‘Silk Road’, and was associated with the surrounding old civilizations, such as Loulan and Haitou. However, it dried up before 1972. It shows a clear ‘Ear’ feature on synthetic aperture radar (SAR) images. The objective of this paper is to interpret Lop Nur's environmental evolution during its drying-up process based on an analysis of its sodium sedimentary feature. The genetic algorithm-partial least squares approach is introduced as a modeling method to retrieve the subsurface sodium content from polarimetric parameters obtained by Cloude decomposition. As a result, the R2 and root-mean-square error can reach 0.7 and 9.1 g/kg. It is suggested that the subsurface salt content was the primary reason for the bright-grey strips textures on SAR images. Furthermore, our results show that the sodium content along the same strip changed, with its distribution exhibiting consistency with the lake body's movement driven by the strong wind. In future, high-precision topographical data will be considered, and should be helpful in the analysis of lake body movement. The method of this paper can also be applied in other similar dried salt lakes.
1. Introduction
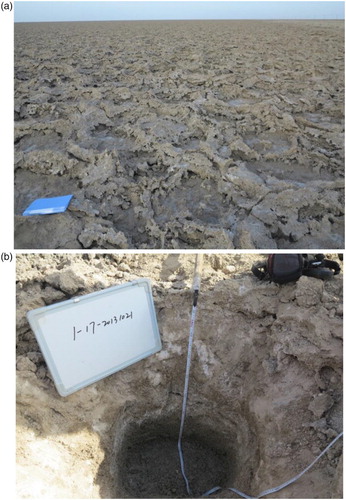
The old Lop Nur Lake is a large salt lake located at the eastern end of Tarim Basin in northwest China, which was an important part of the ancient ‘Silk Road’. In ancient times, many rivers flowed into Lop Nur Lake, which include the Tarim river, the Kongqi River, and the Qarqan River; all of which deposited large amounts of salt minerals into the lake (Xia, Mu, and Lei Citation2002; Xia, Wang, and Zhao Citation2007). However, Lop Nur Lake dried up before 1972 as a result of climate change and environmental evolution (Xia, Wang, and Zhao Citation2007). The ancient Lop Nur Lake is shaped as an ‘Ear’ feature on remote-sensing images (), and its formation, due to the drying-up process, has been a focus of many studies (Zhao et al. Citation2006; Cai et al. Citation2011; Gao et al. Citation2012; Shao et al. Citation2012; Gong et al. Citation2014). As the lake body shrank, lacustrine deposits, especially those containing plenty of salt mineral, were separated out, which are significant in explaining its ear-shaped feature (Gao et al. Citation2014; Zhang et al. Citation2014). Presently, Lop Nur is covered by a dry and hard salt crust, which has a very coarse surface ((a)).
Figure 1. Field investigation routes and sampling site locations. A, B and C are the field routes in 2006 (green line); Ι and II are field routes in 2013 and 2014 (red line). Blue points represent sampling sites used in this study. The blue rectangle is the coverage of the full-polarization ALOS-PALSAR image analyzed in this paper. ALOS PALSAR image in HH polarization, ScanSAR mode, obtained in 2011 was used as a base map. Orange region means western lake and brown region is the eastern lake.
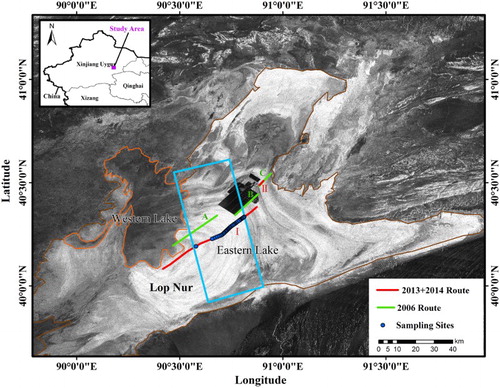
Figure 2. Surface salt crust (a) and sampling pit (b). The surface of Lop Nur (a) is covered by dry hard salt crust, which has cracked, cocked, and been overlaid. In the sampling pit (b), the subsurface shows a clear moisture change from the surface to bottom.
Synthetic aperture radar (SAR) data have an advantage in extremely arid regions due to its strong penetration capability and sensitivity to rough surfaces, as compared with optical imaging, such as Landsat-thematic mapper (TM) images. In comparison with singly and dually polarized data, polarimetric SAR (PolSAR) data can provide a higher amount of attribute information (related to physical propagating processes) of their targets. PolSAR technology can detect subsurface targets’ properties, which will enrich our understanding of natural environmental evolution and promote building a real and scientific Digital Earth. Historically, PolSAR has usually been used to develop retrieval algorithms. Many researchers have proposed different retrieval algorithms based on PolSAR data and acquired accurate results in different fields, such as ice thickness, dry snow density, and soil moisture (Kwok et al. Citation1995; Li, Guo, and Shi Citation2001; Gherboudj et al. Citation2011; Saradjian and Hosseini Citation2011). Accordingly, one scene of phased array type L-band SAR (PALSAR, a sensor) image from advanced land observing satellite (ALOS) was mainly used in this paper to retrieve the subsurface salt distribution in Lop Nur Lake Basin, and the results can show certain environmental evolutionary processes that have occurred.
Faced with the huge amount of information provided by PolSAR data, it is necessary to adopt an appropriate method to extract useful information. The partial least-squares (PLS) approach is a multivariate regression method that was developed by Herman Wold in 1966. PLS is a more efficient multivariate calibration method when compared with other methods such as classical least-squares, inverse least-squares, and principal component regression (Haaland and Thomas Citation1988; Thomas and Haaland Citation1990). Therefore, PLS has been widely used in quantitative analyses, especially hyperspectral analyses (Song et al. Citation2012a). The central idea of PLS is to build a mathematical model that is able to explain a response variable by a set of explanatory variables (Geladi and Kowalski Citation1986; Lindgren, Geladi, and Wold Citation1993). Feature selection is very important in multivariate analysis, which aims at selecting a combination of variables that generate the best result and eliminates variables that produce noise (Centner et al. Citation1996). It has been widely recognized that feature selection can be highly beneficial in multivariate calibration (Thomas Citation1994). Genetic algorithms (GAs) can be successfully used in feature selection, and the subsets of variables selected by the GAs are generally more efficient than those obtained from using classical methods. This is mainly because they can produce a better result by using a lower number of features (Leardi, Boggia, and Terrile Citation1992). It has also been proved that when GAs adds to PLS regression as a feature selection method, it can improve the predictive ability of a PLS model and highly simplify it (Lucasius, Beckers, and Kateman Citation1994; Leardi and Gonzalez Citation1998). Kawamura et al. (Citation2010) compared the performance of GA-PLS with standard full-spectrum PLS (FS-PLS) and iterative stepwise elimination PLS (ISE-PLS) models for predicting pasture mass and quality using field hyperspectral data. Their results showed that genetic algorithm-partial least squares (GA-PLS) produced higher predictive accuracy when compared to FS-PLS and ISE-PLS. However, GA-PLS is seldom used in PolSAR-data-based calibrations. For a tremendous amount of polarimetric information obtained by PolSAR images, GA-PLS is anticipated to be an efficient statistical method for acquiring the most strictly related polarization information of surface parameters.
Lop Nur Lake has a very high salt mineral concentration due to its low geographical location as a catchment basin, and its arid climate. Salt deposits are an important record of environmental evolution, and they can be used to explain its drying-up process. In Lop Nur Lake, the main salt deposit is NaCl (Zhao et al. Citation2006); so the distribution of sodium content can represent the salt distribution in Lop Nur Lake Basin. The crystallization process of salt in the gaps between soil particles causes swelling and cracking of the salt crust, thus changing its surface roughness (Ma et al. Citation2011). SAR signals are strongly sensitive to the surface roughness; so the subsurface salt content is a significant factor used to explain texture features on SAR images. The goal of this paper was to find a correlation between the subsurface salt content and the ‘Ear’ feature of Lop Nur.
In this paper, the retrieval of sodium content in ancient Lop Nur Lake Basin was conducted, followed by the analysis of sedimentary features and its environmental evolution. The method of this paper can also be applied in other similar dried salt lakes, such as the lakes in Qaidam Basin of China.
2. Test site description
Lop Nur is located in the Ruoqiang County of the Xinjiang Uygur Autonomous region, northwestern China. It is the lowest part of the Tarim Basin, which is surrounded by the Tiansha Mountains, the Altun Mountains, and the Kunlun Mountains. Historically, rivers from these mountains, such as the Tarim River, the Konqi River, and the Qarqan River, flowed into the ancient Lop Nur Lake, which formed an extremely large surface area of more than 10,000 km2 (Shao et al. Citation2012). Due to its low topography and its role as a catchment basin, the ancient Lop Nur Lake has a very high salt concentration. The salt mineral deposits are mainly composed of NaCl, along with small amounts of Na2SO4, KCl, MgCl2, CaSO4, and other salts. However, in comparison to its very large surface area, elevation variations are less than 4 m in the ear-shaped region of Lop Nur (Li et al. Citation2008; Wang, Gong, and Shao Citation2014; Wang et al. Citation2014). Therefore, the lake body is easily affected by changes in the surrounding environment and incoming water sources due to its flat terrain.
Lop Nur is an extremely arid region with less than 20 mm of annual precipitation and over 3000 mm of evaporation. This fact has always been considered as the main reason for the drying-up of Lop Nur Lake. Due to its unique location at the eastern end of the Tarim Basin coupled with the extremely dry climate conditions, it was uninhabited by humans for a long time, which is why the drying-up process and its relationship with the surrounding civilizations is still a mystery. Therefore, the study of Lop Nur's environmental evolution has important scientific and historical significances.
3. Field investigations and data source
A total of seven field trips were carried out for this study, with the first field investigation conducted in November 2006. The authors visited the ruins of the Loulan Kingdom and the Lop Nur Lake, where lacustrine deposits were sampled along a 41 km profile at intervals of 2 km to the northeast of Lop Nur Lake. The second field investigation was conducted in November 2008, which included 3 routes, 4 study areas, and 78 sampling sites selected along a profile length of 62 km. The geographic coordinates of each sampling site were recorded using a global positioning system (GPS) device. Another three field trips were completed in December 2008, April 2010, and November 2010 to determine the northern and western parts of the shoreline and to verify the existence of the shoreline of East Lop Nur Lake, which has been buried by the lacustrine deposits of West Lop Nur Lake. In 2013 and 2014, a second sampling work, which covered the profile of the Lop Nur Lake, was performed using the updated measurement methods and tools.
According to their sedimentary characteristics, six lacustrine deposit samples were collected for each sampling site from the surface to the base of each sampling pit ((b)) at different depths and numbered as samples one through six. The depth of the pits ranged from 50 to 120 cm. The samples were kept fresh in sampling boxes and transported to the laboratory for analysis, including moisture testing, ion content (e.g. Na+, Ca2+, K+, Cl−, SO42−), particle size, pH value, and the real part (ε′) and imaginary part (ε″) of the dielectric constant. The sodium content of each sample was determined from laboratory testing.
Combining the field observation in 2013 and 2014 with those from the investigation performed in 2008, it was found that a change in the surface pattern was present due to the covered sand and wind erosion. However, subsurface properties were almost stable because this is a very slow process, and the duration from 2008 to 2014 is relatively short. Thus, the subsurface properties are the focus of this paper. The main field data sources of the field investigations in 2013 and 2014 are shown in .
The six lacustrine deposit samples from each sampling site were divided into two parts based on their moisture content: the upper dry samples and the lower wet samples. The wet samples had very high dielectric constant so that the radar signal was not able to propagate deeper (Gong et al. Citation2007, Citation2014). Therefore, the average sodium content of all dry samples at each sampling site was chosen to analyze the salt content of the lake basin.
One scene of ALOS-PALSAR image (polarimetric mode, 25.61° incidence angle) obtained on 6 May 2009 was mainly used in this paper. Before data analysis, the pre-processing had been finished, which included two steps: one was the radiometric calibration; the other was the geometric correction (in universal transverse Mercator projection/world geodetic system-1984 (UTM/WGS-84) coordinate system). And then, scattering matrix (S matrix) and coherency matrix (T matrix) had also been built for polarimetric decomposition.
4. Methods and GA-PLS modeling
4.1. Polarimetric decomposition
PolSAR data can provide an abundance of information of their targets. Most inversion algorithms based on PolSAR technology are used to find appropriate parameters, which are closely related to targets’ properties and acted as apparent physical processes. In order to quantitatively analyze the scattering mechanisms, decomposition algorithms are usually adopted. In this paper, an eigenvector–eigenvalue-based decomposition, which is a mathematical method, was used.
According to the Cloude theorem, the coherency matrix can be decomposed into a sum of three mutually independent coherency matrixes. Each independent coherency matrix is expressed by an eigenvector and an eigenvalue. More specifically, there are four polarimetric angles (α, β, γ, δ) in each eigenvector and one corresponding eigenvalue (λ).
The decomposition equation is described as(1)
where λi is the eigenvalue and ei is the eigenvector, and [Ti] stands for the independent coherency matrices, which represent three different kinds of scattering mechanisms. The corresponding λi represents the intensity of each scattering mechanism.
In mathematics, independence implies an independent propagation process of electromagnetic wave. Therefore, the total 15 parameters of the 3 independent parts are considered in the following GA-PLS modeling. Additionally, five other polarimetric parameters are calculated from eigenvalues, including anisotropy, anisotropy_lueneburg, pedestal, entropy_shannon, and entropy_shannon_p, which are used because of their ability to better portray the ‘Ear’ feature, and finally forming 20 polarimetric bands. All of the bands were geometrically corrected using ground control points. It is believed that the sodium content at subsurface of Lop Nur Lake Basin should be strongly correlated to a certain polarimetric parameter or a combination of parameters. In this paper, the physical meanings of the parameters are not emphasized; our goal was simply to find a numerical relationship.
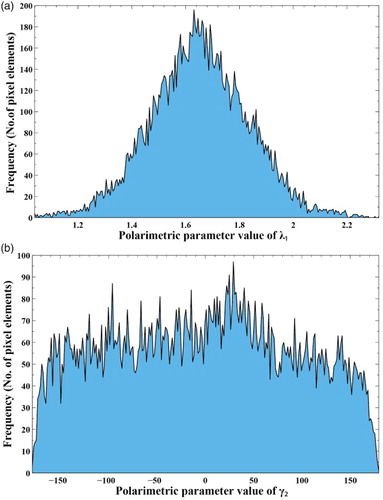
Polarimetric parameter images with clear texture features were considered when we built the following model, and the full-polarization ALOS-PALSAR image was used in this paper. On SAR images, Lop Nur is presented as clear bright and grey strips. The histogram calculated on the same bright strip in each polarimetric parameter image was chosen as a criterion when selecting polarimetric parameters, as shown in . The histogram calculated from a clear strip should have one apparent peak, such as (a). On the contrary, a strip with messy texture features will generate a histogram with many irregular jitters, such as (b). As a result, a sum of 16 polarimetric parameters were selected, including anisotropy, anisotropy_lueneburg, pedestal, entropy_shannon, entropy_shannon_P, λi, αi, βi, δj (i = 1,2,3; j = 1,2).
Figure 3. Comparison of histogram peak shape for texture feature analysis of polarimetric parameter images. (a) and (b) are the histograms calculated from λ1 and γ2, respectively, as an example. Histogram with one apparent peak (a) stands for clear texture features in polarimetric parameter images, while histogram with many irregular jitters (b) represents messy texture features.
4.2. GA-PLS modeling
GA here was to select the most important explanatory variables to the response variable. The polarimetric parameters were encoded with binary strings as chromosomes. A single gene of a chromosome represented a polarimetric parameter and was randomly set to ‘0’ or ‘1’. If a gene was set to ‘1’, then the corresponding polarimetric parameter was selected in the PLS modeling; otherwise the parameter was removed. Details on GA used in our model can be found in Leardi and Gonzalez (Citation1998) and Song et al. (Citation2012b).
PLS univariate regression was chosen as the modeling method. A simplified PLS model consists of two outer relations that result from the eigenstructure decomposition of the explanatory variables matrix (i.e. the polarimetric parameter matrix) and the response variable vector (i.e. the sodium content vector), and an inner relation that links the two resultant score matrices (Geladi and Kowalski Citation1986). Let X (n × m) represent the explanatory matrix and y (n × 1) represent the response vector, where n stands for the number of samples and m stands for the number of polarimetric parameters. The two outer relations are the result of the principle component analysis applied to X and y, and are described as(2)
(3)
where T and U are the score matrices that summarize the largest variance of X and y, respectively, P and Q are the loading matrices, and E and F are the residual matrices. The goal of PLS modeling is to minimize the norm of F while getting a maximum covariance between T and U by the inner relation as a linear regression equation:(4)
where B is the regression coefficient matrix. The cross-validation method that leaves out one sample at a time was used in this research to select the optimal number of components for the PLS model.
The implementation of GA-PLS modeling was conducted by a group of Matlab programs. The algorithm is described in detail in Li, Ustin, and Riano (Citation2007) and Leardi and Gonzalez (Citation1998). The root-mean-square error (RMSE) was used to evaluate the performance of the GA-PLS model both in calibration and validation. The RMSE is set as(5)
where N is the number of samples in the validation or calibration set, yi′ is the evaluated value of sample i, and yi is the measured value of sample i. The final GA-PLS retrieval model is a linear equation, which is described as(6)
where b is the final regression coefficient vector and c is the residual vector.
Through the Cloude polarimetric decomposition method, different polarimetric parameters are generated from the original SAR image. All of the parameters have correlations with attributes of the targets and are expected to explain them. GA is used to select the parameters that can best explain the response variable. An accurate mathematical relation between the selected parameters and the response variable can be realized via PLS modeling. shows a detailed flow chart of the method used in this paper.
Figure 4. Flow chart of the study methodology.
5. Results and discussion
5.1. GA-PLS modeling results
According to the location of the samples on the SAR image, a total of 33 samples were selected for GA-PLS modeling. An estimated 70% of the samples were applied to the calibration and 30% were used for the validation. Based on the eigenvector-eigenvalue polarimetric decomposition method, 16 polarimetric parameters were calculated at each sampling site, which composed the explanatory variable matrix X. Simultaneously, the average sodium content of the upper dry layer at each sampling site was obtained from laboratory measurements in order to represent Lop Nur salt sedimentary features, and composed the response variable vector y.
Through GA-PLS modeling, the final retrieval model can be calculated as a linear regression equation described as(7)
where xi is the polarimetric parameters selected by GA-PLS modeling and ai is the corresponding regression coefficient (i = 1,2,3 … ). In this study, xi stands for δ2, β1 and anisotropy, and ai is 0.1543, −0.4581 and −0.5503, respectively.
The scatter plot of the GA-PLS modeling result is shown in . The black solid dots represent the calibration samples, while hollow circles represent the validation samples (). The R2 and RMSE shown in are the corresponding value of validation. The black solid line is the 1:1 standard line.
Figure 5. Scatter plot of measured and estimated sodium content based on GA-PLS modeling method. R2 and RMSE of validation are shown, respectively. The black solid dots represent the calibration samples, while hollow circles represent the validation samples. The black solid line is the 1:1 standard line.
The numerical value of R2 reached a value of 0.7 and the deviation RMSE was 9.1 g/kg, respectively. This means that the polarimetric parameters can retrieve the subsurface sodium content with accepted precision. From the distribution of the scattered points shown in , it appears that there is a linear correlation between the polarimetric parameters and the subsurface sodium content. For a certain sample, the more accurately the subsurface sodium content is predicted, the closer the scattered point is located to the 1:1 standard line. In general, most sampling points are equally distributed about the standard line. The continuity of the distribution of the scattered points is determined by the measured subsurface sodium content. In the scatter plot, only two points are located at the left-most section along the measured subsurface sodium content axes. In the field, the two samples were collected in the western part of Lop Nur Lake, which are more easily rushed by a shortcoming of water from mountain ice melting and rivers. As a result, the western part accumulates relatively lower salt content than other areas within the basin. However, there are still some other scattered points that have relatively larger deviations than other points. The small sample size and complex field conditions are considered to be the main reasons causing these deviations. Nevertheless, the retrieval result cannot disturb the distribution rule in the Lop Nur Lake Basin, and its environmental explanations are more important in this study.
5.2. The distribution of sodium content and environmental meanings
In the final GA-PLS regression model, three polarimetric parameters were selected to make a significant contribution to the subsurface sodium content variance. Based on the regression coefficient calculated in the GA-PLS modeling, the subsurface sodium content distribution map of Lop Nur () can be obtained by applying the three polarimetric parameter images to the final linear regression equation. In , color changes from red to blue imply a sodium content change from high to low.
Figure 6. Subsurface sodium content distribution map of Lop Nur. Color changes from red to blue imply a sodium content change from high to low. It was found that the sodium content along the same strip changed, and the phenomenon is called ‘same strip, different sediments’.
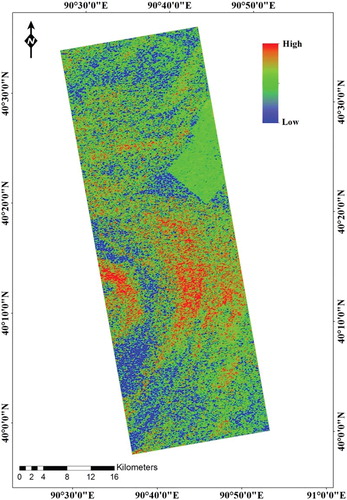
In , the subsurface sodium content distribution map presents clear lake shorelines in the lake basin shaped as an ‘Ear’ feature like the original SAR image. In general, the bright regions in the SAR image have relatively higher sodium content in the retrieval map, while grey regions have lower values. In the entire Lop Nur Lake Basin, the main salt sediments are sodium salts, such as NaCl and Na2SO4, associated with a small amount of potassium, calcium, and magnesium salts. Therefore the sodium content distribution can portray the salt sedimentary content in Lop Nur Lake Basin.
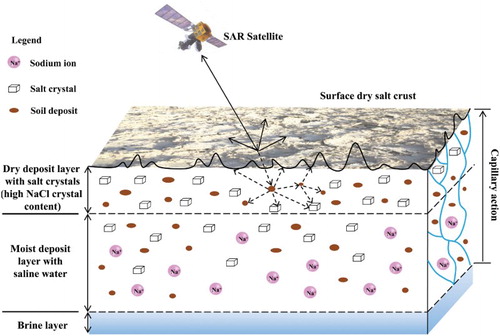
The subsurface salt content is a significant reason for the bright-grey strips texture in Lop Nur, as it will change the surface micro-topography. describes the subsurface sedimentation features in different deposition layers and the scattering mechanisms of the surface and subsurface. Surface roughness is an important factor that influences the backscattering signals recorded by SAR. In the original SAR image of Lop Nur, the bright strips imply rougher surfaces and grey strips stand for relatively lower roughness (Gong et al. Citation2013; Gao et al. Citation2014). During the sedimentary process of the lake basin, the brine under the moist saline deposits layer will go up to the surface by capillary action. The surface and the subsurface will increasingly accumulate salts and then they will quickly crystallize due to the extremely arid climate in Lop Nur. The salt crystals mixed with other lacustrine deposits (sands) produce the hard dry salt crust surface. With an increasing salt content and constant crystallization action, the salt crust will swell, crack, cock and be overlaid and ultimately cause the rough surface (Ma et al. Citation2011). This means that the higher the salt content, the rougher the surface. This is also the reason why the retrieval sodium content has a strong correlation with the bright-grey strips.
Figure 7. Profile of subsurface sedimentation structure and scattering mechanisms in Lop Nur. Blue curves stand for the rising brine among the interspace of soil through capillary action. The cubes represent salt crystals. Pink spheres are the sodium ions in saline water. Brown solid ellipses stand for soil deposits.
In general, along the same shoreline, the salt content should be the same because it is formed in the same sedimentary conditions and over the same time period. However, from the sodium content retrieval map shown in , it is found that the same shoreline displays different amounts of salt content and exhibits an obvious regularity, especially in the external shorelines. From the northeast to the southwest section of the lake basin, the color in each strip changes from red to blue, which signifies that the salt content changes from high to low. The inner ear-shaped strips are not present in this variance trend of the salt content, as the inner section of Lop Nur is often influenced by short-term arrivals of water supplies from western rivers and mountain snow melt (Xia, Wang, and Zhao Citation2007). The autochthonous salt crust of the inner strips is thus destroyed, but the external part of the ear-shaped section, which is mainly discussed here, retains autochthonous sedimentary characteristics.
To explain this phenomenon, wind is suggested here as a dominant factor. According to historical data, Lop Nur suffers from strong northeast wind often and has an annual ‘gale time’ with a wind intensity greater than or equal to 7 (a wind intensity of 7 corresponds to a wind speed of 13.9–17.1 m s−1) exceeds 79.4 days (Xia, Wang, and Zhao Citation2007). During periods when Lop Nur Lake was filled with saline water, wind stress could have changed the force equilibrium of the water body and the lake current system, causing a surface tilt (Wang et al. Citation2014). Based on this viewpoint, when the northeast wind prevailed in Lop Nur, the water body would have a small positional offset from northeast to southwest, and two kinds of sedimentary mechanism occurred in the lake basin: one was a regular lake salt mineral sedimentation process when the lake basin was covered by saline water, and the second was a relatively quick salt crystallization sedimentation process when the muddy lake basin was exposed to air. Due to the exposure to air, salt mineral crystals could be easily formed in the extremely arid climate condition along the muddy lakeshore with 3000 mm or more of annual evaporation under the strong wind.
is a sketch map that depicts the water surface change in a profile of the ear-shaped section along the wind direction. During the ‘gale time’, the water surface will change from the horizontal location AB to the tilt location CD. When the water surface location turned to CD, the AC section of the lake basin would be exposed to air and the BD section would be covered by saline water, respectively. When the water surface returns to the AB position, AC would be covered by lake water again and BD would be exposed to air. The two periods are considered to be one cycle and would be repeated many times. Therefore, in the AC section, both quick salt crystallization sedimentation and the regular lake salt mineral sedimentation occurred. By contrast, in the CB section, only regular lake salt mineral sedimentation occurred. This is why AC has a higher salt content than CB. According to this evolutionary mechanism, the wind factor is considered here as the major reason for the salt content variance along the same ear-shaped strip.
Figure 8. Profile of water surface change in ancient Lop Nur Lake along the prevailing wind direction (from the northeast (NE) to southwest (SW)). AB and CD is the initial and tilt water surface location when the wind blows, respectively.
Based on the viewpoint proposed above, the wind factor plays a significant role in the environmental evolution of Lop Nur Lake, and generates a regular sedimentary record on the shorelines. Moreover, the lake body movement in the orientation perpendicular to the prevailing wind direction should also be considered in further studies.
6. Conclusions
During the drying-up process of the Lop Nur Lake, the subsurface of the lake basin has accumulated a tremendous amount of mineral salt deposits, which is an important sedimentary record that can be used to explain its environmental evolution. Meanwhile, PolSAR, as an advanced technology, has an apparent advantage in extremely arid regions such as Lop Nur, and can provide vast attribute information of their targets. Therefore, the goal of this paper was to determine the subsurface salt content distribution rule based on PolSAR data.
In this paper, GA-PLS was introduced as a retrieval algorithm to build a correlation between polarimetric parameters and the subsurface sodium content. Polarimetric decomposition technology was mainly used in this study to generate polarimetric parameters, which exhibited different texture features of the ‘Ear’ section in Lop Nur. Cloude decomposition was first conducted in order to extract polarimetric parameter values. Then, through GA-PLS modeling, a mathematical retrieval model was generated. As a result, the R2 of validation reached 0.7 and the RMSE was 9.1 g/kg. This means that the subsurface sodium content was retrieved by the polarimetric parameters with an acceptable precision. Thus, through application of the retrieval model, a subsurface sodium content distribution map was generated. It was observed that the retrieval map showed a clear ‘Ear’ feature and the subsurface sodium content distribution presented a regularity similar to that of the bright-grey strips features on SAR images. Based on an analysis of the relationship between the subsurface salt crystallization and the surface roughness, the subsurface salt content was proved to be a significant reason for the bright-grey strips texture features on SAR images.
Furthermore, the subsurface sodium content distribution characteristic along the same shoreline was also analyzed. It was figured out that the sodium content presented an obvious regularity from northeast to southwest in the external region of the lake basin. The wind factor, which would cause a small offset of the lake water body, was demonstrated to be the primary reason for this special sedimentary record. Movement of the lake body in ‘gale time’ of Lop Nur Lake was analyzed and exhibited consistency with the subsurface sodium content distribution. In addition, topographical features of the Lop Nur Lake will be helpful for the analysis of lake body movement in further studies.
Acknowledgements
The authors would like to take this opportunity to express their sincere appreciation to the anonymous reviewers. Many thanks are also shown for Prof. Touzi Ridha from CCRS (Canada Centre for Remote Sensing), and he provided a unique perspective to the understanding of polarimetry. And the authors are grateful to the Lop Nur team for good comments on geologic interpretation.
Disclosure statement
No potential conflict of interest was reported by the authors.
Additional information
Funding
Related Research Data
References
- Cai, A. M., Y. Shao, H. Z. Gong, G. J. Wang, and C. Xie. 2011. “Analysis of Lop Nur ‘Ear’ Features in Remote Sensing Image and Its Environmental Meaning.” Spectroscopy and Spectral Analysis 31 (6): 1633–1638. doi:10.3964/j.issn.1000-0593(2011)06-1633-06.
- Centner, V., D.-L. Massart, O.E. de Noord, S. de Jong, B.M. Vandeginste, and C. Sterna. 1996. “Elimination of Uninformative Variables for Multivariate Calibration.” Analytical Chemistry 68 (21): 3851–3858. doi:10.1021/ac960321m.
- Gao, Z. H., H. Z. Gong, Y. Shao, and L. F. Wang. 2014. “Analysis of the Formation of the Lop Nur Ear Feature Using Multisource Satellite Imagery.” Journal of Applied Remote Sensing 8. doi:10.1117/1.jrs.8.083537.
- Gao, Z. H., Y. Shao, H. Z. Gong, X. L. Bian, C. Xie, A. M. Cai, Z. Wan, and G. J. Wang. 2012. “Analyzing the Genesis of Lop Nur ‘Ear’ Feature Based on Volume Scattering Characteristic Simulation.” Chinese Journal of Geophysics-Chinese Edition 55 (3): 906–913. doi:10.6038/j.issn.0001-5733.2012.03.020.
- Geladi, P., and B. R. Kowalski. 1986. “Partial Least-Squares Regression: A Tutorial.” Analytica Chimica Acta 185: 1–17. doi:10.1016/0003-2670(86)80028-9.
- Gherboudj, I., R. Magagi, A. A. Berg, and B. Toth. 2011. “Soil Moisture Retrieval over Agricultural Fields from Multi-polarized and Multi-Angular RADARSAT-2 SAR Data.” Remote Sensing of Environment 115 (1): 33–43. doi:10.1016/j.rse.2010.07.011.
- Gong, H. Z., Y. Shao, J. H. Liu, Q. R. Hu, and W. Tian. 2007. “Improved Model for Dielectric Behavior of Moist Saline Soil.” Paper presented at the 5th International Symposium on Multispectral Image Processing and Pattern Recognition, Wuhan, November 15–17.
- Gong, H. Z., Y. Shao, G. J. Wang, A. M. Cai, and T. T. Zhang. 2013. “Polarimetric and Scattering Properties of Subsurface Saline Lacustrine Deposits in Lop Nur Lake Basin, China Using Synthetic Aperture Radar Data.” Chinese Journal of Geophysics-Chinese Edition 56 (2): 431–440. doi:10.6038/cjg20130207.
- Gong, H. Z., Y. Shao, T. T. Zhang, L. Liu, and Z. H. Gao. 2014. “Scattering Mechanisms for the ‘Ear’ Feature of Lop Nur Lake Basin.” Remote Sensing 6 (5): 4546–4562. doi:10.3390/rs6054546.
- Haaland, D. M., and E. V. Thomas. 1988. “Partial Least-Squares Methods for Spectral Analyses 1. Relation to Other Quantitative Calibration Methods and the Extraction of Qualitative Information.” Analytical Chemistry 60 (11): 1193–1202. doi:10.1021/ac00162a020.
- Kawamura, K., N. Watanabe, S. Sakanoue, H. J. Lee, Y. Inoue, and S. Odagawa. 2010. “Testing Genetic Algorithm as A Tool to Select Relevant Wavebands from Field Hyperspectral Data for Estimating Pasture Mass and Quality in A Mixed Sown Pasture Using Partial Least Squares Regression.” Grassland Science 56 (4): 205–216. doi:10.1111/j.1744-697X.2010.00196.x.
- Kwok, R., S. V. Nghiem, S. H. Yueh, and D. D. Huynh. 1995. “Retrieval of Thin Ice Thickness from Multifrequency Polarimetric Sar Data.” Remote Sensing of Environment 51 (3): 361–374. doi:10.1016/0034-4257(94)00017-h.
- Leardi, R., R. Boggia, and M. Terrile. 1992. “Genetic Algorithms as a Strategy for Feature Selection.” Journal of Chemometrics 6 (5): 267–281. doi:10.1002/cem.1180060506.
- Leardi, R., and A. L. Gonzalez. 1998. “Genetic Algorithms Applied to Feature Selection in PLS Regression: How and When to Use Them.” Chemometrics and Intelligent Laboratory Systems 41 (2): 195–207. doi:10.1016/S0169-7439(98)00051-3.
- Li, Z., H. D. Guo, and J. C. Shi. 2001. “Retrieving Dry Snow Density with SIR-C Polarimetric SAR Data.” Chinese Science Bulletin 46 (14): 1211–1214. doi:10.1007/bf02900605.
- Li, B. G., L. C. Ma, P. A. Jiang, Z. Q. Duan, D. F. Sun, H. L. Qiu, J. P. Zhong, and H. Q. Wu. 2008. “High Precision Topographic Data on Lop Nor Basin's Lake ‘Great Ear’ and the Timing of Its Becoming a Dry Salt Lake.” Chinese Science Bulletin 53 (6): 905–914. doi:10.1007/s11434-008-0003-4.
- Li, L., S. L. Ustin, and D. Riano. 2007. “Retrieval of Fresh Leaf Fuel Moisture Content Using Genetic Algorithm Partial Least Squares (GA-PLS) Modeling.” Ieee Geoscience and Remote Sensing Letters 4 (2): 216–220. doi:10.1109/lgrs.2006.888847.
- Lindgren, F., P. Geladi, and S. Wold. 1993. “The Kernel Algorithm for PLS.” Journal of Chemometrics 7 (1): 45–59. doi:10.1002/cem.1180070104.
- Lucasius, C. B., M. L. M. Beckers, and G. Kateman. 1994. “Genetic Algorithms in Wavelength Selection: A Comparative Study.” Analytica Chimica Acta 286 (2): 135–153. doi:10.1016/0003-2670(94)80155-X.
- Ma, L. C., B. G. Li, P. A. Jiang, J. D. Sheng, J. P. Zhong, H. L. Qiu, and H. Q. Wu. 2011. “Sedimentary Features’ Origin and Paleoenvironmental Significance of ‘Great Ear’ Salt Pans in the Lop Nor Playa.” Acta Sedimentologica Sinica 29 (1): 125–133. doi:10.14027/j.cnki.cjxb.2011.01.009. [In Chinese].
- Saradjian, M. R., and M. Hosseini. 2011. “Soil Moisture Estimation by Using Multipolarization SAR Image.” Advances in Space Research 48 (2): 278–286. doi:10.1016/j.asr.2011.03.029.
- Shao, Y., H. Z. Gong, Z. H. Gao, L. Liu, L. Li, and T. T. Zhang. 2012. “SAR Data for Subsurface Saline Lacustrine Deposits Detection and Primary Interpretation on the Evolution of the Vanished Lop Nur Lake.” Canadian Journal of Remote Sensing 38 (3): 267–280. doi:10.5589/m12-019.
- Song, K. S., L. Li, S. Li, L. Tedesco, B. Hall, and L. H. Li. 2012a. “Hyperspectral Remote Sensing of Total Phosphorus (TP) in Three Central Indiana Water Supply Reservoirs.” Water Air and Soil Pollution 223 (4): 1481–1502. doi:10.1007/s11270-011-0959-6.
- Song, K. S., L. Li, S. Li, L. Tedesco, B. Hall, and Z. C. Li. 2012b. “Hyperspectral Retrieval of Phycocyanin in Potable Water Sources Using Genetic Algorithm-Partial Least Squares (GA-PLS) Modeling.” International Journal of Applied Earth Observation and Geoinformation 18: 368–385. doi:10.1016/j.jag.2012.03.013.
- Thomas, E. V. 1994. “A Primer on Multivariate Calibration.” Analytical Chemistry 66 (15): 795A–804A. doi:10.1021/ac00087a722.
- Thomas, E. V., and D. M. Haaland. 1990. “Comparison of Multivariate Calibration Methods for Quantitative Spectral Analysis.” Analytical Chemistry 62 (10): 1091–1099. doi:10.1021/ac00209a024.
- Wang, L. F., H. Z. Gong, and Y. Shao. 2014. “Precise Topography Assessment of Lop Nur Lake Basin Using GLAS Altimeter.” Paper presented at the 35th International Symposium on Remote Sensing of Environment (ISRSE35), Beijing, April 22–26.
- Wang, L. F., H. Z. Gong, Y. Shao, and B. G. Li. 2014. “Analysis of Elevation Discrepancies Along the Lop Nur Ear-shaped Stripes Observed Using GLAS and DGPS Data.” International Journal of Remote Sensing 35 (4): 1466–1480. doi:10.1080/01431161.2013.878060.
- Xia, X. C., G. J. Mu, and J. Q. Lei. 2002. “Some New Progress in Scientific Research on the Lop Nur Lake Region, Xinjiang, China.” Science in China Series D-Earth Sciences 45: 148–156. doi:10.1007/bf02878402.
- Xia, X. C., F. B. Wang, and Y. J. Zhao. 2007. Lop Nor in China. Beijing: Science Press. [In Chinese].
- Zhang, T. T., Y. Shao, H. Z. Gong, L. Li, and L. F. Wang. 2014. “Salt Content Distribution and Paleoclimatic Significance of the Lop Nur ‘Ear’ Feature: Results from Analysis of EO-1 Hyperion Imagery.” Remote Sensing 6 (8): 7783–7799. doi:10.3390/rs6087783.
- Zhao, Y. J., X. C. Xia, F. B. Wang, Q. Y. Cao, W. M. Gao, and G. Y. You. 2006. “Features and Causes of Formation on Ring Shaped Salt Crust in Lop Nur Region of Xinjiang, China.” Arid Land Geography 29 (6): 779–783. doi:10.13826/j.cnki.cn65-1103/x.2006.06.002. [In Chinese].