
ABSTRACT
Land surface water mapping is one of the most important remote-sensing applications. However, water areas are spectrally similar and overlapped with shadow, making accurate water extraction from remote-sensing images still a challenging problem. This paper develops a novel water index named as NDWI-MSI, combining a new normalized difference water index (NDWI) and a recently developed morphological shadow index (MSI), to delineate water bodies from eight-band WorldView-2 imagery. The newly available bands (e.g. coastal, yellow, red-edge, and near-infrared 2) of WorldView-2 imagery provide more potential for constructing new NDWIs derived from various band combinations. Through our testing, a new NDWI is defined in this study. In addition, MSI, a recently developed automatic shadow extraction index from high-resolution imagery can be used to indicate shadow areas. The NDWI-MSI is created by combining NDWI and MSI, which is able to highlight water bodies and simultaneously suppress shadow areas. In experiments, it is shown that the new water index can achieve better performance than traditional NDWI, and even supervised classifiers, for example, maximum likelihood classifier, and support vector machine.
1. Introduction
Surface water is among the most active and natural earth resources and its changes in time and space have a profound impact on natural systems and human societies (Famiglietti and Rodell Citation2013). However, water resources are undergoing great changes as a consequence of climate changes and human activities. Therefore, the accurate retrieval and monitoring of surface water is thus crucial for environmental research as well as for the management of terrestrial ecosystems. Mapping accurately surface water (Carroll et al. Citation2009; Feng et al. Citation2015; Liao et al. Citation2014) and monitoring timely its dynamic changes are topics of academic study in a wide range of scientific fields (Craglia et al. Citation2012).
Remote sensing, as a timely and rapid Earth Observation technique, has become an essential source of information in surface water and other environmental research. Delineation of water areas is one of the most important applications of remote sensing, which is significant to water resource management, flood disaster assessment, and wetland monitoring. Various methods have been developed to delineate surface water from optical remote-sensing images, which can be divided into four common categories (Feyisa et al. Citation2014; Ji, Zhang, and Wylie Citation2009): (a) single-band thresholding (Bryant and Rainey Citation2002; Jain et al. Citation2005), (b) multi-band spectral index (Feyisa et al. Citation2014; McFeeters Citation1996; Xu Citation2006), (c) thematic classification (Li and Narayanan Citation2003; Lira Citation2006), and (d) linear unmixing (Rogers and Kearney Citation2004). Moreover, investigators have made efforts to improve the accuracy of water extraction by incorporating these different types of methods (Jiang et al. Citation2014; Sun et al. Citation2012). In general, the single-band thresholding method and spectral water index are commonly used for delineating water features due to these methods can be calculated simply and conveniently (Ryu, Won, and Min Citation2002).
The spectral water index is designed to highlight water features and suppress non-water information, and thus can separate water from non-water by selecting an appropriate threshold value. A simple two-band ratio method has been commonly used for water extraction from remote-sensing images, such as normalized difference water index (NDWI) (McFeeters Citation1996), which utilizes the normalized ratio of green and near-infrared (NIR) bands to delineate water features. To suppress the noise from built-up areas, Xu (Citation2006) introduced another water index named modified NDWI (MNDWI) by replacing NIR band with shortwave-infrared (SWIR) band on the basis of NDWI. However, the selection of an optimal threshold value for the two-band water indexes is a time-consuming task. Therefore, a multi-band water index named automated water extraction index (AWEI) is introduced to provide robust water extraction accuracies with stable threshold values under various environmental conditions (Feyisa et al. Citation2014).
In recent years, availability of high-spatial resolution satellite images makes it possible to accurately extract water areas. However, most of the high-spatial resolution remotely sensed images have only four bands (blue, green, red, and NIR), and the SWIR channel used to compute MNDWI or AWEI is not provided. In this context, WorldView-2, a new eight-band high-resolution sensor, is able to provide additional spectral channels (e.g. coastal, yellow, red-edge, and NIR2), where in particular the coastal band is sensitive to water areas (Puetz, Lee, and Olsen Citation2009) and has the potential for water research and bathymetric studies. Consequently, the four new bands are able to provide more potential to construct more effective water indexes compared to the traditional ones (Wolf Citation2012). In addition, image classification method is also used to extract water area from high-resolution remote-sensing images. An iterative method by constructing adaptive segmented buffers was developed to delineate water body from urban high-resolution imagery (Zhou et al. Citation2012). An object-based rule set method combining spectral, geometric, and textural features was employed to extract water body from WorldView-2 imagery and achieved satisfactory water extraction results (Chen et al. Citation2013). However, the selection of an appropriate parameter for image segmentation is a time-consuming task, which has an important impact on the object-oriented water extraction result.
More importantly, although progresses have been achieved for water extraction, the confusion between shadow and water, due to their similar spectral reflectance, is a pending problem for both high-resolution images (Nath and Deb Citation2010; Luo et al. Citation2010; Zhou et al. Citation2012) and moderate- and low-resolution images (Feyisa et al. Citation2014; Jiang et al. Citation2014; Li, Zhang, and Shen Citation2013). To our knowledge, there is no existing water index proposed for high-resolution remote-sensing data, which can extract water information and at the same time suppress the false alarm of shadow. Thus, the objective of this paper is to develop a novel water index for WorldView-2 imagery by integrating the optimized NDWI model by using the morphological shadow index (MSI; Huang and Zhang Citation2012), which is able to eliminate the shadow information.
The contributions of this study lie in two aspects: (1) to test the performances of different NDWI models constructed by all possible combinations of WorldView-2 bands, and (2) to create a new water index (NDWI-MSI) for WorldView-2 imagery, based on the optimized NDWI model and shadow removal.
2. Study areas and data
The study areas are located in the three typical mega cities (i.e. Shenzhen, Hangzhou, and Wuhan) of China (). The cities have abundant water resources including rivers, lakes, reservoirs, and ponds. The urban areas consist of complex urban features such as built-up areas, vegetation, bare land, and shadow, which are suitable and challenging to test the performance and robustness of the proposed water index.
Figure 1. (a) Location of the study areas in China; (b), (c), and (d) are WorldView-2 false color images (8, 3, and 2) overlaid with ground truth references covering Shenzhen, Hangzhou, and Wuhan, respectively.
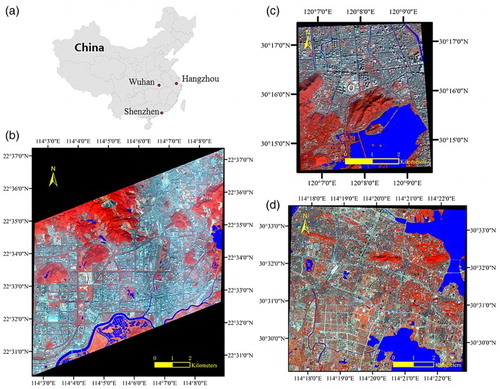
In this study, three WorldView-2 images over the urban areas were used for water extraction to test the robustness of the proposed method. The detailed parameters of the three images are provided in . shows the images as well as the corresponding ground truth references of the study areas. The ground truth maps were delineated manually based on careful visual interpretation and a field campaign.
Table 1. Parameters of the three WorldView-2 images.
3. Methodology
3.1. Water indexes
NDWI (McFeeters Citation1996) has been widely used to delineate water areas from remote-sensing images. NDWI is designed according to the difference of spectral response between green and NIR channels, considering the strong absorption of NIR by water features and the high reflectance of NIR by vegetation and soil features (Xu Citation2006). Therefore, NDWI is defined as the normalized ratio of the relatively high-reflective band () and the low-reflective band (
):
(1)
WorldView-2 imagery with eight spectral bands (especially newly added four bands) can provide a new perspective for constructing different NDWIs. To maximize the potential of the eight-band imagery, four bands (coastal, blue, green, and yellow) and three
bands (red-edge, NIR1, and NIR2), as well as their respective average values (avg1 (Equation (2)) and avg2 (Equation (3))), are selected to compute the possible two-band combinations of water indexes for the WorldView-2 image. Hence, 5 × 4 = 20 NDWI indexes as well as the sum of all NDWIs (NDWI_sum in Equation (4)) can be computed from the WorldView-2 images ().
(2)
(3)
(4)
Table 2. All possible water indexes for WorldView-2 imagery.
where indicates the
th NDWI and
is the number of water indexes.
3.2. Morphological Shadow Index
In this study, in order to efficiently suppress the false alarms of shadow areas, MSI (Huang and Zhang Citation2012), a recently developed automatic shadow detector for high-resolution imagery, is applied to enhance the traditional NDWI. MSI is constructed by describing the spectral-spatial properties of shadow using a series of morphological operations. The calculation of MSI is based on the fact that the relatively low spectral reflectance of shadows and the spatially adjacent buildings can lead to a high local contrast of shadows. The calculation steps of the MSI are briefly described as follows.
Step 1. Calculation of brightness: the brightness image b is generated by recording the largest value of each pixel in the available channels, since shadow is dark and has low response in all the spectral bands.
Step 2. Black top-hat by reconstruction (BTH): It is defined as:(5)
where is the closing-by-reconstruction filter,
and
indicate the length and direction of a linear structuring element (SE), respectively.
Step 3. Differential morphological profiles (DMPs):(6)
where DMPBTH can be viewed as a shape spectrum (Huang and Zhang Citation2012) used to highlight the dark structures in different scales (smin≤s ≤ smax) and directions. is the interval of the scales in the profiles.
Step 4. Calculation of the MSI:(7)
where D and S indicate the number of directions and scales for the profiles, respectively. MSI is defined as the mean of the DMPBTH profiles since shadow shows large BTH values in different scales and directions. Consequently, shadow areas correspond to large MSI feature values. Readers can refer to Huang and Zhang (Citation2012) for details about MSI.
The directions (D = 4) of the linear SE were set to 0°, 45°, 90°, and 135° in this paper since our previous study showed that increase of value of D does not signify improvement of shadow detection (Huang and Zhang Citation2012). The scale parameters (smin, smax, and
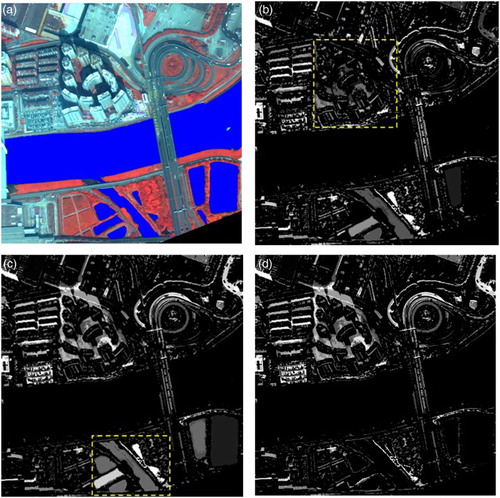
s) were set to (2, 52, and 5) according to the spatial resolution (2 m) of images. However, it is actually difficult to choose a suitable value of s for complex high-resolution urban scenes, since a low value is subject to omission of shadow (see the box in (b)) but a high value may lead to wrong extraction of small-area water bodies (see the box in (c)). Consequently, an appropriate strategy is to define a large value of smax and then refine the result using shape (e.g. density) and texture features (e.g. homogeneity) to eliminate these wrongly detected objects from the MSI feature image ((d)). It should be noted that homogeneity derived from the gray-level co-occurrence matrix is used to eliminate the small-area water bodies by manually setting the threshold value as .1 considering the texture of water is more homogeneous than shadow. The density feature is used to remove the elongated water bodies (e.g. rivers) using the threshold value of .7 since elongated structures are related to lower density value.
Figure 2. An example showing the results of MSI: (a) is an example image overlaid with reference, (b) and (c) are the MSI feature images, with the sizes of SE (smin, smax, and s) set as (2, 22, and 5) and (2, 52, and 5), respectively, and (d) is the refined result of (c).
3.3. The Proposed Water Index
We can find an optimized band combination for the NDWI defined in Equation (1), based on the eight-band WorldView-2 imagery. Subsequently, the residual shadow can be further suppressed by considering the shadow index introduced previously. As shown in , in this study, a new water index combining NDWI and MSI is proposed to accurately delineate water areas from WorldView-2 imagery. The calculation procedure of the proposed water index consists of the following three steps:
calculation of the optimized NDWI (NDWIoptimal), selected among all the possible band combinations of the eight-band WorldView-2 imagery;
refined MSI for shadow extraction;
calculation of the proposed water index for WorldView-2 (NDWIWV-2), by subtracting the shadow components (MSI) from the optimized NDWI:
(8)
Figure 3. Graphical example of the proposed method.
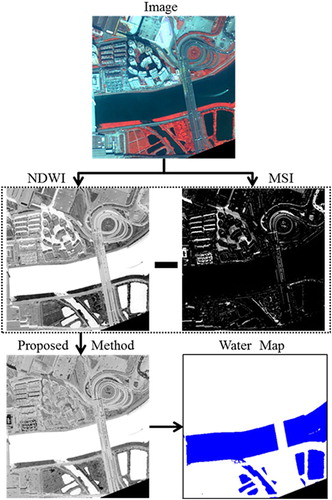
where the values of and MSI are linearly scaled to [0, 1].
3.4. Supervised classification methods
To compare the performance of the new index with classification methods, two supervised classifiers including maximum likelihood classifier (MLC) and support vector machine (SVM) were used for water extraction in this study. A brief description of the two classifiers is given as follows.
MLC is a parametric classifier which is commonly used for classification of remotely sensed images. The principle of MLC is based on the assumptions that the input data are Gaussian (normally) distributed, and the distance between a pixel value and a scaled and variance/covariance-corrected class mean is calculated to obtain the probability that the pixel belongs to one of possible classes (Strahler Citation1980). In contrast to other parametric classifiers, MLC has the advantage of dealing with normally distributed data.
SVM is one of the most popular machine learning algorithms for supervised classification, which is developed based on the statistical learning theory and structural risk minimization principle (Chapelle, Haffner, and Vapnik Citation1999). SVM has a high generation performance and can be applicable to process the high-dimensional data with small training sample set (Gotsis, Chamis, and Minnetyan Citation2004). SVM has been reported to achieve better performance than the traditional classification methods (Huang, Davis, and Townshend Citation2002). However, the choice of the kernel and its parameters has a significant impact on the output results of SVM. In this study, a grid-search technique using fivefold cross-validation is employed to find the optimal kernel function parameters for SVM.
4. Result analysis and validation
The experiments were conducted on the three WorldView-2 images covering Shenzhen, Hangzhou, and Wuhan, respectively. The producer’s accuracy (PA), user’s accuracy (UA), and Kappa coefficient calculated by confusion matrix were used to evaluate the accuracy of water extraction. The threshold values for water indexes were selected by the receiver operator characteristics curves (Nettleman Citation1988), which were drawn with the true positive rate (TPR) on the y axis and the false positive rate (FPR) along the x axis. TPR (also called sensitivity or recall) denotes the proportion of the actual water pixels which have been correctly retrieved, while FPR (also called false alarm rate) is the proportion of the actual non-water pixels that have been incorrectly classified as water (Fawcett Citation2006). The both TPR and FPR values are distributed in [0, 1], which can be defined as Equations (9) and (10), respectively. The goal of our experiments is to achieve the values of high TPR and low FPR. The optimal threshold value can be selected as the tangential point of the curve, indicating a trade-off of TPR and FPR.(9)
(10)
Accuracy scores of various NDWIs constructed by different band combinations for Shenzhen WorldView-2 imagery are shown in . It can be seen that the traditional NDWI (based on green and NIR1 bands, NDWIgreen-NIR1) gives the Kappa coefficient of .559. The Kappa value of the NDWI computed by coastal and NIR2 (NDWIcoastal-NIR2) is .669, which outperforms other NDWIs in terms of the accuracy. presents the accuracies of water extraction for Hangzhou WorldView-2 data, and it can be seen that the NDWIcoastal-NIR2 as well as the NDWI constructed by green and NIR2 (NDWIgreen-NIR2) achieved the highest values of Kappa in comparison with other NDWIs. The accuracy results of Wuhan WorldView-2 data are demonstrated in , where the NDWIgreen-NIR2 and NDWIcoastal-NIR2 obtained better accuracy performance than other NDWIs.
Table 3. Accuracy scores of various NDWIs for Shenzhen WorldView-2 data.
Table 4. Accuracy scores of various NDWIs for Hangzhou WorldView-2 data.
Table 5. Accuracy scores of various NDWIs for Wuhan WorldView-2 data.
Moreover, in order to further validate the results, we compare the false alarm rate (FPR) of different NDWIs when keeping the correctness rate (TPR) value equal to 90%. In this case, lower FPR values correspond to small false alarm and better performance. The results of the three study areas are shown in –, respectively. From the tables, a similar phenomenon can be observed that the NDWIcoastal-NIR2 and NDWIgreen-NIR2 achieved the best performance with the lowest FPR value. Especially for Shenzhen WorldView-2 data, the NDWIcoastal-NIR2 reduced the FPR by 4.5% compared to the NDWIgreen-NIR1. In addition, the average Kappa values and FPR values for each band were also calculated, and the NIR2 band surpassed other bands in terms of their highest accuracies and lowest FPR values, suggesting the NIR2 band plays an important role in the water extraction of WorldView-2 imagery. Consequently, the NDWIcoastal-NIR2 or NDWIgreen-NIR2 can be selected as the optimized NDWI (NDWIoptimal) for WorldView-2 imagery considering the both indexes have the potential for enhancing the separability of water and non-water pixels.
Table 6. FPR of various NDWIs when keeping the correctness rate (TPR) value equal to 90% for Shenzhen WorldView-2 data.
Table 7. FPR of various NDWIs when keeping the correctness rate (TPR) value equal to 90% for Hangzhou WorldView-2 data.
Table 8. FPR of various NDWIs when keeping the correctness rate (TPR) value equal to 90% for Wuhan WorldView-2 data.
Although the NDWIoptimal can achieve the highest water extraction accuracy among all the possible band combinations of WorldView-2 imagery, it fails to remove the false alarms caused by shadow areas due to their high similarity to water in the spectral reflectance. After integrating the shadow index in this study, quantitative accuracies of the experimental results are reported in –. For Shenzhen WorldView-2 data, compared to the NDWIoptimal, the NDWI-MSI increases the PA and UA by 26.2% and 8.5%, respectively, by courtesy of the MSI index. Moreover, the Kappa coefficient increases from .669 to .863, which indicates the proposed method is more effective for discrimination between water and background, especially by reducing the commission errors of shadow. This phenomenon can be supported by the accuracy results of Hangzhou and Wuhan WorldView-2 data ( and ), where the NDWI-MSI surpassed the optimal NDWI in terms of accuracies.
Table 9. The accuracies of water extraction for Shenzhen WorldView-2 data set.
Table 10. The accuracies of water extraction for Hangzhou WorldView-2 data set.
Table 11. The accuracies of water extraction for Wuhan WorldView-2 data set.
In order to further validate the proposed water index, some state-of-the-art supervised classification methods (e.g. MLC and SVM) were also carried out for the purpose of comparison. A grid-search technique using fivefold cross-validation was used to seek the optimal parameters of SVM with the RBF kernel. Specifically, 1000 water pixels and 1000 non-water pixels were randomly generated from the ground truth reference for training the two supervised classifiers, and the rest of samples were used for accuracy assessment. From the , it can be seen that the Kappa value of the proposed method surpassed MLC and SVM by .36 and .16, respectively. The accuracy results of Hangzhou and Wuhan ( and ) also show that the NDWI-MSI obtained better performance than the two classifiers. It should be kept in mind that MLC and SVM are performed on training samples but the proposed water index does not need sample collection.
Furthermore, the results of MLC and SVM were refined with the MSI feature (called MLC-MSI and SVM-MSI), in order to suppress the false alarms caused by the shadow areas. Accordingly, the MLC-MSI and SVM-MSI improved the water extraction accuracies compared to the original MLC and SVM. This results shows that the MSI-based shadow removal is also essential for the supervised water extraction. The NDWI-MSI achieved the comparable accuracies with SVM-MSI and MLC-MSI.
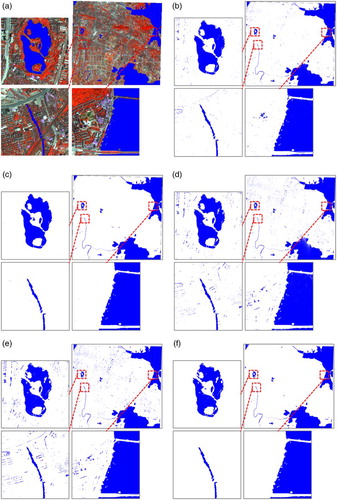
The extracted water maps of Shenzhen WorldView-2 data are displayed for a visual inspection in . In order to show the detailed information, three representative areas were selected for comparison. It can be seen that some water bodies are omitted in the NDWIoptimal (b). Most of the errors of MLC (d) and SVM (e) are related to the urban shadow. As observed in (c) and (f), the proposed method and SVM-MSI achieved the most satisfactory water body maps, due to the removal of shadow areas. The maps of water body extraction for Hangzhou and Wuhan ( and ) show similar conclusions to the results of the Shenzhen data. It can be found that the high water extraction accuracies achieved by the NDWI-MSI and SVM-MSI are consistent to the visual results ((c), (f) and (c), (f)), where the false alarms caused by shadow areas are less than other methods.
Figure 4. Results of water extraction for Shenzhen WorldView-2 data set: (a) false color image (8, 3, and 2) overlaid with ground truth reference; (b) NDWI; (c) proposed method; (d) MLC; (e) SVM; and (f) SVM-MSI.
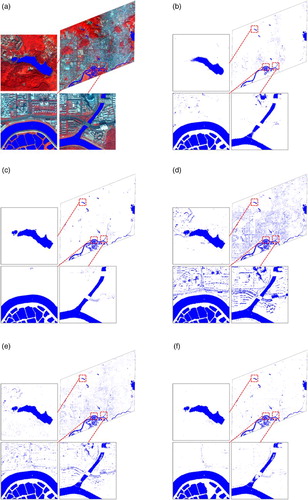
Figure 5. Results of water extraction for Hangzhou WorldView-2 data set: (a) false color image (8, 3, and 2) overlaid with ground truth reference; (b) NDWI; (c) proposed method; (d) MLC; (e) SVM; and (f) SVM-MSI.
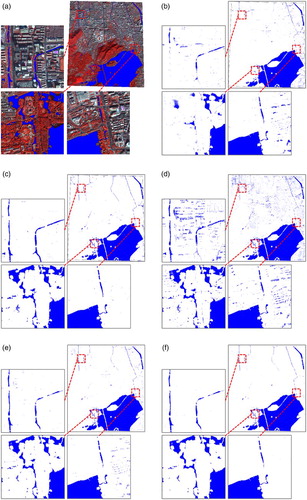
Figure 6. Results of water extraction for Wuhan WorldView-2 data set: (a) false color image (8, 3, and 2) overlaid with ground truth reference; (b) NDWI; (c) proposed method; (d) MLC; (e) SVM; and (f) SVM-MSI.
5. Discussions
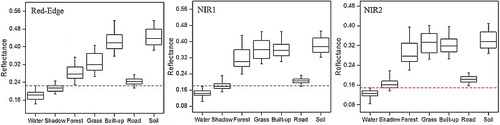
In the study, various NDWIs constructed by possible band combinations of eight-band WorldView-2 data were tested, and the optimal NDWI (NDWIcoastal-NIR2 or NDWIgreen-NIR2) was obtained according to the accuracy results of water extraction from the three test data. To further validate the reasonability of the results, the spectral response curves of various land cover classes in WorldView-2 imagery are presented in , where it can be seen that water absorbs strongly energy at NIR band and has a relatively high reflectance in coastal and green bands. Therefore, similar to the principle of the traditional water indexes (McFeeters Citation1996; Xu Citation2006), the NDWIoptimal can be calculated by the normalized ratio of the high-reflectance band (coastal or green) and the low-reflectance band to separate water pixels from non-water pixels. Moreover, the distributions of the reflectance values (red-edge, NIR1, and NIR2) in the land cover types are presented in the following box plots (). It can be found that the overlap between water and non-water (indicated by dotted lines) in the NIR2 band is smaller than that in the red-edge and NIR1 bands. In addition, the existing literature has reported that the coastal signature is the least absorbed by water in contrast to other bands (Anderson and Marchisio Citation2012), and it is expected to be useful for water research and bathymetric studies (Puetz, Lee, and Olsen Citation2009).
Figure 7. Spectral responses of various land cover classes in eight-band WorldView-2 imagery.
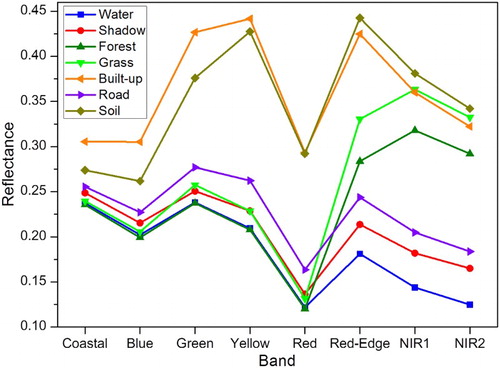
Figure 8. Reflectance distributions of various land cover classes. Each box plot shows the location of the 5th, 25th, 50th, 75th, and 95th percentiles using horizontal lines (boxes and whiskers).
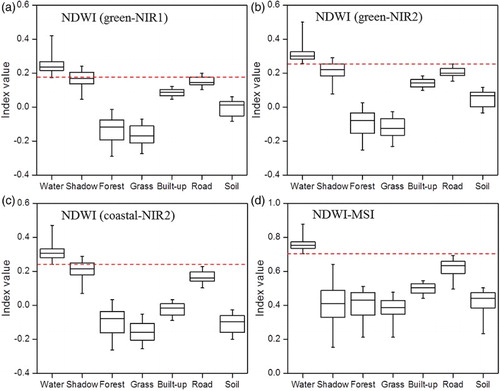
NDWIoptimal may still suffer from the effects of shadow noise despite its higher accuracies in comparison to other NDWIs. The index values of NDWIgreen-NIR1, NDWIgreen-NIR2, NDWIcoastal-NIR2, and NDWI-MSI in the major land cover types are presented in , respectively. As shown in the figure, there are overlaps in the three NDWIs values between water and shadow (a–c), which indicates the NDWIs cannot completely distinguish water from shadow pixels, especially for high-resolution imagery. Therefore, MSI is introduced to the new water index, in order to eliminate the false alarms caused by shadow (d).
Figure 9. Index distributions of major land cover types. Each box plot shows the location of the 5th, 25th, 50th, 75th, and 95th percentiles using horizontal lines (boxes and whiskers).
In addition, selection of an appropriate threshold value for the water index has an important impact on the water extraction results. The threshold values vary with the complicated environmental conditions and various imaging conditions. In urban high-spatial resolution imagery, the presence of shadow areas cast by buildings and trees is the primary noise source affecting the selection of threshold values. In this research, the MSI was introduced to suppress the effects of shadow, and NDWI-MSI was constructed to maximize the separability of water and non-water features. Therefore, a peak-valley method of histogram segmentation scheme (Julie et al. Citation2007) is used for threshold selection of the new index.
In the experiments, the three WorldView-2 images with various urban environments and surface water conditions were used to test the new water index, and satisfactory results of water extraction were achieved in all the cases. However, it should be noted that the influence of seasonal variations or biochemical property of water bodies on the reflectance response of surface water cannot be ignored, which may affect the performance of the new water index and accuracies of water extraction.
6. Conclusions
In this paper, we proposed a novel water index for high-resolution WorldView-2 imagery combining a new NDWI and MSI, which is able to delineate accurately water bodies and simultaneously suppress the false alarms caused by shadow areas. Firstly, in order to develop adequately the potential of the WorldView-2 bands, various NDWIs were computed by possible combinations of the eight-band data. The NDWI constructed by the normalized ratio of coastal-NIR2 or green-NIR2 bands outperformed other NDWIs in terms of the accuracies of water extraction. The commission errors of water extraction are mainly related to shadow areas due to their similar spectral characteristics. Thus, MSI was used to eliminate the noise caused by shadow. Three WorldView-2 data sets covering Shenzhen, Hangzhou, and Wuhan were used to validate the effectiveness of the proposed method. The experimental results revealed that the accuracy scores of the new index were higher than the original NDWI, and the NDWI-MSI was able to effectively reduce false alarms in terms of the visual inspection. Moreover, compared with the supervised machine learning algorithms (e.g. MLC and SVM), the NDWI-MSI achieved higher accuracy and also showed significant superiority. In general, the proposed water index is an effective water extraction method, which can be applicable as a routine tool for water body detection and monitoring for high-resolution images.
Disclosure statement
No potential conflict of interest was reported by the authors.
Additional information
Funding
References
- Anderson, Neal T., and Giovanni B. Marchisio. 2012. “WorldView-2 and the Evolution of the DigitalGlobe Remote Sensing Satellite Constellation: Introductory Paper for the Special Session on WorldView-2.” In Algorithms and Technologies for Multispectral, Hyperspectral, and Ultraspectral Imagery XVIII, 83900L. Proc. SPIE, edited by Sylvia S. Shen and Paul E. Lewis. Baltimore, MD: Spie Digital Library.
- Bryant, R. G., and M. P. Rainey. 2002. “Investigation of Flood Inundation on Playas Within the Zone of Chotts, Using a Time-series of AVHRR.” Remote Sensing of Environment 82 (Suppl. 2–3): 360–375. doi: 10.1016/S0034-4257(02)00053-6
- Carroll, M. L., J. R. Townshend, C. M. DiMiceli, P. Noojipady, and R. A. Sohlberg. 2009. “A New Global Raster Water Mask at 250 M Resolution.” International Journal of Digital Earth 2 (4): 291–308. doi: 10.1080/17538940902951401
- Chapelle, O., P. Haffner, and V. N. Vapnik. 1999. “Support Vector Machines for Histogram-based Image Classification.” IEEE Transactions on Neural Networks 10 (5): 1055–1064. doi: 10.1109/72.788646
- Chen, Chen, Jing Xin Chen, L. I. Xiang-Qian, Qin Zhang, and Shu Qian Zheng. 2013. “Study on Water Body Information Extraction from High Resolution Remote Sensing Image Based on Object-oriented Method.” Yellow River 35 (9): 68–70 + 73.
- Craglia, Max, Kees de Bie, Davina Jackson, Martino Pesaresi, Gábor Remetey-Fülöpp, Changlin Wang, Alessandro Annoni, Ling Bian, Fred Campbell, and Manfred Ehlers. 2012. “Digital Earth 2020: Towards the Vision for the Next Decade.” International Journal of Digital Earth 5 (1): 4–21. doi: 10.1080/17538947.2011.638500
- Famiglietti, James S., and Matthew Rodell. 2013. “Water in the Balance.” Science 340 (6138): 1300–1301. doi: 10.1126/science.1236460
- Fawcett, Tom. 2006. “An Introduction to ROC Analysis.” Pattern Recognition Letters 27 (8): 861–874. doi: 10.1016/j.patrec.2005.10.010
- Feng, Min, Joseph O. Sexton, Saurabh Channan, and John R. Townshend. 2015. “A Global, High-resolution (30-M) Inland Water Body Dataset for 2000: First Results of a Topographic–Spectral Classification Algorithm.” International Journal of Digital Earth 9 (2): 113–133. doi: 10.1080/17538947.2015.1026420
- Feyisa, Gudina L., Henrik Meilby, Rasmus Fensholt, and Simon R. Proud. 2014. “Automated Water Extraction Index: A New Technique for Surface Water Mapping Using Landsat Imagery.” Remote sensing of Environment 140 (1): 23–35. doi: 10.1016/j.rse.2013.08.029
- Gotsis, P. K., C. C. Chamis, and L. Minnetyan. 2004. “Classification of Hyperspectral Remote Sensing Images with Support Vector Machines.” IEEE Transactions on Geoscience and Remote Sensing 42 (8): 1778–1790. doi: 10.1109/TGRS.2004.831865
- Huang, C., L. S. Davis, and J. R. G. Townshend. 2002. “An Assessment of Support Vector Machines for Land Cover Classification.” International Journal of Remote Sensing 23 (4): 725–749. doi: 10.1080/01431160110040323
- Huang, Xin, and Liangpei Zhang. 2012. “Morphological Building/Shadow Index for Building Extraction from High-resolution Imagery over Urban Areas.” IEEE Journal of Selected Topics in Applied Earth Observations and Remote Sensing 5 (1): 161–172. doi: 10.1109/JSTARS.2011.2168195
- Jain, Sanjay K., R. D. Singh, M. K. Jain, and A. K. Lohani. 2005. “Delineation of Flood-prone Areas Using Remote Sensing Techniques.” Water Resources Management 19 (4): 333–347. doi: 10.1007/s11269-005-3281-5
- Ji, L., L. Zhang, and B. Wylie. 2009. “Analysis of Dynamic Thresholds for the Normalized Difference Water Index.” Photogrammetric Engineering & Remote Sensing 75 (11): 1307–1317. doi: 10.14358/PERS.75.11.1307
- Jiang, Hao, Min Feng, Yunqiang Zhu, Ning Lu, Jianxi Huang, and Tong Xiao. 2014. “An Automated Method for Extracting Rivers and Lakes from Landsat Imagery.” Remote Sensing 6 (6): 5067–5089. doi: 10.3390/rs6065067
- Julie, Delon, Desolneux Agnès, Lisani José-Luis, and Petro Ana Belén. 2007. “A Nonparametric Approach for Histogram Segmentation.” Image Processing IEEE Transactions on 16 (1): 253–261. doi: 10.1109/TIP.2006.884951
- Li, Jiang, and Ram M. Narayanan. 2003. “A Shape-based Approach to Change Detection of Lakes Using Time Series Remote Sensing Images.” IEEE Transactions on Geoscience and Remote Sensing 41 (11): 2466–2477. doi: 10.1109/TGRS.2003.817267
- Li, Changchun, Guangsheng Zhang, and Li Shen. 2013. “Water Body Extraction from Remote Sensing Image Based on AdaBoost Algorithm." Science of Surveying and Mapping 38 (2): 104–000.
- Liao, An Ping, Li Jun Chen, Jun Chen, H. E. Chaoying, Xin Cao, Jin Chen, Shu Peng, Fang Di Sun, and Peng Gong. 2014. “High-resolution Remote Sensing Mapping of Global Land Water.” Science China Earth Sciences 57 (10): 2305–2316. doi: 10.1007/s11430-014-4918-0
- Lira, Jorge. 2006. “Segmentation and Morphology of Open Water Bodies from Multispectral Images.” International Journal of Remote Sensing 27 (18): 4015–4038. doi: 10.1080/01431160600702384
- Luo, Jiancheng, Sheng Yongwei, Shen Zhanfeng, and Li Junli. 2010. “High-precise Water Extraction Based on Spectral-spatial Coupled Remote Sensing Information.” In 2010 IEEE International Geoscience and Remote Sensing Symposium (IGARSS), 2840–2843. http://ieeexplore.ieee.org/xpls/abs_all.jsp?arnumber=5648978&tag=1 doi: 10.1109/IGARSS.2010.5648978
- McFeeters, S. K. 1996. “The Use of the Normalized Difference Water Index (NDWI) in the Delineation of Open Water Features.” International Journal of Remote Sensing 17 (7): 1425–1432. doi: 10.1080/01431169608948714
- Nath, Rajiv Kumar, and S. K. Deb. 2010. “Water-Body Area Extraction from High Resolution Satellite Images-An Introduction, Review, and Comparison.” International Journal of Image Processing 3 (6): 353–372.
- Nettleman, M. D. 1988. “Receiver Operator Characteristic (ROC) Curves.” Infection Control & Hospital Epidemiology the Official Journal of the Society of Hospital Epidemiologists of America 9 (8): 374–377. doi: 10.2307/30145466
- Puetz, Angela M., Krista Lee, and R. Chris Olsen. 2009. “WorldView-2 Data Simulation and Analysis Results.” Proceedings of SPIE – The International Society for Optical Engineering, 73340U-U-9.
- Rogers, A. S., and M. S. Kearney. 2004. “Reducing Signature Variability in Unmixing Coastal Marsh Thematic Mapper Scenes Using Spectral Indices.” International Journal of Remote Sensing 25 (12): 2317–2335. doi: 10.1080/01431160310001618103
- Ryu, Joo Hyung, Joong Sun Won, and Kyung Duck Min. 2002. “Waterline Extraction from Landsat TM Data in a Tidal Flat – A Case Study in Gomso Bay, Korea.” Remote Sensing of Environment 83 (3): 442–456. doi: 10.1016/S0034-4257(02)00059-7
- Strahler, Alan H. 1980. “The Use of Prior Probabilities in Maximum Likelihood Classification of Remotely Sensed Data.” Remote Sensing of Environment 10 (2): 135–163. doi: 10.1016/0034-4257(80)90011-5
- Sun, Fangdi, Wanxiao Sun, Jin Chen, and Peng Gong. 2012. “Comparison and Improvement of Methods for Identifying Waterbodies in Remotely Sensed Imagery.” International Journal of Remote Sensing 33 (21): 6854–6875. doi: 10.1080/01431161.2012.692829
- Wolf, Antonio F. 2012. “Using WorldView-2 Vis-NIR Multispectral Imagery to Support Land Mapping and Feature Extraction Using Normalized Difference Index Ratios.” Society of Photo-Optical Instrumentation Engineers (SPIE) Conference Series, 8390.
- Xu, H. Q. 2006. “Modification of Normalised Difference Water Index (NDWI) to Enhance Open Water Features in Remotely Sensed Imagery.” International Journal of Remote Sensing 27 (14): 3025–3033. doi: 10.1080/01431160600589179
- Zhou, Yanan, Jiancheng Luo, Zhanfeng Shen, Xi Cheng, and Xiaodong Hu. 2012. “Adaptive Extraction of Water in Urban Areas Based on Local Iteration Using High-Resolution Multi-Spectral Image.” In 2012 IEEE International Geoscience and Remote Sensing Symposium (IGARSS) 53 (60): 6024–6027. doi: 10.1109/IGARSS.2012.6352234