
ABSTRACT
The false topographic perception phenomenon (FTPP) refers to the visual misperception in remote-sensing images that certain types of terrains are visually interpreted as other types in rugged lands, for example, valleys as ridges and troughs as peaks. For this reason, the FTPP can influence the visualization and interpretation of images to a great extent. To scrutinize this problem, the paper firstly reviews and tests the existing FTPP-correction techniques and identifies the inverse slope-matching technique as an effective approach to visually enhance remote-sensing images and retain the colour information. The paper then proposes an improved FTPP-correction procedure that incorporates other image-processing techniques (e.g. linear stretch, histogram matching, and flat-area replacement) to enhance the performance of this technique. A further evaluation of the proposed technique is conducted by applying the technique to various study areas and using different types of remote-sensing images. The result indicates the method is relatively robust and will be a significant extension to geovisual analytics in digital earth research.
1. Introduction
In remote-sensing images, topography can be visually misperceived because of the difference from the appearance on real-world surfaces. For example, because of the similarity in colour, shape, and contour, valleys may be visually identified as ridges and troughs may be mistakenly interpreted as peaks (Bernabé-Poveda and Çöltekin Citation2015; Coltekin, Pettit, and Wu Citation2015). This problem, referred to as the false topographic perception phenomenon (FTPP), exists universally in almost all kinds of sun-synchronous satellite remote-sensing images (e.g. Landsat, IRS, SPOT, NOAA series of satellites, TERRA MODIS, HJ-1A/1B, GF series of satellites). The FTPP is especially prominent in the high-latitude areas of the Northern Hemisphere (Patterson and Kelso Citation2004). The visual misperception caused by the FTPP can influence the visualization and interpretation of images to a great extent, eventually degrading the quality and accuracy of decision-making in regard to the visual presentation of remote-sensing products in cases of digital map navigation, regional planning, ecological zoning, and natural resource monitoring (Patterson and Kelso Citation2004).
The phenomenon of inverse topography in satellite imagery was firstly identified by Saraf et al. (Citation1996). Afterwards, a series of studies on the FTPP found that the effect could be induced by interrelated factors, such as topographic shade, sun elevation angle, sun azimuth angle, viewing angle, hatching or engraving features on the slopes, and physiology of human eyes (Kleffner and Ramachandran Citation1992; Norman, Todd, and Orban Citation2004; Ramachandran Citation1988; Saraf et al. Citation1996; Todd, Egan, and Phillips Citation2014; Toutin Citation1998). Among these factors, the geometric relationship between the viewing angle of the observer and the sun azimuth angle is the major contributor of the FTPP. When examining textured images of the Northern Hemisphere, human eyes are accustomed to perceiving the shape from shading resulted from the northwest sun-illumination. If the sunlight comes from the southeast, the observer will likely perceive inversed topography (Saraf et al. Citation1996, Citation2005). This phenomenon can be explained by the fact that in the high-latitude areas of Northern Hemisphere, morning sunlight comes from the southeast or south. Since almost all sun-synchronous satellites collect images during the morning hours, images oriented with the true north at the top will possibly be misinterpreted.
Several FTPP-correction techniques have been proposed since the 1990s. As the geometric relationship between the viewing angle of the observer and the sun azimuth angle is the major issue, existing techniques mainly focus on changing either the viewing angle or the sun-illumination direction to rectify the image, as given in . Changing the viewing angle is relatively easy, for example, by rotating the image by 180° with the north upside down (Saraf et al. Citation2005). Changing the sun-illumination direction is methodologically complex and can be further classified into two sub-categories: the indirect change method and the direct change method. The indirect change method is by swapping the shaded areas and the illuminated areas through inverting either the digital number (DN) values of the original pixels or the intensity component of the HSI (hue, saturation, and intensity) derived from the original red–green–blue (RGB) image (Saraf et al. Citation1996, Citation2007). The direct change method combines the original image with the shaded relief model (SRM) that incorporates the true topographic information. The direct change method can further involve two common methods: image fusion and topographic correction. The fundamental principle of image fusion is by applying the SRM to the original image, which is weighted by a coefficient or is processed by a low-pass filter. On the other hand, the topographic correction method aims to restore the natural colour intensity of the shaded pixels through various transformation algorithms based on the cosine values of the incident sun-illumination angle (where SRM is a typical application). Examples of the topographic correction method include the cosine correction (Teillet, Guindon, and Goodenough Citation1982) and its various extensions, such as the C-correction (Teillet, Guindon, and Goodenough Citation1982), the two-phase correction (Civco Citation1989), and the slope-matching correction (Nichol, Hang, and Sing Citation2006). These different FTPP-correction techniques are summarized as given in on the basis of existing reviews and comparative studies (Bernabé, Manso, and Ballari Citation2005; Zhu et al. Citation2015).
Table 1. Summary of existing FTPP-correction techniques.
The strengths as well as the weaknesses of various methods make it impossible to apply a universally accepted and robust correction approach to every case study. A pressing need is to choose and customize an existing FTPP-correction technique for a selected region as an effort to derive the best result. In addition, using a single method alone cannot possibly achieve the best performance as the corrected image could be compromised by the defect of the method. For example, the spatial precision of the digital elevation model (DEM) used in the direct change method will affect the FTPP-corrected image to a certain extent (Bernabé-Poveda, Sánchez-Ortega, and Çöltekin Citation2011; Bernabé, Manso, and Ballari Citation2005). This flaw cannot be remedied unless other image-processing techniques (e.g. image enhancement, topography replacement) are employed. Viewing this defect, this paper proposes an improved FTPP-correction procedure based on the slope-matching algorithm (Nichol, Hang, and Sing Citation2006). Compared with other correction techniques, this proposed procedure is capable of generating true topographic perception images with improved visualization and balanced colour intensity. This procedure is also considerably robust and applicable to various areas and to remote-sensing images acquired by multiple types of sensors. The paper not only elaborates on the operational process of the technique but also corroborates its effects and efficiency by comparing with other FTPP-correction methods. As evidenced by the visual and quantitative evaluations, the proposed procedure is suitable for restoring textured areas with dark shadows or steep terrains that pose considerable obstacles for correctly interpreting topographic objects.
2. Data and method
2.1. Data
To implement the new FTPP-correction technique, the study employs the Landsat 8 Operational Land Imager (OLI) data with the North Tianshan Mountains of China as the primary study area ( and ). In this area, the southwest is composed of relatively rugged terrains and the northeast, where Urumqi, capital of Xinjiang province is located, is generally flat lands. The original Landsat 8 OLI True Colour Composite (TCC) image () exhibits false topographic perception as evidenced by its corresponding DEM image (). For example, in the glaciers seem to fall in the valleys, while the Urumqi River seems to flow on the ridges.
Figure 1. Landsat 8 OLI True Colour Composite (TCC) (RGB: bands 4, 3, and 2) in the study area. This image is heavily influenced by the FTPP and has visually false topographic perception.
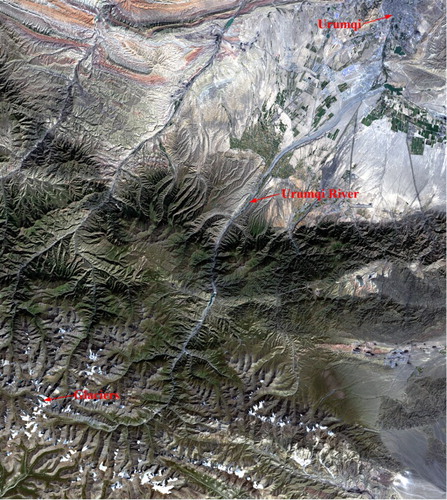
Figure 2. DEM data of the study area.
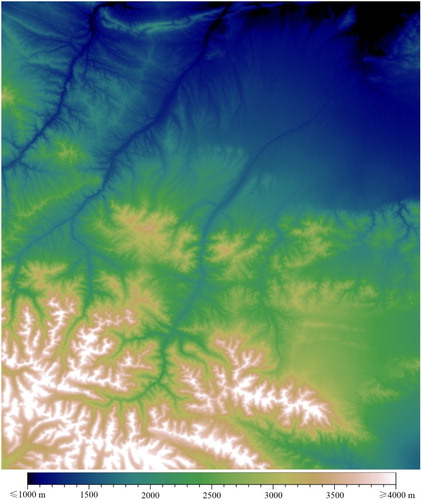
Table 2. Attributes of the Landsat 8 OLI data in the study.
The DEM data, derived from the ASTER (The Advanced Spaceborne Thermal Emission and Reflection Radiometer) GDEM (Global Digital Elevation Model) 2 dataset, were consolidated with the Landsat 8 OLI data to derive the true topographic perception image of the study area. The spatial resolution of the DEM data is one arc second. As stripe noise was observed in the DEM data, a median filter with a kernel window of 9 × 9 pixels was then employed to remove the noise. Since the Landsat data used for the study were pre-processed with the correct geometry, it was used as a reference to project and resample the DEM in order to retain the same projection, spatial resolution, and spatial extent. Both the Landsat data and the DEM data were acquired on the United States Geological Survey website.Footnote1
2.2. Method
2.2.1. FTPP correction
shows a general procedure of the proposed FTPP-correction method. The basic principle of this method is to first restore the colour information in the shaded areas through topographic correction and then to add opposite shadows to the image through an inverse topographic correction process. This process is also coupled with other imaging-processing techniques (e.g. replacement of flat areas) to enhance visualization of the image while preserving the majority of colour information.
Figure 3. Flowchart of the proposed FTPP-correction procedure.
The following content describes these steps in detail.
(1) Enhancement of the original image. The cutting linear stretch algorithm is used to enhance the original image. This algorithm usually sets the minimum pixel DN values to the 0–2nd percentiles and the maximum to the 98–100th percentiles. In this regard, the 2nd percentile and 98th percentile are adopted as the minimum and the maximum thresholds. Then the original 16-bit pixel DN values are linearly stretched to the range of 0–255 in 8-bit type to reduce the data size, as the visual difference between the original 16-bit Landsat 8 OLI image and its stretched 8-bit image is very minor.
(2) Generation of the true SRM image. The SRM image is derived from the effective cosine values of the incident sun-illumination angle, which is calculated by Formula (1) as(1) where i is the incident sun-illumination angle at the image time for a given pixel, cos is the cosine function,
is the sun elevation angle,
is the slope angle,
is the sun azimuth angle, and
is the slope azimuth angle. In this study,
is 148.237° and
is 51.763° at the image time.
and
are derived from the DEM data with a kernel size of 3 × 3 pixels.
(3) Topographic correction. Dark and deep shadows in rugged terrains have been frequently observed in remote-sensing images, and as a result, posing considerable obstacles for topographic corrections. The slope-matching technique is proposed to correct shaded areas due to its high efficiency in restoring the colour of steep terrains or low sun angles (Nichol, Hang, and Sing Citation2006). This technique is considered to be an extension of Civco’s two-stage normalization correction (Civco Citation1989; Nichol, Hang, and Sing Citation2006). Here this correction technique is employed as part of the procedure, as shown below.
The first stage is to normalize the image pixel DN values to the illumination level of pixels on the sunny slope using the illumination model, as described in Formula (2).(2) where
is the first-stage topography-corrected pixel DN value for band λ,
is the pixel DN value for band λ in the enhanced original image derived from step (1),
is the average pixel value of the true SRM image on the sunny slope (i.e. within a given angle range along sun azimuth angle at the image time), i is the original incident sun-illumination angle for a given pixel,
is the maximum value for band λ in the enhanced image, and
is the minimum value. The sunny slope normally covers an angle range of 45°. In this study, the sun azimuth angle at the image time is 148.237°. The sunny slope is then defined in the range of 148.237°–22.5° and 148.237° + 22.5°.
The correction coefficient is determined by Formula (3).(3) where
is the correction coefficient for band λ,
is the average pixel value of the topography-corrected image in the first stage for band λ on the sunny slope,
is the average pixel value of the topography-corrected image in the first stage for band λ on the shady slope, and
is the average pixel value of the enhanced original image for band λ on the shady slope. In this study, the shady slope is defined in the range of 148.237° + 180°–22.5° and 148.237° + 180° + 22.5°.Footnote2
In order to further improve the topographic effect, this process is then followed by the second-stage correction (Nichol, Hang, and Sing Citation2006), as formulated below:(4) where
is the second-stage topography-corrected pixel DN value for band λ. Other notations of the formula follow Formulas (2) and (3).
(4) Inverse topographic correction. A virtual SRM image is firstly generated from a vertically exaggerated slope angle image with an opposite sun azimuth angle at the image time (i.e. adding the sun azimuth angle by 180°) using Formula (1). An inverse topographic correction is then implemented on the shade-free image (the topography-corrected image) based on the virtual SRM image through a reverse processing of the slope-matching technique, as given in Formula (5).(5) where
is the inverse topography-corrected pixel DN value for band λ,
is the average pixel value of the virtual SRM image on the shady slope, and
is the opposite sun-illumination angle at the image time for a given pixel. Other notations of the formula follow Formula (4). To generate a vertically exaggerated slope angle image, the DEM data are weighted by a scale coefficient equal to or greater than one. After trial and error from 1 to 10, the scale coefficient is set to 5 to achieve the best visual effect.
(5) Histogram matching. In order to acquire a balanced colour, the pixel DN values of the FTPP-corrected image must be adjusted with respect to the histogram of the original image. The adjustment is processed as follows: first, the linear stretch algorithm is used to stretch the pixel DN values to the range of 0–255 in byte type; second, the pixel DN values of the FTPP-corrected image are adjusted by matching the histogram of the enhanced original image.
(6) Replacement of flat areas. Since flat areas are not affected by the FTPP, these areas should be retained to best preserve the colour information. In this study, pixels with slope angle less than 5° are considered flat areas. The DN values of these pixels are replaced by those in the enhanced original image.
(7) Enhancement of the FTPP-corrected image. Since the pixel DN values in the FTPP-corrected image have a wide range, the cutting linear stretch algorithm is again used to stretch the pixel DN values to the range of 0–255 in byte type. The minimum and the maximum cutting values are also set to the 2nd percentile and the 98th percentile, respectively.
2.2.2. Evaluations
One of the widely used approaches in evaluating the effect of computer visualization is the perceptual testing, known as employing volunteers to visually compare and check the quality of the improvement (Tory and Moller Citation2004). In this study, 50 individuals have been randomly selected and surveyed using perceptual testing questionnaire (as given in Supplementary Information S4). These volunteers have been instructed to compare the images before and after the FTPP correction, and rate the visual effects (i.e. colour and true topographic perception) based on a scale of 1 to 5, where 1 stands for the poorest effect and 5 stands for the best effect.
In addition to the perceptual testing, two quantitative evaluation methods are employed to measure the colour restoration/distortion of the proposed method. The first method is based on the correlation coefficient between the FTPP-corrected image and the virtual SRM image (CCFC-SRM). This correlation coefficient measures the degree of restoring true topographic information (i.e. a larger coefficient indicates a better effect). The second method is based on the comparison of the red, green and blue (RGB) bands of the image before and after the FTPP correction. This comparison is composed of three steps. First, the correlation coefficient of the RGB of the FTPP-corrected image (CCFCbands) is examined to identify the level of colour distortion, where a low correlation coefficient indicates a high degree of distortion resulted from the high correlation among red band, green band and blue band in remote-sensing image. However, as a high correlation coefficient does not necessarily mean less distortion, the second and the third steps become necessary. Second, the correlation coefficient (CCoriginal-FC) and the slope of the simple liner regression (Slopeoriginal-FC) between each band of the RGB image before and after the FTPP correction are used to measure the degree of colour restoration in flat areas (slope < 5°). When the value of two variables is closer to 1, it indicates similarity of the colour before and after the adjustment. Third, Levene’s test is employed to measure distribution between each band of the RGB image before and after the FTPP correction for non-flat areas (slope ≥5°), where a larger F-value indicates a greater degree of distortion.
3. Results
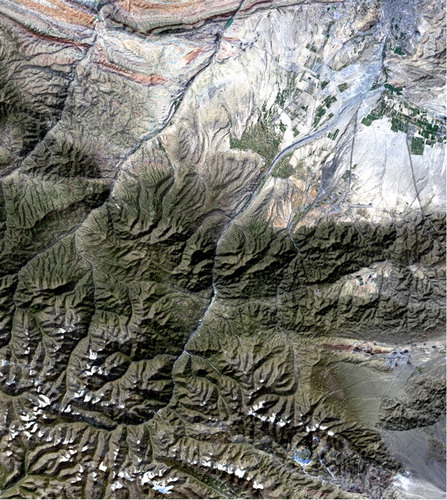
By applying the proposed FTPP-correction method to the study area, the result is derived as shown in . Compared with the original image in , the true topographic perception is restored with a significantly improved visual effect. For example, after the correction, the glaciers in the southwest are perceived to be situated on the ridges and the rivers are correctly placed in the valleys. Furthermore, the FTPP-corrected image holds balanced colour intensity and colour hue similar to the original image. Comparing with other FTPP-correction methods (given in Supplementary information S1), the result derived from the new FTPP-correction procedure shows a more improved visual effect.
Figure 4. FTPP-corrected image with the proposed inverse slope-matching technique.
shows the demographics of the 50 participants and their interpretation of the visual effects from the perceptual testing. Of the 11 participants who knew remote-sensing concepts, only two could correctly identify the true topography for without additional information. This result indicates that the FTTP could pose a significant obstacle to interpret remote-sensing images even for professionals in the field. Following the initial perception, the visual effect scoring confirms the significance of the proposed inverse slope-matching correction method, which received the highest score of the four FTPP methods. Following this method are the inverse cosine correction method (Zhang, Yuan, and Xu Citation2010), replacing the HSI intensity (Ramachandran Citation1988), and inverting the HSI intensity (Saraf et al. Citation2007).
Table 3. Statistics of the perceptual testing on different FTPP-correction techniques.
and show the results of the quantitative evaluations. As shown in , the positive CCFC-SRM values indicate that all of the four FTPP-correction methods are able to restore the true topographic perception to a significant degree. Replacing the HSI intensity has the best result, followed by the inverse slope-matching method. Comparatively, the other two techniques show unsatisfactory effects for restoring true topographic perception. A further analysis based on the colour information in shows interesting findings. First, comparing to the traditional method of changing the viewing angle by 180° (Saraf et al. Citation1996), the FTPP-correction methods generally yields relatively high CCFCbands. The only exception is the smaller CCFCbands in the technique of replacing HSI intensity, indicating the serious distortion of colour information. The small absolute value of the CCFCbands for flat areas and the large F-value of Levene’s test for non-flat areas also corroborate the conclusion. Second, both the CCoriginal-FC and Slopeoriginal-FC of the inversion of the HSI intensity technique are the closest to negative one for flat areas, which is an indication of a reversed colour. The largest F-value for non-flat areas reveals serious colour distortion. Third, for the inverse cosine correction technique and the inverse slope-matching technique, CCFC-SRM, CCoriginal-FC, and Slopeoriginal-FC are all close to one, indicating the capability of retaining the majority of colour information. Although the lowest F-value from the inverse cosine correction technique indicates high colour fidelity, the poor effect of restoring true topographic perception makes the technique less applicable. Results from the quantitative evaluations are similar to those from the perceptual testing, providing evidence that the inverse slope-matching technique is the best to achieve visual effect as well as maintain quality colour information. Therefore, the inverse slope-matching technique is the recommended processing method for enhancing remote-sensing images with visually corrected effect in the study area.
Table 4. Quantitative evaluations based on true topographic perception.
Table 5. Quantitative evaluations based on the colour information.
In order to examine whether the proposed method is methodologically robust when applying to other geographical regions and to other types of remote-sensing images, three Landsat 8 OLI images, one IRS-P6 AWIFS image, and one HJ-1A image in different study areas have been further tested (Supplementary Information S2). All these images contain rugged terrains and are visually influenced by severe FTPP. After applying the new FTPP-correction technique, the visualization of these images has been significantly improved with the true topographic perception and a balanced colour, corroborating the capability of the method being applied to other world regions.
4. Discussion
4.1. Mediating factors
Although the method is able to generate satisfactory visual effect and is applicable to a variety of remote-sensing images and geographical regions, three mediating factors should be specifically considered when implementing the new FTPP-correction technique.
First, the spatial precision of the DEM data must be guaranteed before the implementation. If the DEM does not precisely overlap with the original image in the X and Y directions, the result will suffer from the effect of double images. Therefore, the DEM image should be rigorously georeferenced before the implementation of the method. In addition, the errors in elevation (i.e. the Z direction of the DEM data) will likely generate some false valleys and ridges in areas where the real-world surfaces are perceived as flat, such as water bodies. This misperceived rugged effect can be partially removed by replacing flat areas only if the difference in elevation is trivial; in other words, it is considerably difficult to correct the effect when the elevation error is significant.
Second, a scale coefficient is applied to measure the degree of topographic exaggeration in processing the virtual SRM image, and this coefficient should be carefully examined. The criterion of whether the exaggeration is applied depends on the shaded features in the original remote-sensing image. For examples, dark and deep shadows may not be effectively corrected if the scale coefficient is not applied (Figure S3.1 in Supplementary Information S3), while the microtopography may be overstated if the scale coefficient is too large. The optimal value of the scale coefficient cannot be derived by a universal rule and can only be determined through trial and error on a case-by-case basis. In the paper, the implementation in the study area shows when the scale coefficient is around 5, the FTTP could be effectively corrected without exaggerating the microtopography.
Third, it is of critical importance to replace the flat areas as an effort to eliminate the false rugged phenomenon resulted from the elevation error. However, how flat areas are determined is subject to the threshold of slope angle. Deriving this threshold relies on rigorous analysis and careful scrutiny of the geographical features in the study area. For example, a small threshold may lead to few flat areas to be selected and replaced (Figure S3.2 in Supplementary Information S3), while a large threshold may result in excessive replacement of true ridges and valleys. Based on several rounds of observation and testing, an optimal threshold is usually set to 5–10°. To further justify the threshold, it is recommended to employ the method of the histogram matching between the original image and the FTPP-corrected image. This additional matching step will help us to eliminate the discrepancy in colours between the flat areas and their neighbouring pixels. Since the colour information in the original image is partially distorted when applying the FTPP correction, the histogram matching is able to alleviate the visual flaw of the colour replacement.
4.2. Limitations and recommendations
The slope-matching technique (Nichol, Hang, and Sing Citation2006) adopted in this proposed FTPP-correction procedure is a mechanistic model for topographic correction. This technique is based on the relationship between the SRM and the natural colour of objects on the Lambertian surface. This method can be applied to various geographical regions and to images acquired by multiple types of sensors. However, the effect of correction is strongly dependent on the parameters used for adjustments, such as the exaggeration scale coefficient and the flat-surface slope threshold. In this study, we used the trial-and-error method to manually determine these values as a compromised solution. Automating the generation of these values based on statistical data is expected to improve the efficiency and scientific rigour of the method in the future.
Although the proposed method can restore the true colour of the image to a certain extent, the distortion of colour information makes it not applicable for automating information extraction in further analyses (e.g. image classification based on the colour difference). Therefore, the proposed method is only useful in certain applications when restoring the colour hue and retrieving geographical features (e.g. shadows, textures) are mostly needed, such as differentiating land use and identifying man-made infrastructure from a blended background. In these cases, the FTPP-corrected images can assist map users, urban planners, and stakeholders to make a clear judgment on the real-world ground objects, eventually contributing to geovisual analytics and digital earth research.
5. Conclusions
The FTPP exists universally in almost all kinds of sun-synchronous satellite remote-sensing images containing rugged terrains. After comprehensively reviewing and testing the existing FTPP-correction techniques, the paper identifies the inverse slope-matching technique as a promising method capable of enhancing remote-sensing images with correct topographic visualization while retaining the majority of colour information. Based on this technique, the paper proposes an improved FTPP-correction procedure, which is coupled with other image-processing techniques, including the linear stretch, histogram matching, and flat-area replacement. The proposed technique is then tested by applying to various geographical regions as well as images acquired by multiple types of sensors. Although there are certain limitations in the procedure as certain model parameters need to be manually adjusted, improving the algorithm to automatically derive these parameters will be a fruitful direction to improve the efficiency of actual implementation.
To conclude, remote-sensing images contain complex information about the land surface. With the rapid development of geospatial technology and the progress of data use policies, more and more images become open access to the public. As the applications of remote-sensing data are not only limited to the professionals, the proposed FTPP-correction technique can help general users to visually interpret remote-sensing images in fields such as digital map navigation, regional planning, ecological zoning, natural resource monitoring, geological disaster monitoring, and geological prospecting.
Supplemental_Information_S4.docx
Download MS Word (11.9 MB)Supplemental_Information_S3.docx
Download MS Word (8.9 MB)Supplemental_Information_S2.docx
Download MS Word (8.9 MB)Supplemental_Information_S1.docx
Download MS Word (19.1 MB)Acknowledgement
Special thanks to the United States Geological Survey for providing the Landsat 8 OLI and ASTER GDEM 2 data through the EarthExplorer website (http://earthexplorer.usgs.gov/, accessed July 7, 2015). The authors also thank the Center for Earth Observation and Digital Earth, Chinese Academy of Sciences for providing the IRS-P6 AWIFS data (http://www.ceode.cas.cn/new/, accessed July 7, 2015) and China Centre for Resources Satellite Data and Application for providing the HJ1A CDD1 data (http://www.cresda.com/n16/index.html, accessed July 7, 2015).
Disclosure statement
No potential conflict of interest was reported by the authors.
Additional information
Funding
Notes
1 http://earthexplorer.usgs.gov/, accessed February 3, 2016.
2 148.237° + 180° means the opposite sun azimuth angle.
Related Research Data
References
- Bernabé, M., M. Manso, and D. Ballari. 2005. Correction of Relief Inversion in Images Served by a Web Map Server. Paper presented at the Proceedings of the XXII, International Cartographic Conference (ICC), A Coruña, Spain.
- Bernabé-Poveda, M., and A. Çöltekin. 2015. “Prevalence of the Terrain Reversal Effect in Satellite Imagery.” International Journal of Digital Earth 8 (8): 640–655. doi:10.1080/17538947.2014.942714.
- Bernabé-Poveda, M. A., I. Sánchez-Ortega, and A. Çöltekin. 2011. “Techniques for Highlighting Relief on Orthoimaginery.” Procedia – Social and Behavioral Sciences 21: 346–352.
- Chen, J., C. He, and C. Yue. 2011. “False Topographic Perception Phenomenon and Its Correction Based on Inverse DEM and HSV Transformation.” Journal of Northeast Forestry University 39 (3): 125–126. doi:10.13759/j.cnki.dlxb.2011.03.013.
- Civco, D. L. 1989. “Topographic Normalization of Landsat Thematic Mapper Digital Imagery.” Photogrammetric Engineering and Remote Sensing 55 (9): 1303–1309.
- Coltekin, A., C. Pettit, and B. Wu. 2015. “Geovisual Analytics: Human Factors.” International Journal of Digital Earth 8 (8): 595–598. doi:10.1080/17538947.2015.1047173.
- Gu, D., and A. Gillespie. 1998. “Topographic Normalization of Landsat TM Images of Forest Based on Subpixel Sun–canopy–sensor Geometry.” Remote Sensing of Environment 64 (2): 166–175. doi:10.1016/S0034-4257(97)00177-6.
- He, C., J. Chen, and C. Yue. 2014. “Comparison Test and Research Progress of Normalization Topographic Correction Model.” Forest Inventory and Planning 39 (3): 12–16+34. doi:10.3969/j.issn.1671-3168.2014.03.003.
- Kleffner, D. A., and V. S. Ramachandran. 1992. “On the Perception of Shape from Shading.” Perception & Psychophysics 52 (1): 18–36. doi:10.3758/BF03206757.
- Nichol, J., L. K. Hang, and W. M. Sing. 2006. “Empirical Correction of Low Sun Angle Images in Steeply Sloping Terrain: A Slope-matching Technique.” International Journal of Remote Sensing 27 (3): 629–635. doi:10.1080/02781070500293414.
- Norman, J. F., J. T. Todd, and G. A. Orban. 2004. “Perception of Three-dimensional Shape from Specular Highlights, Deformations of Shading, and Other Types of Visual Information.” Psychological Science 15 (8): 565–570. doi:10.1111/j.0956-7976.2004.00720.x.
- Patterson, T., and N. V. Kelso. 2004. “Hal Shelton Revisited: Designing and Producing Natural-color Maps with Satellite Land Cover Data.” Cartographic Perspectives, 47: 28–55. doi:10.14714/CP47.470.
- Ramachandran, V. S. 1988. “Perception of Shape from Shading.” Nature 331: 163–166. doi:10.1038/331163a0.
- Richter, R., T. Kellenberger, and H. Kaufmann. 2009. “Comparison of Topographic Correction Methods.” Remote Sensing 1 (3): 184–196. doi:10.3390/rs1030184.
- Saraf, A., J. Das, B. Agarwal, and R. Sundaram. 1996. “False Topography Perception Phenomena and Its Correction.” International Journal of Remote Sensing 17 (18): 3725–3733. doi:10.1080/01431169608949180.
- Saraf, A., P. Ghosh, B. Sarma, and S. Choudhury. 2005. “Cover: Development of a New Image Correction Technique to Remove False Topographic Perception Phenomena.” International Journal of Remote Sensing 26 (8): 1523–1529. doi:10.1080/0143116031000101648.
- Saraf, A., S. Sinha, P. Ghosh, and S. Choudhury. 2007. “A New Technique to Remove False Topographic Perception Phenomenon and Its Impacts in Image Interpretation.” International Journal of Remote Sensing 28 (5): 811–821. doi:10.1080/01431160701269796.
- Smith, J. A., T. L. Lin, and K. L. Ranson. 1980. “The Lambertian Assumption and Landsat Data.” Photogrammetric Engineering and Remote Sensing 46 (9): 1183–1189.
- Teillet, P. M., B. Guindon, and D. G. Goodenough. 1982. “On the Slope-aspect Correction of Multispectral Scanner Data.” Canadian Journal of Remote Sensing 8 (2): 84–106. doi:10.1080/07038992.1982.10855028.
- Todd, J. T., E. J. Egan, and F. Phillips. 2014. “Is the Perception of 3D Shape from Shading Based on Assumed Reflectance and Illumination?” i-Perception 5 (6): 497–514. doi:10.1068/i0645
- Tory, M., and T. Moller. 2004. “Human Factors in Visualization Research.” IEEE Transactions on Visualization and Computer Graphics 10 (1): 72–84.
- Toutin, T. 1998. “Depth Perception with Remote Sensing Data.” In Elevation Modeling from Satellite Data, edited by P. Gudmandsen, 401–409. Hoboken: Wiley Online Library.
- Wu, B., H. Li, and Y. Gao. 2013. “Investigation and Remediation of False Topographic Perception Phenomena Observed on Chang’E-1 Lunar Imagery.” Planetary and Space Science 75: 158–166. doi:10.1016/j.pss.2012.10.018.
- Zhang, W., H. Yuan, and T. Xu. 2010. “Restoring True Topographic Perception of Remote Sensing Images.” Journal of Beijing Forestry University 32 (3): 41–46. doi:10.13332/j.1000-1522.2010.03.034.
- Zhu, X., M. Sun, S. Wang, and L. Yu. 2015. “Comparison of Terrain Reversal Effect Correction Methods in Satellite Imagery.” Journal of Central China Normal University(Natural Sciences) 49 (5): 805–810.