
ABSTRACT
Pushed by the Internet of Things (IoT) paradigm modern sensor networks monitor a wide range of phenomena, in areas such as environmental monitoring, health care, industrial processes, and smart cities. These networks provide a continuous pulse of the almost infinite activities that are happening in the physical space and are thus, key enablers for a Digital Earth Nervous System. Nevertheless, the rapid processing of these sensor data streams still continues to challenge traditional data-handling solutions and new approaches are being requested. We propose a generic answer to this challenge, which has the potential to support any form of distributed real-time analysis. This neutral methodology follows a brokering approach to work with different kinds of data sources and uses web-based standards to achieve interoperability. As a proof of concept, we implemented the methodology to detect anomalies in real-time and applied it to the area of environmental monitoring. The developed system is capable of detecting anomalies, generating notifications, and displaying the recent situation to the user.
1. Introduction
Huge amounts of wireless sensor networks (WSNs) measure almost every possible environmental and man-made phenomena. We can witness some of these networks for different monitoring purposes in our daily lives, e.g. for environmental monitoring (meteorological, air quality, noise, etc.), smart cities (smart parking, smart light, etc.), health-care monitoring, industrial monitoring or social (media) sensing. Each sensor in each network produces a stream of data and – depending on the particular refresh time – may deliver huge amounts of observations which will sum up those coming from the other sensors in the network.
The Internet of Things (IoT) (Kortuem et al. Citation2010) paradigm has allowed these WSNs to be connected to the Internet using the Transmission Control Protocol/Internet Protocol (TCP/IP), and their access tends to get open for everybody. Also, IoT allows finding and retrieving observations in large quantities and establishes a direct connection to WSN.
With these capabilities, we are indeed approaching a Digital Earth Nervous System, as envisaged by De Longueville and others in Citation2010. However, it becomes difficult to analyze all these observations in the moment that the raw values are obtained (Manovich Citation2012). In other words, although Khan et al. (Citation2016) conclude that there are initiatives to improve the processing capabilities, we still miss that to benefit from such a nervous system. In order to implement the Digital Earth vision, we miss an approach that overcomes the heterogeneity and lack of standards of the IoT and enables us to access and process new dynamic data streams from private and public sector in real-time.
In this paper we introduce an approach to analyze the arising flood of monitoring data. We describe a methodology and an associated system architecture to analyze observations from diverse sensor networks at the time they are produced. The capabilities of the proposed solution are tested and showcased in an application that detects anomalies from environmental sensor networks in near real-time.
The resulting system is based on the latest techniques to quickly handle large amounts of streamed data, which guarantees that all data will be fully processed and any kind of algorithm over the data stream can be applied. We extend and provide a generalization of our previous work (Trilles et al. Citation2015), so that the overall solution can be applied to any type of sensor network on the Web. Compared to already existing approaches, new contributions include (1) different tools to connect with sensor data sources regardless of the type of data; (2) the ability to analyze large amounts of sensor data in real-time; (3) a mechanism to transform non-standard sensor data to standard formats; (4) the ability to connect with different protocols by means of a brokering solution; and (5) a framework to serve any sensor data analysis in real-time with different protocols.
2. A methodology for the analysis of the sensor data streams
The proposed methodology processes (big) data produced by sensors in real-time. This methodology can be considered flexible and compatible because (1) works with different sensor data sources with different formats and connection interfaces; (2) allows processing large amount of observations provided by sensors in real-time; (3) allows for the application of any kind of analysis; and the defined methodology can be defined as standard-compliant; and (4) provides the results using standards and offers different protocols to connect with them.
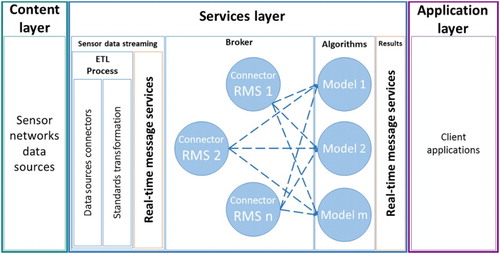
presents an overview of the proposed methodology. It distinguishes three layers: content layer (Section 2.1), services layer (Section 2.2), and application layer (Section 2.3).
Figure 1. Agnostic overview of the presented methodology to analyze sensor data streams.
2.1. Content layer
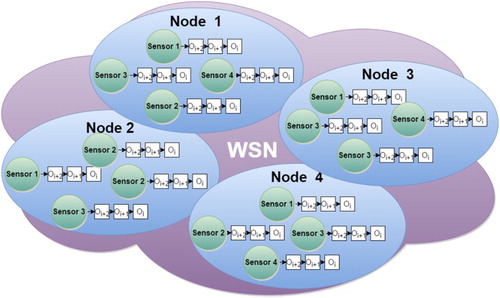
The designed methodology is intended to work with sensor data. It can be applied to any kind of phenomena, such as meteorological (air temperature, air pressure, humidity, etc.), air quality (CO2, CO, PPM, etc.), health (pulse, blood pressure, etc.), or smart cities (smart parking, smart light, etc.). The system considers any data stream as a series of observations that are produced at sensing nodes. Each sensing node has a different refresh rate to generate new observations, may apply different sensors and could measure diverse phenomena. Each sensor produces a stream with observations, which can be either qualitative or quantitative in nature.
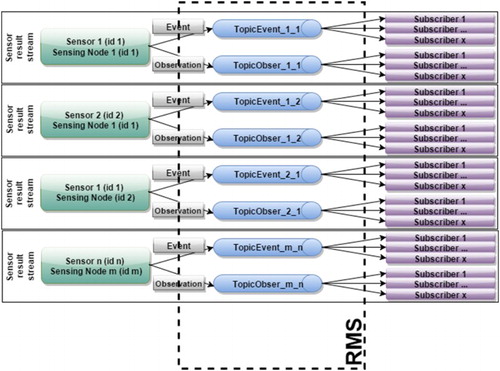
illustrates how different sensor streams form a sensing node. A set of the sensing nodes create a WSN. The content layer may comprise one or more of these WSNs.
Figure 2. Different sensor steams form the sensing nodes and the WSNs.
2.2. Services layer
The services layer connects to the sensor data sources, analyzes the observations and provides the results. We open individual channels to each sensor in order to obtain a data stream for each one. We developed a separate component called real-time message service (RMS) (Section 2.2.1), which encapsulates a set of communication protocols and enables real-time data access. Section 2.2.2 details the connection to sensors of different kinds and the translation to a standard data model where required. The various sensors may support different communication protocols and interfaces for real-time data handling. In a subsequent brokering step (Section 2.2.3), the multiple protocols are harmonized so that standardized data can be processed using a single communication mechanism. After applying the actual processing algorithms (Section 2.2.4), we deliver the results as a dynamic data stream (Section 2.2.5) by re-using the RMS.
2.2.1. Real-time message service
The proposed methodology handles observations in (near) real-time, i.e. new values should be processed as soon as they become available on the Internet. Traditionally, web-based resources are accessed by Hypertext Transfer Protocol requests to a server, which then responds by returning the requested resource (classical request–response communication). This procedure has to be repeated every time that the client wants to access the resource. When dealing with data sources with the highest refresh rates – such as stock price or environmental sensor data – the server has to be requested (almost) constantly in order to remain updated. More effective and efficient approaches have been developed to address such issues. They are based on polling mechanisms, where the client repeatedly sends new requests to the server. If the server has no new data, then it sends an appropriate indication and closes the connection. The client then waits before sending the next request.
We apply this approach in order to transfer sensor observations inside the RMS. RMS is used in different parts of the services layer, in order to prepare the sensor streams in the sensor data streaming (SDS) (see Section 2.2.2). It will be re-used to deliver the analysis results (see Section 2.2.5).
The RMS can be realized with Message-Oriented Middleware, such as, for example, the Java Message Service (JMS) (Hapner et al. Citation2002), and should incorporate a whole series of Message Brokers, such as Apache ActiveMQ,Footnote1 Apollo,Footnote2 HornetQ,Footnote3 RabbitMQFootnote4 and Kafka.Footnote5 The use of such a suite of tools maximizes the flexibility in terms of supported protocols (i.e. being able to exchange messages with many diverse data sources and users) and transferred messages (i.e. being able to understand the content of many diverse data sources and being understood by multiple users/clients).
Our work applies two theoretical concepts of Message-Oriented Middleware:
Point-to-point model: in this model, the Messages are routed to an individual.
Consumer which maintains a Queue of ‘incoming’ Messages.
Publish/subscribe model: this model supports publishing Messages to a particular Message Topic. Subscribers may register interest in receiving Messages on a particular Message Topic.
In addition, the following JMS concepts are used in this work:
Provider: an implementation of the JMS interface for a Message-Oriented Middleware.
Client: an application or process that produces and/or receives Messages.
Producer/Publisher: a Client that creates and sends Messages.
Consumer/Subscriber: a Client that receives Messages.
Message: a Message can be any object or data that need to be transported using JMS.
Queue: a staging area that contains Messages that have been sent and are waiting to be read (by only one Consumer). A Queue only guarantees that each Message is processed only once.
Topic: a distribution mechanism for publishing Messages that are delivered to multiple Subscribers.
2.2.2. Sensor data streaming
The SDS component offers two functionalities. First, the SDS connects with different sensors to obtain observations. Since most publicly available WSNs do not offer standard access to the data that they produce (Trilles et al. Citation2014), Extract, Transform and Load (ETL) processes translate the original non-standard data formats to a standard one. In order to facilitate this work and to reuse existing tools, we contemplate three categories of WSNs depending on the data formats that they support: structured WSNs, semi-structured WSNs, and non-structured WSNs. We will detail these categories in Section 4.1.
As shows, the ETL process has two steps. The first step, data sources connectors, is responsible for extracting the sensor data from the different data sources. As mentioned earlier, different natures of sensor data are considered, and in this way the SDS performs as a broker (Buschmann et al. Citation1996). As structured and semi-structured types of sensor data have to be processed, the SDS needs to be able to connect to data sources that use diverse formats and understand different protocols. In other words, it needs specific connectors for each data source. For the standard WSNs, a single connector can be reused for different WSNs that follow the same approach. For other sensor data sources, a specific connector is needed for each source to obtain the particular observations that it produces. This step requires several parameters that are specific for each data source. This includes information about the connection with the sensor data source itself, as well as the sensor refresh rate that is required to obtain new observations as soon as they become available. In the second step, standard transformations are applied in order to obtain interoperable sensor data. A process transforms each observation that is provided by a non-standard source to a standard format.
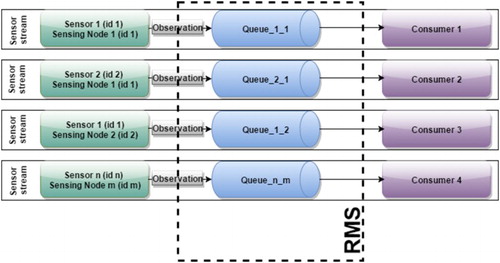
Finally, the SDS creates the different data streams using the RMS component. For this process, a Message Broker with the Point-to-point model is used (), so that it ensures complete Message delivery to the Consumer. This step results in one stream (Queue) per sensor and sensing node. illustrates this particular use of the RMS.
Figure 3. Point-to-point model.
2.2.3. Brokering approach
In order to access data from sources that use different communication protocols and message encodings, we apply a brokering approach (Buschmann et al. Citation1996; Nativi, Craglia, and Pearlman Citation2012) at the service layer. shows how a broker allows clients to connect with data sources by using multiple protocols. This capability to interact with multiple sources increases the systems flexibility, scalability, and interoperability. Our proposed methodology uses brokering in order to connect with the RMS. It thereby enables the use of different RMS instances – each of which might operate on a different protocol.
Figure 4. Conceptual brokering approach.
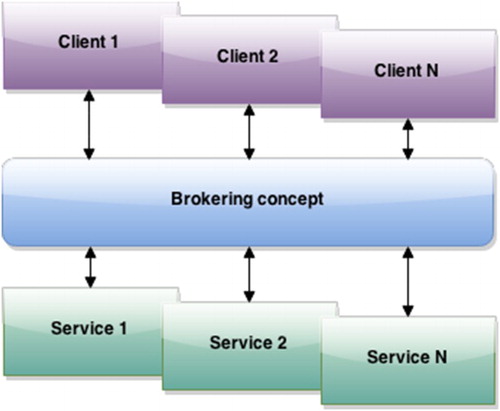
The methodology offers connection nodes ( blue circles) to different RMS protocols, which are called Connector RMS, as a Consumer role. Thus, each node provides a client that is able to connect with the different supported protocols. The current implementation of the broker only offers connection with different protocols, it does not support multiple data formats, because the SDS is supposed to work with a standard format. Each Connector RMS establishes a connection between different sensor streams provided by different RMS’s. In this way, the observations are obtained as they are acquired. Finally, these nodes forward the retrieved observations to the algorithms inside the next processing step.
2.2.4. Application of algorithms
The presented methodology permits any algorithm to be performed on the observation series. These algorithms are codified as different nodes in order to allow parallel computation (see also ). The outputs of each single node can be transferred to subsequent nodes, thus enabling interconnectivity between algorithms, or being delivered as system output. The algorithms have to adapt themselves to the nature of data provided by the data source before applying the entailed analysis step. The use of standards for the sensor streams eases the data preparation for the analysis. Depending on the kind of analysis, the algorithm may have different kinds of outputs.
It is important to keep in mind how observations are propagated between the algorithms inside the systems workflow. As we are dealing with data streams, the position of each observation within respect to the other elements of the stream is essential. Depending on the type of analysis, the system may need to preserve the order of all observations inside the same data stream. Our methodology guarantees that all observations of each stream will be analyzed, and offers the possibility to keep the order in which the single elements are processed.
2.2.5. Delivery of results
The algorithms may, for example, extract knowledge about anomalies from the (big) data inputs and provide (small) data (Mayer-Schönberger and Cukier Citation2013) that can be easily visualized. Depending on their type, these outputs can be encoded using the most appropriate standard. The RMS is used to improve the interoperability, offering a variety of communication protocols. For this purpose, the RMS is applied with a publish/subscribe model which allows several clients (subscribers) to connect to a particular output stream and to get notified if appropriate. shows an example where the RMS provided has outputs per sensor and sensing node.
Figure 5. Publish/subscribe model.
2.3. Application layer
In order to create reusable clients, the services layer offers a variety of communication protocols and standard formats. These features allow creating clients that can be used in different scenarios. The application layer connects with this final part of the service layer and more specifically with the RMS.
3. Real-time event detection using the CUSUM algorithm
We tested the methodology, which was detailed in the previous section, using an algorithm for the anomaly detection over environmental sensor data. As soon as an anomaly is detected, a notification has to (1) trigger a decision-making process, and (2) inform about the anomaly that caused the event, together with surrounding context information. In many cases, this support has to be provided in (near) real-time because decision-making is time-critical.
We selected the CUmulative SUM (CUSUM) (Page Citation1954) algorithm for detecting anomalies in data series from environmental monitoring. This algorithm can be applied to any series of values and detects anomalies in real-time. In essence, it compares two different instances of the same discrete probability function for a data series (Mesnil and Petitgas Citation2009).
3.1. Past usages of the CUSUM algorithm
The CUSUM algorithm was initially developed for industrial process control purposes. In recent years, it has been successfully used in other areas. In Osanaiye and Talabi (Citation1989), the algorithm is used to detect possible outbreaks of epidemics. Grigg, Farewell, and Spiegelhalter (Citation2003) analyzed the 30-day mortality for patients after cardiac surgery. Furthermore, CUSUM is used to improve the communication in WSNs. In Jeske et al. (Citation2009), authors developed two CUSUM change-point detection algorithms for data network monitoring applications. CUSUM has additionally been used in pattern recognition, specifically in neural networks. A sample of these can be found in Guh and Hsieh’s (Citation1999) study where it proposes an artificial neural network-based model, which contains several back propagation networks. Chuen-Sheng (Citation1995) describe an alternative approach for statistical process control, using artificial neural network technology and compares its performance with that of the combined Shewhart-CUSUM schemes. CUSUM has already been successfully used for a number of environmental problems (Charles and Jeh-Nan Citation2002; Carslaw, Ropkins, and Bell Citation2006; Barratt et al. Citation2007; Chelani Citation2011).
Following these successful examples, we decided to use CUSUM as part of our anomaly detection system. In our implementation example (Section 4), CUSUM is applied to detect anomalies of air pollutants. The accuracy of this algorithm has been tested in the previous mentioned works.
3.2. Description of the CUSUM algorithm
CUSUM considers a set of observations (xi) with collected observation i = 1, … , n, where n is the number of data points. The algorithm assumes that these observations are in-control when the collection has a mean (µ) and variance (σ2) for a normal period and following a normal distribution N (µ, σ2). When the process is in-control, we can obtain the CUmulative SUM (Si) in an iterative way through the following expression:(1) where S0 = 0, zi is the standard normal variable,
, x¯ is the mean and s is the standard deviation of the time series. Furthermore, the change in terms of increased or decreased process mean can be detected, respectively by computing the quantities as (Lucas Citation1982
(2)
where the parameter k is the reference value to be appropriately chosen. The parameter, k, is the allowable ‘slack’ in the process and is usually set to be one half of the mean one wishes to detect. The confidence limits (threshold) specified for the CUSUM control charts are hσx, where h = 5 and σx is the standard deviation (Barratt et al. Citation2007).
When SHi or SLi overcome the threshold, the algorithm detects anomalies. If SHi exceeds the threshold the anomaly will be due to the increase (up-event) and if SLi is greater than the threshold, it will be due to the decrease (down-event).
Two characteristics of CUSUM limit the sensitivity of the results. First, the identification of an out-of-control process relies on the assumption that readings are statistically independent and follow a normal distribution. Second, sensory phenomena measurements can have some seasonality and long-term trends. The effect that this has is that the threshold may be out of adjustment.
4. An environmental anomaly detection system
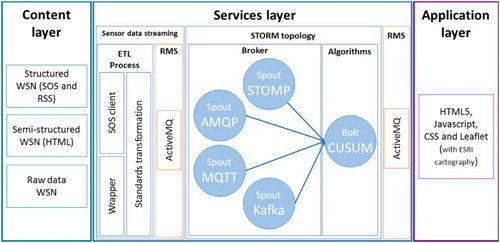
We proof the conceptual design of our methodology by implementing a system to detect anomalies over environmental sensor data. summarizes all technologies used for each part of the system. It proposes a specific technology for the domain-independent methodology presented in Section 2.
Figure 6. Technological overview of the proof of concept to detect anomalies.
4.1. Content layer
As indicated in Section 2.1, the proposed system supports the three following types of sensor data sources, depending on the structural characteristics of the data format:
Structured WSN: within this category there are two subcategories. In the first subcategory, the sensor data sources are provided in standard sensor formats, for example, using the Sensor Observation Server (SOS) of the Open Geospatial Consortium (OGC). In the second subcategory, the sensor data sources themselves follow a standard format encoded with a structured format,
such as really simple syndication (RSS). Our proof of concept uses the 52 NorthFootnote6 implementation of an SOS and MeteoclimaticFootnote7 to support RSS.
Semi-Structured WSN: in this case, a sensor data source is encoded in a semi-structured format, such as the HyperText Markup Language (HTML). We use an example of this type, the air quality network of the Valencian Community government,Footnote8 in order to test the proposed methodology.
Non-Structured WSN: in this case, sensor data sources do not follow any structure. The SEnviro network (Trilles et al. Citation2015) provides an example of this type of WSN. SEnviro provides low-cost environmental sensors based on the Arduino platform.Footnote9 The sensor data are provided directly from the SEnviro nodes.
To test our methodology, we have chosen a semi-structured air quality sensor network provided by the Valencian Community’s government. As earlier commented, to use the CUSUM algorithm we need two parameters (threshold and k) per sensor that our system analyses. We obtain these parameters from historical data from the presented data source. One year of historical data (1 January 2013 to 31 December 2013) was used for this purpose.
4.2. Services layer
We also implemented a proof of concept for the services layer. Section 4.2.1 shows the framework used to create an RMS instance. The next section (Section 4.2.2) presents the implementation of the SDS. The Section 4.2.3 details the framework used between the current available solutions in order to analyze the sensor data.
4.2.1. Real-time message service
For the RMS component, we used a JMS framework called ActiveMQ. To connect with ActimeMQ, we provide a Client using the Simple (or Streaming) Text-Oriented Message Protocol (STOMP);Footnote10 it can behave as Producer or Consumer. This client offers two different connection models: Point-to-point model, and Publish/Subscribe (Section 2.2.1). It was used in the different detailed components to connect with the RMS.
4.2.2. Sensor data streaming
As earlier commented (Section 2.2.2), the SDS uses an ETL process in order to connect and standardize sensor data sources. Following , the ETL process is split into two steps. In the first step, we have two different components, wrappers and SOS client, that depending on the structure of the data source, the connection is established by one of these two components. For sources that already comply with OGCs SOS standard, we developed an SOS client that implements the operation getobservationbyId in order to retrieve the last observation of each sensor. For all other sources, we require a tailor-made connector. Following our previous work (Trilles et al. Citation2014), we create a particular wrapper for each of these cases. In this way, this component is responsible for connecting and processing the data for storage. It allows the system to scale by adding new data sources. For this task, this wrapper component uses web scraping techniques to extract the observations from each sensor and it is adapted for each kind of data structured. This module uses some libraries to analyze this data source and to extract each observation. Both the wrapper component and the SOS client adapt the frequency to the frequency of publication of each data source. Finally, the sensor observations obtained by these components from each sensor are applied to them to the real-time interfaces of the RMS.
SOS clients as wrappers need to perform the connection using different parameters. For this to occur, we need to know the refresh rate and the uniform resource locator (URL) to access each sensor. A custom XML file is used to store these parameters. It contains a single entry to define the sensor network; it also contains details about each sensing node: an identifier, name, and city, state, or location. The sensing node entry includes a separate element for each sensor that is measured by the sensing node. Each of these elements contains details about the measured phenomenon: an identifier, observed property, unit of measure, and refresh rate. It also contains the parameters that are needed to run the CUSUM algorithm (threshold and k). Finally, each sensory phenomenon also contains the URL to connect with the sensor data source and the URL to the sensor data stream to connect with the RMS.
Now the SDS standardizes the observation encoding and access. A transformation is applied each time when the system receives a new observation. Each transformed observation is encoded in line with the according OGC standard for Observations and Measurements (O&M) (Cox Citation2007) using a DOM (Document Object Model) parser.
In order to connect with the RMS and to provide an observation stream for each sensor, the Client has been used as a Producer. The produced observation is sent to the corresponding Queue (stream) – one Queue per sensor and sensing node. shows this use of the RMS. In this case, we apply the Point-to-point model of RMS, because it ensures that the Consumer will get all the Messages produced. Another XML file is created to define the settings to connect with the sensor streams. This file offers the URLs and the protocol type when the stream is available.
4.2.3. STORM topology
Solutions for real-time data analysis are already available, examples include Storm, S4, Samza, Borealis, MillWheel, and many more. For this study, we used Storm because it is one of the most used and offers a wide sample of examples. It is used as a single component to perform the brokering and analysis steps. This part of our developments is based on the Storm framework, which distributes processed unbounded streams of data in real-time.
With this novel application of the Storm framework to the IoT, we are able to analyze multiple streams (with different protocols) and apply dedicated anomaly detection algorithms to them. With the choice of this technology, the scalability is assured. Storm can reach rates of even one million 100 byte messages per second per node,Footnote11 and allows large clusters of more than 2000 nodesFootnote12 to be tested.
The brokering behavior is provided within the RMS connectors (see Section 2.2.3). These are implemented using different Storm Spouts for each supported Message Broker protocol. This increases the interoperability of the system by supporting multiple protocols and allowing different RMS instances to be applied. For our broker, we implemented four different Spouts, each supporting a different Message Broker protocol. We selected the four protocols that are most widely used: Stomp, AMQP, MQTT, and Kafka. Each Storm Spout is developed as a Consumer, in order to connect each of them with the different RMS available and obtain the sensor observation from the different streams.
Storm offers an at-least-once processing guarantee, but does not consider the order in which data streams are emitted. In fact, the tuples will have a different order when they are processed. To achieve the objectives set out, the order of tuples must be maintained .We use TridentFootnote13 to ensure this. Trident is a high-level abstraction framework for computation on Storm. As with the core Storm application programming interface (API), Trident uses Spouts as the source of data streams. It has consistent, exactly once semantics (same order), so it is easy to reason about Trident Topologies usage. It already offers different operations, such as functions, filters, and aggregations from streams of tuples.
The analysis step is implemented using Storm Bolts. Inside each Bolt we can apply any analysis algorithm. We developed a Bolt with the CUSUM algorithm. This Bolt is in charge of applying CUSUM to the series of tuples that are provided by the different Spouts. In order to execute the CUSUM algorithm on each phenomenon-specific measurement stream (as described in Section 4.2.2), we separate the tuples, which arrive from the sensor networks, using unique sensor identifiers.
When an anomaly is detected by CUSUM, the Events Bolt uses the Message Broker Client to send notifications to the RMS as a Provider. Again, a Queue is created for each sensor and sensing node. We again apply the Publish/Subscribe model.
The events are currently also provided in a standard format using Common Alerting Protocol (CAP) encoding. Each event contains a sensor identifier (sender field) and the identifier of the particular observation that has caused the event (identifier field). CAP is a message format designed for distributing public warnings. It was standardized by the Organization for the Advancement of Structured Information Standards in 2004, and uses XML as a data-encoding format. The msgType field indicates the identified event which refers to an exceeding of the threshold (up-event) or to the fact that the observed value falls below the thresholds (down-event).
Each event contains a sensor identifier (sender field) and the identifier of the particular observation that has caused the event (identifier field). The msgType field indicates the identified event which refers to an exceeding of the threshold (up-event) or to the fact that the observed value falls below the thresholds (down-event). A second bolt provides access to the latest observations that the Spouts have sent.
This Bolt is necessary to serve the tuples uniformly and these can be consumed by the final applications.
The two Bolts use the Message Broker Client as a Producer to connect with the RMS. Also, the functionalities are both performed with the Publish/Subscribe model, so that different Consumers (final applications) can connect to the same Queue.
4.3. Event dashboard
An event dashboard visualizes the data provided by the service layer. It shows the triggered decision-making processes by providing information about detected anomalies in a spatio-temporal context. This dashboard offers a simple functionality with the aim to test our use case in event detection. More specific dashboards could be implemented guided by the expertise and interests of other particular users. These dashboards would have relevant information related to the user’s realm.
The client shows all sensing nodes of a network on a map using markers ( (a)). Inside each marker, the amount of events that have been detected for this particular sensing node appears. If this node triggers an event, the marker turns red, if not the marker remains blue. The dashboard does not distinguishes if the event is ‘up’ (exceeding the threshold) or ‘down’ (falling below the threshold). A scale clustering has been applied to the markers following the quantity of events ( (b)). When zooming out, the markers will be combined with the total amount of events that have been identified in the cluster. The color of the marker is red if one sensing node of this cluster launched an event.
Figure 7. (a) Shows the sensing nodes (or cluster) as markers and the events are indicated inside the marker. (b) This figure shows how clustering is applied taking into account the number of events issued. (c) It shows the different sensors as a markers menu. (d) A pop-up with a graph is displayed to visualize the last observations and the events launched.
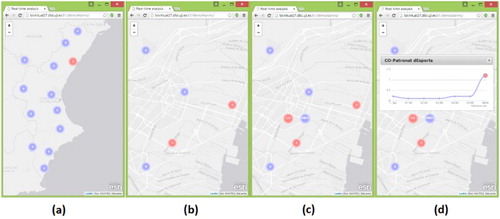
If a user selects a single sensing node marker, new markers appear as a menu ( (c)). Each new marker represents a sensor that is associated with this particular sensing node, if a new event has been reported, the marker will appear in red. Once you click on one of the sensor markers, a new window appears as a pop-up widget on the dashboard, displaying the latest observations in a graph ( (d)). The observations inside the graph are obtained from the service layer. The graph is dynamically updated with the latest observations. In the graph, events are highlighted as a red rhombus. Also, these events are obtained from the service layer. The chart is updated any time a new observation is produced. The user can display different graphs simultaneously, even different sensors from different sensing nodes. In this way, one can compare the values of the same sensory phenomena inside the same network.
To offer a flexible, compatible and standard-compliant solution, we re-used a combination of already existing frameworks. (1) LeafletFootnote14 with ESRIFootnote15 basemap to put the makers on the map. It has proved to be a fast and efficient solution. In addition, it can be executed in restrictive environments, such as in smartphones. (2) Another library that we used was Bootstrap.Footnote16 It offers the capacity for building a responsive dashboard, as it can adapt to the device’s features. Also, we use jQueryFootnote17 to handle pop-ups. (3) Finally another framework used was Highchart JS.Footnote18 It is a graphics library written in HTML5 and JavaScript. The library provides an easy and interactive way to generate graphs in a web environment.
5. Discussion of the proposed methodology
The work presented in this article can be discussed from three different viewpoints. The first subsection below (Section 5.1) reviews the use of the presented work to analyze data, especially provided by environmental sensor networks. The next subsection (Section 5.2) analyses the possibility to expand the methodology to other sensor networks with different kinds of sensor data, such as social networks. The final subsection (Section 5.3) discusses issues that directly relate to the applied algorithm and facilitated data streams.
5.1. Applied to sensor networks
The proposed methodology is designed to be used with data provided by WSNs (mobile sensing). To our knowledge, this is the first time that Storm is applied in the IoT and environmental monitoring. It can be applied to analyze data coming from other kinds of WSNs in the context of the IoT (Bahga and Madisetti Citation2014), such as home, cities, energy, health, agriculture, and so on. These WSNs can be designed for both static and mobile sensing.
In fact, our approach has had taken into account different types of sensor networks depending on the format used. The benefit to integrate all types of data sources is to offer a generic solution that can be reused at any scenario with different WSN characteristics. For this purpose, the methodology offers the connection of both, standard and non-standard sensor data sources. In order to connect with standard sources, a client following the OGC SOS specification is provided and could directly be re-used to connect to non-environmental sensor data sources. For non-standard sources, ad hoc connectors would be needed to obtain the observation streams. In such a case, we propose to apply wrapping techniques for establishing the connection. Implementations would only require an extension of the currently available brokering facilities in order to make it fit to additional protocols.
The standardization of sensor data is another benefit of the proposed solution. Also here, transformations would have to be applied to non-standard sensor data sources. As soon as the ETL process from non-standard observations to O&M is defined, the observation series can be directly handled by our solution. By supporting O&M as a standard format, we homogenize the data structure that the system internally uses and transfer this to the application layer in order to improve the creation of applications.
5.2. Application to other different scenarios
The methodology presented was applied to data provided by environmental WSNs. However, the system is designed to operate with any series of values (observations) generated by sensing nodes, i.e. it is per se independent of the particular nature of the observed phenomena. The exact processing will depend on the kind of data provided.
In this way, the defined methodology can equally be applied to sources provided by smart phones, tablets, wearables, etc. Such devices are increasingly enabled with sensorial capabilities, including Global Positioning System (GPS), gyroscopes, accelerometers, cameras, and others. These so-called pervasive sensors can be used to provide context-aware, adaptable, and personalized services that closely interact with the surrounding world. Going one step further, pervasive sensors can be used to infer peoples activities, which leads to the process of social sensing. Here, people generate huge amounts of data and share these using Web 2.0 services (e.g. TwitterFootnote19 or InstagramFootnote20). A possible use of the presented methodology is to analyze the data provided by these services. In this case, the sensors are the citizens that provide data streams. As a matter of fact, Storm was initially developed by Twitter, Inc. (Toshniwal et al. Citation2014) for exactly such purposes. Similar approaches (using Storm) have already been suggested to analyse the data provided by different kinds of sensors, including (1) Simoncelli et al. (Citation2013) used Storm to extract trending hashtags from Twitter, and count occurrences of citations. (2) Authors in Ji et al. (Citation2014) use Storm framework to analyze the data provided by the magnetic sensor networks. (3) Kumar (Citation2014) proposes a system to detect anomalies in a water distribution network. (4) In Nandan (Citation2013), the authors analyze the location of the players and the ball during a football match by radio sensors. For this, they use Storm to apply a real-time analysis.
The solution presented in this article can be used to encapsulate each of these approaches. It can be considered a scalable solution, because all system parts have been designed to facilitate its extensibility and reusability. In fact the components follow a modular design to improve reusability. For instance, the RMS component follows a concept of Message Broker and can be used depending on the specific scenario. The standards used and the protocol variety also improves the connectivity between the clients. This helps to reuse the same client in different scenarios.
All in all, we designed and tested an integrated and scalable brokering platform that is able to integrate different data streams with high refresh rates and able to apply any kind of analysis. This approach is intended to connect with environments where there is a variety of sources, especially in urban areas such as Smart Cities. The component has been shown to improve interoperability in the analysis of huge quantities of information across different sensor data sources.
5.3. Anomalies detection
In the proof of concept implementation, we apply the CUSUM algorithm to detect anomalies over air quality sensor data. We decided to use this algorithm because it has successfully proved in related works (see Section 3), which applied the basic CUSUM algorithm to detect anomalies from series of environmental data with different sensory phenomena, such as CO2, PPM, and NOx, among others.
Nevertheless, the CUSUM algorithm has known limitations when it is applied to environmental data. The CUSUM algorithm detects abrupt changes in a data series following some known probability distribution function. If a normal distribution is assumed, an abrupt change in the mean of the distribution is considered only, no change in the standard deviation is assumed. Also, it does not consider trend changes or the seasonality of a particular phenomenon. The characteristics of each phenomenon may not only vary depending on the season of the year, but also on the location of the sensor, for example, a measured phenomenon may not have the same behavior in a rural area or industrial area. CUSUM is not capable to incorporate such specifics.
The adaptation of the analysis to each sensory phenomenon is beyond the scope of this article. Our current work focuses on a generic methodology that can apply any analysis over a sensor data stream, whereas the CUSUM algorithm is only used to illustrate the procedure and provide a first proof of concept. Any other algorithm for anomaly detection could be equally applied.
It would only require adapting its implementation to be executed inside the Storm framework, which would be done in a similar way as already presented by the adaptation of CUSUM algorithm. The selection of the most appropriate algorithms would clearly depend on the investigated sensory phenomena.
6. Related work
In the literature, there are some approaches that are similar to our proposal. The following works all propose a way to store and analyze data provided by the IoT devices.
Cecchinel et al. (Citation2014) define a software architecture supporting the collection of sensor-based data in the context of the IoT. The architecture supports research efforts on Big Data through the collection of large datasets obtained from physical sensors. The architecture is validated based on the SmartCampus scenario, but the work done focused on data collection and storage. The authors propose using OGC standards in the future.
The authors in Mishra, Lin, and Chang (Citation2015) describe a cognitive-oriented IoT Big data framework (COIB framework) for the effective data management and knowledge discovery over the IoT Big data layering architecture. This architecture is used in smart industrial applications.
The paper Fazio and Puliafito (Citation2015) presents two different strategies for managing sensing resources in the cloud and providing them as a service. A cloud framework called Cloud4Sens uses sensor web enablement (SWE) specifications. This framework is applied to two different applications, the first supports risk management and the second detects potholes and monitors road surface conditions exploiting virtual devices sited in a certain area.
The work presented in Fazio et al. (Citation2015) presents a hybrid architecture to design a cloud storage solution able to store huge amounts of heterogeneous data, and provide them in a uniform way using SWE specifications by the OGC.
A new framework to handle data provided by IoT is proposed in Lee, Yeung, and Cheng (Citation2015). The authors present an architecture of a context intelligence platform for big data analytics for industrial engineering and other research areas. The proposed use case utilizes radio frequency identification technology to track and control the process in an industry, and uses the defined system to control different situations of these industry processes.
Tai et al. (Citation2015) describe a cloud platform able to connect with heterogeneous WSNs, and standardize them according to the SWE specification. A business intelligence software layer is used for processing. Finally, an application layer offers user interfaces in order to interact with the system. The use case for this work is focused on risk detection in environmental and industrial production.
In order to compare the formerly reviewed works, has a comparison between the detailed works. It uses the following characteristics:
Big data: the work can be considered to work with high levels uses or does not use open-hardware components to create the ‘smart things’. Scale: Yes (what framework)/No.
GIS standards: shows if the system offers GIS standards as OGC specification. Scale: Yes/No.
Real-time: indicates if the system works in real-time. Scale: Yes/No.
Analyze: indicates if the system applies an analyze process. Scale: Yes/No.
Client: indicates if the system provides a client to visualize the sensors and observations. Scale: Yes (what kind)/No.
Smart factor: the smart factor to cover with each project. Scale: smart environment, smart people, smart economy, smart mobility, etc.
Table 1. Comparison between different related works.
Our approach is the only one that guarantees high scalability, provided by the Storm framework. It aims to be interoperable, and for this purpose, it is the only one that uses OGC standards, such as SWE. Furthermore, we provide real-time bidirectional communication, in order to offer the sensor values as soon as possible. Our main objective is to analyze sensor data, and offer the possibility to apply different algorithms over this kind of data. Finally, the work presented in this article also offers a web client using Leaflet library. Our context could be applied in whatever ‘smart’ context, but we have chosen a smart environment scenario.
7. Conclusions
We have introduced a domain-independent methodology to analyze data streams from sensor networks in near real-time. The methodology includes access points to different sensor data sources offering multiple protocols. It supports a rich range of tools to connect with sensor data sources regardless of the particular data types that they offer by following a brokering approach. This approach also allows connecting with different real-time interfaces, so that the system could analyze large amounts of sensor data in real-time and can serve the results in standard formats.
The presented methodology addresses two challenges. The first challenge was to provide a system able to analyze data coming from sensors in real-time. Multiple sensor data sources are supported. Our methodology allows analysis of each of the observations without faults. Although, the data source used has low refresh rates, it could scale to higher refresh rates or add multiple data sources into the same system. The second challenge is to offer a scalable and interoperable solution. Our methodology offers different features which contribute to improving these requirements. For this purpose, the designed components can be reused for other scenarios with other characteristics. Also a broker design pattern is used to offer multiple connections with heterogeneous interfaces. Finally, as concluded Cecchinel et al. (Citation2014) sensor data formats are critical to support their exploitation and the use of standards could improve substantially the interoperability, such as the SensorML initiative. For this reason, our system uses OGC standards to encode the data to provide a variety of protocols.
To test and illustrate this methodology, we present the implementation of a proof of concept that detects anomalies in the data provided by environmental monitoring stations. Although our validation example focuses is domain specific, environmental data, data coming from different fields (environmental, traffic, health, and so on), could be combined to provide a cross-domain solution in studies concerned on the traffic influence over the environment, for example.
In this proof of concept, new technologies are used such as the stream processing framework Storm, and JMS. The CUSUM algorithm has proven to be useful in detecting anomalies in a series of observations of air quality and weather. However, CUSUM presents some limitations that must be taken into account, such as the consideration that all the series must follow a normal distribution and a series of observations cannot have trend changes. The use of alternative algorithms, for example the one developed by Chelani (Citation2011), remains to be investigated. This should particularly consider those algorithms that can account for phenomenon-specific probability distributions.
Such applications to a wider range of phenomena and the according sensor networks would already allow us to tap into a large part of senses about our environment. It would also enable us to process the retried data close to real-time and thus provides an important part of a Digital Earth Nervous System. Conceptually, the work can be directly applied to extend the initial implementation to other phenomena and data sources. It offers a framework for the parallel handling of large data streams from heterogeneous sources and thus overcomes the lack of standards of the IoT and enables us to access and process new dynamic data streams from both private and public sector in real-time. The up-scaling to larger sensor networks and the inclusion of a larger variety of data sources into the prototype is a topic for future work.
As a next step, we plan to use a new generation of data sources provided by smart phones or wearables, such as accelerometer, gyroscopes, heart rate monitor, and so on. As well as over the published data in Web 2.0, in order to infer peoples’ activities in the same moment that the anomalies are produced. The functionality to process multi-sensory integration as suggested by Ostermann and Schade (Citation2014) has yet to be developed in a subsequent step.
Other point that we want to explore is the semantic interoperability in the IoT context. In Kotsev et al. (Citation2015), authors talk about the SWE limits in the semantic area, especially in the IoT context, due to the high degree of heterogeneity in phenomena of interest, observed properties and applied measurement procedures. Possible solution such as the Semantic Sensor Network (SSN) Ontology of the World Wide Web Consortium (Compton et al. Citation2012) have been developed during the last years, as part of the Semantic Web and Linked Data movement. As Schade (Citation2005) concludes, new investigations of the application of semantic interoperability solution have to be carried out to enhance these issues.
Disclosure statement
No potential conflict of interest was reported by the authors.
ORCiD
Òscar Belmonte http://orcid.org/0000-0002-0121-0697
Joaquìn Huerta http://orcid.org/0000-0002-8625-441X
Additional information
Funding
Notes
References
- Bahga, Arshdeep, and Vijay Madisetti. 2014. Internet of Things: A Hands-On Approach. VPT. www.internet-of-things-book.com.
- Barratt, B., R. Atkinson, H. R. Anderson, S. Beevers, F. Kelly, I. Mudway, and P. Wilkinson, et al. 2007. “Investigation into the use of the CUSUM Technique in Identifying Changes in Mean Air Pollution Levels Following Introduction of a Traffic Management Scheme.” Atmospheric Environment 41 (8): 1784–1791. doi: 10.1016/j.atmosenv.2006.09.052
- Buschmann, F., R. Meunier, H. Rohnert, and P. Sommerlad. 1996. Pattern-oriented Software Architecture, Volume 1: A System of Patterns. New York: Wiley.
- Carslaw, D., K. Ropkins, and M. C. Bell. 2006. “Change-Point Detection of Gaseous and Particulate Traffic-Related Pollutants at a Roadside Location.” Environmental Science and Technology 40 (22): 6912–6918. doi: 10.1021/es060543u
- Cecchinel, Cyril, Matthieu Jimenez, Sebastien Mosser, and Michel Riveill. 2014. “An Architecture to Support the Collection of Big Data in the Internet of Things.” In 2014 IEEE World Congress on Services (SERVICES), 442–449. Anchorage, AK: IEEE.
- Charles, J. C., and P. Jeh-Nan. 2002. “Evaluating Environmental Performance Using Statistical Process Control Techniques.” European Journal of Operational Research 139 (1): 68–83. doi: 10.1016/S0377-2217(01)00155-2
- Chelani, A. 2011. “Change Detection Using CUSUM and Modified CUSUM Method in Air Pollutant Concentrations at Traffic Site in Delhi.” Stochastic Environmental Research and Risk Assessment 25 (6): 827–834. doi: 10.1007/s00477-010-0452-6
- Chuen-Sheng, C. 1995. “A Multi-Layer Neural Network Model for Detecting Changes in the Process Mean.” Computers & Industrial Engineering 28 (1): 51–61. doi: 10.1016/0360-8352(94)00024-H
- Compton, Michael, Payam Barnaghi, Luis Bermudez, RaúL. GarćıA-Castro, Oscar Corcho, Simon Cox, John Graybeal, et al. 2012. “The SSN Ontology of the W3C Semantic Sensor Network Incubator Group.” Web Semantics: Science, Services and Agents on the World Wide Web 17: 25–32. doi: 10.1016/j.websem.2012.05.003
- Cox, S. 2007. Observations and Measurements Part 1 – Observation Schema. Technical report. Open Geospatial Consortium (OGC).
- DeLongueville, Bertrand, Alessandro Annoni, Sven Schade, Nicole Ostlaender, and Ceri Whitmore. 2010. “Digital Earths Nervous System for Crisis Events: Real-Time Sensor Web Enablement of Volunteered Geographic Information.” International Journal of Digital Earth 3 (3): 242–259. doi:10.1080/17538947.2010.484869.
- Fazio, M., A. Celesti, A. Puliafito, and M. Villari. 2015. “Big Data Storage in the Cloud for Smart Environment Monitoring.” Procedia Computer Science 52: 500–506. doi: 10.1016/j.procs.2015.05.023
- Fazio, Maria, and Antonio Puliafito. 2015. “Cloud4sens: A Cloud-Based Architecture for Sensor Controlling and Monitoring.” Communications Magazine, IEEE 53 (3): 41–47. doi: 10.1109/MCOM.2015.7060517
- Grigg, O., V. Farewell, and D. Spiegelhalter. 2003. “Use of Risk-Adjusted CUSUM and RSPRT charts for Monitoring in Medical Contexts.” Statistical Methods in Medical Research 12 (2): 147–170.
- Guh, R., and Y. Hsieh. 1999. “A Neural Network Based Model for Abnormal Pattern Recognition of Control Charts.” Computers & Industrial Engineering 36 (1): 97–108. doi: 10.1016/S0360-8352(99)00004-2
- Hapner, M., R. Burridge, R. Sharma, J. Fialli, and K. Stout. 2002. Java Message Service. Santa Clara, CA: Sun Microsystems, Inc.
- Jeske, D., V. Montes De Oca, W. Bischoff, and M. Marvasti. 2009. “Cusum Techniques for Timeslot Sequences with Applications to Network Surveillance.” Computational Statistics Data Analysis 53 (12): 4332–4344. doi: 10.1016/j.csda.2009.05.029
- Ji, Zhanlin, Ivan Ganchev, Mairtin ODroma, Li Zhao, and Xueji Zhang. 2014. “A Cloud-Based Car Parking Middleware for IoT-Based Smart Cities: Design and Implementation.” Sensors 14 (12): 22372–22393. http://www.mdpi.com/1424-8220/14/12/22372. doi: 10.3390/s141222372
- Khan, I., F. Belqasmi, R. Glitho, N. Crespi, M. Morrow, and P. Polakos. 2016. “Wireless Sensor Network Virtualization: A Survey.” IEEE Communications Surveys Tutorials 18 (1): 553–576. doi: 10.1109/COMST.2015.2412971
- Kortuem, G., F. Kawsar, D. Fitton, and V. Sundramoorthy. 2010. “Smart Objects as Building Blocks for the Internet of Things.” Internet Computing, IEEE 14 (1): 44–51. doi: 10.1109/MIC.2009.143
- Kotsev, Alexander, Francesco Pantisano, Sven Schade, and Simon Jirka. 2015. “Architecture of a Service-Enabled Sensing Platform for the Environment.” Sensors 15 (2): 4470–4495. doi: 10.3390/s150204470
- Kumar, Simpal. 2014. “Real Time Data Analysis for Water Distribution Network using Storm.” Ph.D. thesis. University of Fribourg.
- Lee, C. K. M., C. L. Yeung, and M. N. Cheng. 2015. “Research on IoT based Cyber Physical System for Industrial big data Analytics.” Industrial Engineering and Engineering Management (IEEM), 2015 IEEE International Conference on, Singapore, 2015, 1855–1859. doi:10.1109/IEEM.2015.7385969
- Lucas, J. M. 1982. “Combined Shewhart-CUSUM Quality Control Schemes.” Journal of Quality Technology 14 (2): 51–59.
- Manovich, L. 2012. “Trending: The Promises and the Challenges of Big Social Data.” In Debates in the Digital Humanities, edited by Matthew K. Gold, 460–475. Minneapolis: University of Minnesota Press.
- Mayer-Schönberger, Viktor, and Kenneth Cukier. 2013. Big Data: A Revolution that Will Transform How We Live, Work, and Think. Boston: Houghton Mifflin Harcourt.
- Mesnil, B., and P. Petitgas. 2009. “Detection of Changes in Time-Series of Indicators Using CUSUM Control Charts.” Aquatic Living Resources 22 (02): 187–192. doi: 10.1051/alr/2008058
- Mishra, Nilamadhab, Chung-Chih Lin, and Hsien-Tsung Chang. 2015. “A Cognitive Adopted Framework for IoT Big-Data Management and Knowledge Discovery Prospective.” International Journal of Distributed Sensor Networks. http://www.hindawi.com/journals/ijdsn/2015/718390/.
- Nandan, Naveen. 2013. “Live Analytics on High Velocity Sensor Data Streams using Event-Based Systems.” Journal of Industrial and Intelligent Information 1 (1): 1–15. doi: 10.12720/jiii.1.1.81-85
- Nativi, S., M. Craglia, and J. Pearlman. 2012. “The Brokering Approach for Multidisciplinary Interoperability: A Position Paper.” International Journal of Spatial Data Infrastructures Research 7: 1–15.
- Osanaiye, P., and C. Talabi. 1989. “On Some Non-Manufacturing Applications of Counted Data Cumulative Sum (CUSUM) Control Chart Schemes.” The Statistician 38: 251–257. doi: 10.2307/2349058
- Ostermann, F., and S. Schade. 2014. “Multi-Sensory Integration for a Digital Earth NerVous System.” In Connecting a Digital Europe Through Location and Place: Proceedings of the AGILE 2014 International Conference on Geographic Information Science, 104–108. edited by Joaquin Huerta, Sven Schade, and Carlos Granell, Castellon: University of Jaume I.
- Page, E. S. 1954. “Continuous Inspection Schemes.” Biometrika 41 (1/2): 100–115. doi: 10.2307/2333009
- Schade, S. 2005. “Sensors on the Way to Semantic Interoperability.” Proceedings GI-Days 2005: Geo-Sensor Networks - From Science to Practical Applications. ifgi-Prints Bd. 23. Münster.
- Simoncelli, D., M. Dusi, R. Gringoli, and S. Niccolini. 2013. “Stream-Monitoring with Blockmon: Convergence of Network Measurements and Data Analytics Platforms.” ACM SIGCOMM Computer Communication Review 43 (2): 29–36. doi: 10.1145/2479957.2479962
- Tai, Haijiang, Antonio Celesti, Maria Fazio, Massimo Villari, and Antonio Puliafito. 2015. “An Integrated System for Advanced Water Risk Management Based on Cloud Computing and IoT.” In 2015 2nd World Symposium on Web Applications and Networking (WSWAN), edited by Salvatore Gaglio and Giuseppe Lo Re, 253–269. Snowbird, UT: IEEE.
- Toshniwal, A., S. Taneja, A. Shukla, K. Ramasamy, J. M. Patel, S. Kulkarni, J. Jackson, et al. 2014. “Storm@Twitter.” In Proceedings of the 2014 ACM SIGMOD International Conference on Management of Data (SIGMOD’14), edited by Curtis Dyreson, Feifei Li, and M. Tamer Özsu, 147–156. New York: ACM.
- Trilles, S., O. Belmonte, L. Diaz, and J. Huerta. 2014. “Mobile Access to Sensor Networks by Using GIS Standards and RESTful Services.” Sensors Journal, IEEE 14 (12): 4143–4153. doi: 10.1109/JSEN.2014.2339931
- Trilles, Sergio, Alejandro Lujàn, Òscar Belmonte, Raùl Montoliu, Joaquìn Torres-Sospedra, and Joaquìn Huerta. 2015. “SEnviro: A Sensorized Platform Proposal Using Open Hardware and Open Standards.” Sensors 15 (3): 5555–5582. doi: 10.3390/s150305555
- Trilles, Sergio, Sven Schade, Oscar Belmonte, and Joaquin Huerta. 2015. “Real-Time Anomaly Detection from Environmental Data Streams.” In Geographic Information Science as an Enabler of Smarter Cities and Communities, Lecture Notes in Geoinformation and Cartography, edited by Fernando Bacao, Maribel Yasmina Santos, and Marco Painho, 125–144. Springer International Publishing. doi:10.1007/978-3-319-16787-9_8.