
ABSTRACT
The observation of demographical, economical or environmental indicators over time through maps is crucial. It enables analysing territories and helps stakeholders to take decisions. However, the understanding of Territorial Statistical Information (TSI) is compromised unless comprehensive description of both the statistical methodology used and the spatial and temporal references are given. Thus, in this paper, we stress the importance of metadata descriptions and of their quality that helps assessing data reliability. Furthermore, time-series of such TSI are paramount. They enable analysing a territory over a long period of time and likewise judging the effectiveness of reforms. In light of these observations, we present Spatio-Temporal evolutive Data Infrastructure (STeDI) an innovative Spatial Data Infrastructure (SDI) that enriches the description of a Digital Earth, providing a virtual representation of territories and of their evolution through statistics and time. STeDI aims at managing a whole dataflow of multi-dimensional, multi-scale and multi-temporal TSI, from their acquisition to their dissemination to scientists and policy-makers. The content of this SDI evolves autonomously thanks to automated processes and to a Web platform that help improving the quality of datasets uploaded by experts. Then, STeDI allows visualizing up-to-date time-series reflecting the human activities on a given territory. It helps policy-makers in their decision-making process.
1. Introduction
In the field of spatial planning, policy-makers and, more broadly, stakeholders involved in spatial planning need statistical indicators such as Unemployment rate, Migration rate or Land transport to perform analysis and to make decision. As a matter of fact, the analysis of territories through the evolution of statistics over time allows stakeholders to be aware of the impact of past policies, to understand territory at present time and then to better build the future.
In this paper, the concept of Territory should be understood as any portion of geographical space that coincides with the spatial extent of a government’s jurisdiction (Gottmann Citation1975). Also, the statistics we are interested in – called Territorial Statistical Information (TSI) – are a subset of the statistical information. Quite different from statistics used in the fields of genetics or finance, TSI usually measures some observed phenomenon concerning some human population (e.g. demography, climate change) that lives and evolves on a territory. Then, TSI consists of two pieces of information – statistical and geographic – that are inseparable, as it would make no sense, for example, to get unemployment figures without knowing the territory (portion of space or administrative division of space) concerned by these figures. TSI takes the form of datasets (e.g. Unemployment rate dataset) composed of several indicators (e.g. the Unemployment rate of women indicator and the Unemployment rate of men indicator). An indicator I consists of a set of observations O. Each O measures, at a specific date or period of time t, a value V for I on a territorial unit U, where U is a portion of the observed space, whose boundaries are known (geometry). Territorial nomenclatures are designed to standardize territorial divisions into territorial units where or upon which statistical data are produced. Several territorial nomenclatures have been designed and they address various needs (e.g. nomenclatures Nomenclature of Territorial Units for Statistics (NUTS)Footnote1 or Functional Urban Areas (FUA)Footnote2).
A territorial nomenclature can be seen as a hierarchy of sets of territorial units with at least one level (see ). Each level of this hierarchy consists of a given division of space (for instance an administrative division), which results in a set of territorial units. Also, for any couple (Li, Li+1) of two consecutive levels in a territorial nomenclature, the following relation and assertion stands: any unit of the lowest level Li+1 is spatially included in one and only one unit of the upper level Li (as shown in ). Hence, such a territorial nomenclature corresponds to a recursive spatial hierarchical division (overlapping or not) of the space. Moreover, a territorial nomenclature may change in time, due to administrative reorganization for instance, resulting in the creation of several versions for the same territorial nomenclature (see two versions for the nomenclature X on ). For example, on , a territorial reorganization causes the increase in the number of units of the levels 1 and 2. Thus, a territorial reorganization, carried out in at least one level of the classification, results in a new version of the nomenclature.
Figure 1. Hierarchical levels of two versions of the Nomenclature X.
TSI is multi-dimensional: it covers a multitude of themes and measures values on territorial units whose boundaries often evolve over time. The indicator values also change over time (e.g. evolution of the Unemployment rate) as well as the definitions, and the calculation methods dedicated to these indicators evolve in time and/or over space … Thus, in a single period of time, several definitions of the same concept coexist. For example, the definition of the concept of unemployed person varies almost from one country to another. Moreover, boundaries between territorial units change (e.g. some units disappear or are renamed) with administrative changes. Changes in territorial divisions are known, for example, in the United States as gerrymandering, a process of redrawing districts lines, when elections are in the offing. Similarly, very recently, the European territory, between 1990 and 2010, has undergone many boundary changes that have led to the succession of four different official versions of the EU territorial division into administrative units. Therefore, the European territory is an interesting case of study: a vast and multi-level territory that, very frequently, is subject to change. We choose to present, in this paper, some TSI management issues within the European context.
Though today statistical standards (e.g. ISO-17369/Statistical Data and Metadata eXchange (SDMX)Footnote3) and geospatial metadata standards (e.g. ISO-19115Footnote4) exist and enable the description of statistical and geographic data, none of them allows mirroring the complexity of TSI datasets that are both statistical and geographic. Thus, there are neither standards nor interoperable tools to manage those statistics, from their acquisition until their restitution, while more and more institutions nowadays need such tools for online sharing of TSI. The Eurostat Online DatabaseFootnote5 provides official statistics on the European Union but since data are documented using a subset of ISO-17369/SDMX, the spatial dimension of statistics is only succinctly described. Moreover, only the latest collected data – using the latest official version of the territorial nomenclature – are disseminated. Thus, official long time-series are scarcely available online, preventing territorial stakeholders to analyse indicators over a long period of time. Then, systems able to archive and disseminate indicators based on different territorial nomenclature versions are needed.
From these observations, we clearly identify a need for a standard data model (or an extension of an existing one), allowing an accurate description of all TSI characteristics relying on (and encompassing) spatial, temporal and statistical metadata. Metadata are essential as they enable both the understanding and the disambiguation of statistics (OECD Citation2002). For example, they allow for the handling of some territory lineage (i.e. traceability of territorial units evolution) and some data lineage (i.e. data source and methodology).
Moreover, there is a need for software tools able to manage TSI from its harvest to its restitution. Four kinds of actor are at stake here. Specifically, Data Producers require tools assisting them in building harmonized TSI datasets, compliant with standards. Data Distributor Authorities need tools but also Experts for analysing data and ensuring the quality of TSI they disseminate, so that the credibility of their institution or agency is unquestioned, and the public policy debates discuss the alternative policy options, not the reliability of the numbers (Brackstone Citation1999). Then, Users (e.g. scientists, policy-makers), on their side, expect a standard and smooth way to access online information in order to analyse territories past, present and future tendencies through various software, including mapping tools.
In this paper, we present a Spatio-Temporal evolutive Data Infrastructure (STeDI) that enriches the description of a Digital Earth by managing (from online collection to dissemination) multi-dimensional, multi-scale, multi-temporal data to give an accurate appreciation of the statistical and spatial evolution of territories through time. STeDI is a Spatial Data Infrastructure (SDI), which means more than a single database: it hosts geographic data, coming with formatted, constrained and mandatory documentation (metadata), and offers a mean to discover, visualize and evaluate data (catalogues and Web mapping), as well as some methods to provide access to geographic data (Nebert Citation2004). STeDI is innovative in the field of Digital Earth as it answers challenges identified by the International Council for Science (Craglia et al. Citation2012), such as the ability to include scenarios of possible policy responses to measure the impact across environmental, social and economic domains. Indeed, STeDI is like a ‘collaboratory – a laboratory without walls’ (Gore Citation1998) for scientists who can share results through the platform, but also build new analysis and prospectives thanks to online data, and then share them again. Our aim in designing and developing STeDI is to provide analysts and policy-makers with useful and well-documented statistical information then, to offer a virtual representation of activities (led by humans or by the nature) over territories that evolve through time.
The strength of STeDI lies in its model (i.e. metadata and data model) that imposes an accurate description of the incoming TSI. It absorbs territories and data dynamicity by extending ISO standards. Relying on this model, we have developed a set of software tools organized on a modular architecture that contributes to the flexibility of STeDI and allows adapting the managed TSI to different domains and users. For instance, one of the most innovative tools that compose STeDI is the Checking tool that aims at collecting and improving the quality of TSI datasets before they are stored in the system. Any dataset supplied to the system is checked according to different criteria (e.g. syntactic or semantic).
The remainder of the paper is organized as follows: Section 2 presents in detail the characteristics of TSI; Section 3 makes an overview and shows the limits of existing data models allowing the representation of statistical and/or geographic information; Section 4 presents the STeDI infrastructure: its data model, its software components and an operational implementation of the SDI; Section 5 concludes with some tracks for future work.
2. Territorial Statistical Information
Plumejeaud (Citation2011) highlighted the structure of TSI that usually comes in the form of datasets. Statistical datasets can be understood in three levels of information: (1) the dataset level, (2) the level of statistical indicators composing the dataset and (3) the level of data, which describes the indicator values for each unit of a territory. A territorial unit is one piece of the territory puzzle, defined by a unique identifier, a name and geometries that draw its boundaries.
In the following subsections, we investigate TSI characteristics more precisely.
2.1. Multi-dimensional, heterogeneous and evolutive information
European statistical agencies resort to official territorial nomenclatures that usually split each territory into territorial units. Then, these agencies share a common definition of territorial divisions, for a given period of time. For example, the NUTS nomenclature divides the European territory into four hierarchical levels (forming nested geographical objects), as shown by : level 0 corresponds to the division of the European territory into its State members, level 1 splits each of the States obtained at level 0 into major Regions, level 2 divides each major Region of level 1 into basic Regions, level 3 divides into small Regions and so on. The exhaustive NUTS nomenclature is composed of six levels (NUTS level 0 to NUTS level 5, levels 4 and 5 are composed of Local Administrative Units).
Figure 2. NUTS levels. NUTS divisions of the French territory into four levels.
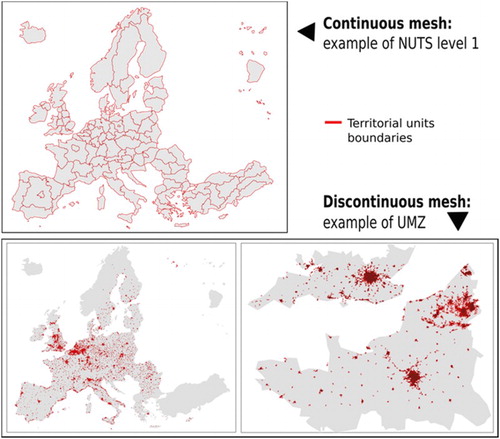
The NUTS classification divides the European territory into contiguous territorial units (i.e. continuous mesh), irregularly shaped, covering the entire territory without overlapping of the units of a same level (Plumejeaud Citation2011). Other territorial nomenclatures (see ) describe, through one territorial level, non-contiguous geographic objects (i.e. discontinuous mesh) such as urban objects (e.g. Urban Morphological Zones (UMZ), Morphological Urban Areas (MUA)). Using such heterogeneous territorial nomenclatures, institutions compile statistics at different territorial levels.
Figure 3. Territorial nomenclatures heterogeneity: example of the NUTS and UMZ nomenclatures.
Territorial changes lead to new nomenclature versions causing ruptures in statistical time-series. Here, time-series refers to sets of observations of a statistical variable, measured at regular intervals (e.g. year, month, day).Footnote6 Let us suppose that the version X of the NUTS (NVx) is used, in 2014, to measure the indicator ‘Employment rate in Europe’ and the version X + 1 of the NUTS (NVx+1) is used to measure the indicator, in 2015. In this case, the two sets of measurement do not belong to the same time-series, since the territory may have changed between NVx and NVx+1.
The time-series of the indicator is broken, in 2014, unless all data measured before 2015 are migrated from NVx to NVx+1, or vice-versa. Such a process implies that statisticians check, value-by-value, whether the described territorial units are the same from one nomenclature version to another and if not, they compute estimates of values, considering the new territorial unit boundaries. For instance, the estimation of values may be computed using the ratio established between the former and the new surface area of the territorial unit, provided that there is a correlation between the surface area and the value (see ). So, geographic information is crucial in statistics (Gallego Citation2010) and tools that disseminate TSI must provide users, such as statisticians, with geographic information, in order to allow them to construct long time-series.
Figure 4. Measured and estimated indicator values, at a same date, considering different territorial division.
As noted earlier, the definitions of indicators may also evolve. For example, the concept of Poverty is frequently redefined because the prospect of what poverty is changes over time. That is why, in order to interpret TSI without too much distortions or side effect, metadata are required.
2.2. Metadata of TSI
According to the OECD (Citation2002), the methodology used to compile statistics is not always transparent for a large number of users. This leads to misinterpretation of statistical data, especially when comparing indicators such as Unemployment rate, whose calculation method may vary from one country to another, depending on the definition adopted for ‘unemployed person’. Such a comparison between indicators requires accessing methodological information that outlines the definitions, sources or calculation methods, that is, metadata descriptions of the indicators. It is obviously necessary to control the quality of those metadata in order to strengthen the reputation of the statistical agencies as a source of trustworthy information (Brackstone Citation1999), otherwise the statistics will not be used, and decision-making will not be guided by sound evidence (WHO Citation2013).
In addition to metadata quality, data and metadata must comply with standards such as the ISO ones in order to ease the dissemination of datasets and the understanding of the phenomena they describe. Indeed, if a similar dataset structure is adopted, whatever the dataset, then users only need to focus on the understanding of the content. The next section presents an overview of existing standard models that enable the description and representation of TSI.
3. Existing models
Some standards enable the description of geographic information (e.g. ISO-19115), while others enable the description of statistical information (e.g. ISO-17369/SDMX). In this section, we focus on the specifications addressing both statistical and territorial aspects, like, for example, the INSPIRE and the Euro-SDMX Metadata Structure (ESMS).
In the European context, the INSPIRE Directive requires producers of digital geographic data to apply rules for their harmonization, standardization and dissemination. More broadly, this directive aims at improving the access to spatial information across EuropeFootnote7 by fostering cooperation between institutions, so that they share common tools and build together a network of SDI at European level.Footnote8 That is to say, their respective systems communicate via services and exchange standard geographic data.
The directive sets up specifications in order to harmonize geographic datasets (European Council Citation2008). They are based on the ISO-19100 series of standards. Especially, the ISO-19115 and ISO-19119 are recommended in the context of metadata for the discovery of data (JRC Citation2007). The ISO-19115Footnote9 defines the required schema for describing geographic information and services by means of metadata. The ISO-19119Footnote10 identifies and defines the architecture patterns for service interfaces used for geographic information. Furthermore, several INSPIRE technical guides contain additional metadata elements suited to the description of the specific thematic area of data. For example, the Statistical Units (SUs) and Population Distribution and Demography (PDD) themes address together the statistical datasets. The SU theme deals with the geographic objects used in statistics (JRC Citation2013a), which we previously called territorial units, whereas the PDD theme considers the statistical data associated with territorial units (JRC Citation2013b).
Guidelines on SU focus on the hierarchical relations that may exist between territorial units, considering territorial units that compose other ones. They also address the evolution of the territorial units since units may be changed, deleted, created, aggregated or split, due to territorial changes (JRC Citation2013a). The PDD theme points out elements that enable the description of phenomena concerning the population living in some SUs (JRC Citation2013b). This theme has no direct spatial features. It needs to be linked to the SU theme to address the geographic nature of the statistical data (JRC Citation2013a) as shown in . This figure focuses on the link between the SU and PDD themes established through a unique identifier called inspireid: a set of measures (StatisticalDistribution element) is directly linked to a territorial unit (VectorStatisticalUnit element).
Figure 5. INSPIRE data model extract (Based on: INSPIRE Consolidated UML Model). http://inspire.ec.europa.eu/data-model/approved/r4618-ir/html/
Although the spatial and statistical dimensions of TSI are processed, the SU and PDD themes do not provide a complete description of TSI. First of all, the hierarchical structure of statistical dataset (see the introduction of the Section 2), composed of several indicators, is not reproduced. Moreover, technical guidelines do not address the quality of statistical data (JRC Citation2013b), whereas those metadata are key elements for the user to estimate data reliability. The INSPIRE directive has not yet achieved the construction of an official model for describing TSI, due to the complexity of the geographical and the statistical systems (JRC Citation2013b). The ground rules are laid down and suggestions are made, such as the use of the SDMX model to reach the description of TSI datasets (JRC Citation2013b).
The SDMX initiative fosters standards for the exchange of statistical information.Footnote11 The underlying purpose is to improve the interoperability of systems that manage statistical data and metadata (SDMX Citation2012). SDMX defines a data and metadata structure adapted to the statistical datasets implementation. In Europe, the Eurostat organization has built the ESMS model on a subset of the SDMX one (Gotzfried and Pellegrino Citation2008).
ESMS is available as a spreadsheet fileFootnote12 that lists the 21 SDMX key concepts chosen by Eurostat in order to describe their statistical data (see an extract of this model in ). The model supports key statistical metadata such as: Unit of Measure, Source Data (sub-item of the Statistical processing concept), Documentation on methodology (sub-item of the Accessibility of documentation concept) and data quality (concept entitled Quality management). Regarding the temporal dimension, the Reference period concept indicates the period of time or the instant to which the measured observation refers. The field Reference Area, sub-items of the Statistical Presentation concept, enables Data Producers to describe the studied geographic area.
Figure 6. Extract of ESMS (based on: Eurostat Metadata Structure). http://ec.europa.eu/eurostat/data/metadata/metadata-structure
However, no specific field in the metadata is dedicated to the description of the territorial nomenclature used. Thus, this information is sometimes not available or sometimes mentioned in the fields Classification System or Data Description. Also, the modelling of those spatial nomenclatures (their nested territorial levels and territorial units) is not addressed through the ESMS model. Though ESMS and SDMX ‘allow the publication of statistical information, they do not cover spatial representations of the statistical units’ (JRC Citation2013a). Also, ESMS does not address the modelling of territorial changes over time whereas it would enable, among other things, the automation of data migration from one nomenclature version to another.
To sum up, the INSPIRE and SDMX models must be further linked to address description of TSI as a whole.
The OpenGIS Catalogue Service (OGC) initiative has created the Table Join Service (TJS) standard that offers a standardized Web service interface for automatic joining of statistical data to geographic data (administrative and SUs) by distributed access. Nevertheless, TJS does not solve problems such as the dissemination of statistical metadata (e.g. data source, methodology): the result of a TJS Join operation can only be a URL to a map (e.g. to be retrieved by a Web service like Web Map Service (OGC Citation2006)) or a URL to get raw, vector data back (e.g. by using Web Feature Service (OGC Citation2005)) (Brentjens and Grothe Citation2013). TJS does not propose a new standard model in order to disseminate all characteristics of TSI.
The STeDI infrastructure that we present in the following section helps to fill the gap between the Geographic Information System (GIS) and the statistical world. STeDI’s data model is INSPIRE compliant, and includes items such as the ones provided by the SDMX standard, for the description of the statistical data.
4. The STeDI infrastructure
STeDI is a SDI. However, as noticed by Hendriks, Dessers, and van Hootegem (Citation2012), the SDI concept is hard to define because of its dynamic nature caused by rapid technological developments. This results in many SDI definitions in the literature that take many different directions (Craglia and Campagna Citation2009; Grus, Crompvoets, and Bregt Citation2010). Nevertheless, Hendriks, Dessers, and van Hootegem (Citation2012) identify exhaustive definitions such as the one of European Commission (Citation2007) that combines a specification of components (technology and standards), with combinations of data-related and user-related objectives:
‘infrastructure for spatial information’ means metadata, spatial data sets and spatial data services; network services and technologies; agreements on sharing, access and use; and coordination and monitoring mechanisms, processes and procedures, established, operated or made available in accordance with [ … ]
As the users and the components of an SDI are equally important, we first give, in this section, an overview of STeDI showing who are the actors involved and in which way they exploit the tool. Then, we focus on the design and components of the infrastructure.
4.1. STeDI actors and datasets lifecycle
STeDI involves four types of actors (see ).
Figure 7. STeDI actors and main use cases.
The first actor is the Data Distributor Authority. It is a private or a public body who wants to collect and disseminate TSI. This may be, for instance, a public authority responsible for an urban area growing rapidly and in charge of the dissemination of statistics describing this area, in order to open up public data to citizens.
The second actor in STeDI is the Data Producer who creates and delivers TSI dataset. She (or he) may be a statistician or a citizen providing statistics, such as ‘Birth register’, describing her territory. She delivers dataset through the STeDI collaborative Web platform. This platform also enables her to monitor the process of improving the quality of dataset and to be part of this process alongside Experts.
The Data Distributor Authority mandates the Expert in order to evaluate the quality of dataset delivered by Data Producer. The Expert submits a report, from the platform, containing her recommendations addressed to the Data Producer to improve, if needed, the quality of metadata or data.
The last but not least actor of STeDI is the User. She can be anyone looking for TSI, for analysis and understanding of territories purposes: policy-maker, statistician, scientist or even citizen. A User, such as a statistician, may in turn become a Data Producer compiling, for example, datasets that estimate values in a new territorial nomenclature thanks to TSI downloaded from the STeDI Web platform.
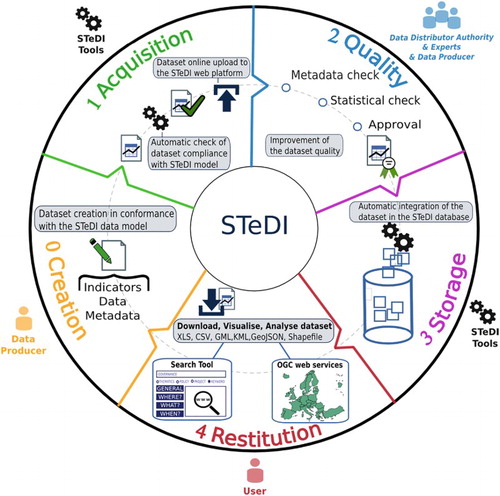
All these actors are involved during the successive phases of a dataset lifecycle organized within STeDI (see ). First, the Data Producer creates a dataset (, Step 0). She (or he) is invited to use a set of specifications and templates available online, via the Web platform. Then, she uploads her dataset from the STeDI Web platform (, Step 1). After that, automated tools and Experts, mandated by the Data Distributor Authority, are asked to appraise, correct and improve the quality of the delivered dataset (, Step 2). Once the dataset is audited and approved by the Data Distributor Authority, it is automatically integrated into the STeDI database (, Step 3) and then made immediately available through search interfaces and Web services (, Step 4). Thus, once online, Users can download datasets and compile new TSI from those datasets (, Step 0).
Figure 8. STeDI dataset lifecycle.
A typical scenario is the following. A statistician downloads an indicator from the search tool interface (e.g. Total Births in Greece from 1990 to 2012, considering the NUTS version 2006). Then, she (or he) constructs a new dataset by estimating the indicator values in a more recent NUTS version (i.e. NUTS version 2010). She explains its methodology through the appropriate metadata fields, so that everyone can understand the process used to estimate values. She uploads her new dataset through the online platform (, Step 1). Then, the dataset, after experts’ evaluations of the methodology used to estimate values (, Step 2), will in turn be available through the online search tool (, Step 4).
Thus, the dataset lifecycle is ensured within STeDI. The system lives autonomously and is ready to upload, check, validate, accept and finally integrate new data and metadata. To meet this goal, design choices regarding the data model and the system architecture are essential, as presented below. They enable STeDI to cope with the evolving nature of territories and indicators.
4.2. System design
One objective was to ensure STeDI to be able to store any TSI, whatever the time period, the theme or the territory described and their changes over time. This is required so that Users can understand territories in light of the potential evolution of both their spatial divisions and their statistical measures and values. Metadata are the only way for users to deal efficiently with the complexity and heterogeneity of data. For instance, to decide if population figures are comparable or not (e.g. population figures of the UK Government and World Bank datasets cannot be compared unless conversion of values first), we must access metadata and observe, for example, whether the data sources use different scales or not (Do et al. Citation2015). As stated by Madnick and Zhu (Citation2006), there are legitimate needs for representing data in different ways to suit to different purposes but this creates semantic heterogeneities. Therefore, it is crucial that systems support heterogeneity by preserving the autonomy of all data sources (Madnick and Zhu Citation2006). Thus, we have designed STeDI, keeping in mind the importance of delivering accurate and complete metadata that allow clearly identifying data sources and methodologies used to construct dataset values. To provide Users with metadata, at delivering time, obviously requires documenting TSI, at collection time.
Then, the first step is to provide the system with a flexible model that enables the description of any TSI. This data model – which extends the one advocated by INSPIRE (i.e. SU and PDD themes) – imposes Data Producers a data scheme to comply to and to provide a mandatory set of spatial, temporal and statistical metadata elements that guarantees an unambiguous reading of the dataset and of its indicators. Second, we have developed some online and collaborative tools that provide actors of the system with the ability to check and assess the quality of datasets and then, to feed the system database in an autonomous way.
Third, we have built STeDI upon a modular and flexible architecture so that the system can easily be adapted to data, user practices and needs that evolve. A specific module performs each phase of the TSI management process. Thus, if Data Producers change their way to build datasets, from a tabular model (e.g. CSV) to a more hierarchical model (e.g. XML), then, only the module responsible for the dataset reading will have to be modified in order to parse XML files. Also, in order to ensure some flexibility, we have decided to disaggregate each dataset until the atomic elements that are: one (possibly missing) value of indicator for each territorial unit at one given period for one version of a nomenclature. Then, we store each element (data and metadata) of the datasets in the appropriate table of a relational database, while preserving links between each of those elements. Thus, at the time of data restitution, tools can re-build datasets as they have been entered in the system or aggregate multiple values from different datasets. Also, users can search for one specific value of one indicator. The STeDI model and components are presented, in more detail, in the next sections.
4.2.1. Data model
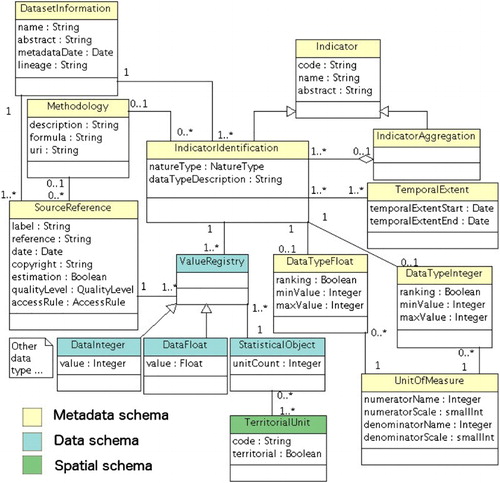
At the very heart of STeDI lies the data model that provides the system with a formal representation of TSI. This model, called STeDI model, captures the evolving nature of territories, data and definitions used for the construction of values. It is an evolution of a previous work (Plumejeaud Citation2011), more precise regarding the modelling of statistical (aggregate) indicators. shows its main elements, distributed in three sets: metadata, data and spatial.
Figure 9. An excerpt of the STeDI model.
This data model complies with the INSPIRE metadata specifications common to all spatial data (European Council Citation2008). It is also a concrete implementation of the INSPIRE-specific recommendations regarding the SU and PDD themes. Furthermore, it extends these INSPIRE specifications with statistical elements coming from the SDMX standard. Hence, it is a step that forwards the dissemination of territorial statistical data, according to standards, in Europe.
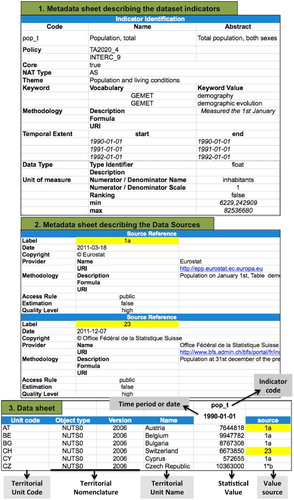
The first extension that we propose enables the representation of TSI at interdependent levels: the dataset is the highest level, then come the indicators, and finally the indicator values. The model describes dataset elements down to the smallest entity that is the indicator value (i.e. one measurement) and its accuracy allows linking each value (i.e. ValueRegistry element, ) to its source (i.e. SourceReference element of the Metadata schema, ). presents an excerpt from a dataset delivered to STeDI. This dataset complies with the STeDI model. It can be noticed that the metadata sheet lists several sources used for the compilation of one indicator (highlighted in yellow in ) and within the data sheet, each value of the indicator is actually associated with the specific source from which it originates. Consequently, at the time of data restitution, the model allows recovering the source of each value separately.
Figure 10. Excerpt of a dataset file compliant with the STeDI model.
The second extension includes statistical metadata to foster the monitoring and the understanding (i.e. SourceReference, UnitOfMeasure, Methodology elements of the Metadata schema, ) of TSI.
A third extension describes the spatial dimension of the dataset. It makes it possible to link any statistical value of a dataset to a territory thanks to the territorial unit unique identifier (i.e. code attribute of the StatisticalUnit element), as recommended by the INSPIRE directive (JRC Citation2013a). More precisely, within the STeDI model, a statistical value (i.e. ValueRegistry element of the Data schema, in ) is measured on a statistical object (i.e. StatisticalObject element of the Data schema, in ) that is a SU composed of sub-SUs or not (StatisticalUnit element of the Spatial schema, in ). Furthermore, the model assimilates the dynamics of the studied territories by enabling two successive versions of a nomenclature to be linked, through typologies designed for that purpose:
The Typology of Events occurring on one or more territorial units when comparing one nomenclature version to another one enables the description of events that have led to the modification of territorial units (e.g. merge, split, redistribution);
The Typology of Derivations lists four types of link that may exist between two territorial units derived from different nomenclature versions: includes, equals, included and intersects (Plumejeaud Citation2011).
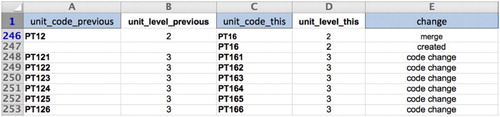
Thus, each territorial unit is linked to its previous version (see column A, ) and tagged by metadata coming from items of these typologies (see column E, ). This allows the tracking of all the territorial changes that occurred, unit by unit, from one version of the nomenclature to another (M4D Citation2014). This way a territorial lineage is established and managed by STeDI.
Figure 11. Extract of the STeDI Dictionary of Spatial Unit of the NUTS version 2003. http://database.espon.eu/db2/jsf/DicoSpatialUnits/resource/Nomenclature_NUTS_extended_2003/nomenclature.xls
Based on these metadata, software tools (e.g. R programs) that automate the transfer of values from one territorial nomenclature version to another can be designed, allowing for the construction of time-series of various indicators. In particular, logic inference rules may be implemented in order to transfer values from one nomenclature version to another (i.e. non-aligned meshes). For instance, the following rule enables to automatically assign values from one nomenclature version to another: ‘If the territorial unit U1 in the nomenclature version X (NVx) equals the territorial unit U1′ in NVx+1 then the value V (measured at time t0, on U1), can be assigned to U1′, at the same t0’.
Here, the predicate equals means that the geometry of the considered unit U1 remains unchanged between the two versions of the nomenclature (while the identifier or the name of the unit might have changed). This is the simplest case. Other algorithms may be required under a range of other circumstances (e.g. spatial rescaling) (Flowerdew and Green Citation1989).
The data model implemented within STeDI fills the gap between the GIS and the statistics worlds as it jointly deals with the geographic and the statistical nature of TSI, thanks to the INSPIRE extensions created. All the STeDI components, presented hereunder, operate this model. In particular, search tools allow users to download indicators according to search criteria based on metadata elements provided by the model (e.g. keywords, temporal extent, territorial unit), as shown in the following sections.
4.2.2. Components
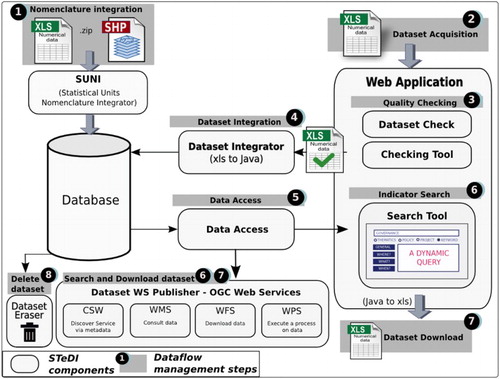
shows the software component architecture of STeDI. Links between components are established to manage a dataflow as a whole. The STeDI components (e.g. Statistical Units Nomenclature Integrator (SUNI) or Dataset Integrator shown on ) are pieces of software offering a service, able to communicate with other components (Szyperski Citation2002). In terms of software engineering, the STeDI system is written in Java programming language. It is based on the module concept as defined by the Apache Maven Project. The combination of Java modules (compiled as .jar file, i.e. reusable Java libraries) builds a STeDI component such as the Dataset Integrator for instance. Together, the components form STeDI that offers all the services a SDI should address: host, discover, visualize, evaluate and provide access to geographic data (Nebert Citation2004). We present these components in closer detail below.
Figure 12. STeDI software components.
4.2.2.1. Components dedicated to data acquisition and quality
Prior to data acquisition, Data Producers consult templates in order to build datasets compliant with the STeDI model. Those templates impose datasets to be delivered as tabular files (e.g. CSV, Excel®). This file format has been chosen to adapt to statisticians’ practices that are used to resort to spreadsheet files for data because they are familiar and in widespread use (Statistical Services Centre Citation2003). Also, spreadsheets are convenient from a user point of view, since they allow him to easily access data and perform relatively simple computations on data for statistical analysis purpose (Nash Citation2006). Then, data acquisition is performed through the Web Application so that producers can upload their datasets online (see , Step 2).
Whereas the templates help producers to build a dataset, they do not guarantee the quality of the provided information. Indeed, data quality means far more in statistics than the respect of a model. For instance, the documentation is also an element of quality, as noticed by Sundgren (Citation2001) and documentation (i.e. metadata) may be irrelevant, incomplete, inexact and hard to understand even if all the mandatory fields imposed by the data model are filled. Thus, agencies that are responsible for the production and dissemination of official statistics (e.g. Eurostat in Europe, United States Census Bureau in United States) adopt a method to guarantee the quality of their statistical data, according to multiple criteria. These quality approaches are often similar even if the criteria names may differ. We propose here, on the basis of quality approaches described in European Commission and Eurostat (Citation2015), USCB (Citation2013), and WHO (Citation2013), a list of quality criteria, and we have also adopted (and implemented) within STeDI:
Relevance or Utility: data meet the needs of users;
Accuracy and Reliability: data correctly estimate the quantities or characteristics being measured and users have confidence in the statistics produced with appropriate standards;
Interpretability and Clarity: users can understand data, assisted by clear metadata such as statistical definitions and methods;
Accessibility: data can be readily located and accessed in multiple dissemination formats, with supported metadata and guidance.
However, ensuring data quality is a difficult and time-consuming task, particularly when organizations collect information from various sources (O’Donnell et al. Citation2014). Then, we have designed a Checking tool, an online and collaborative component that enables the Distributor Authority actor to organize and take part in the process of monitoring and improving the quality of datasets.
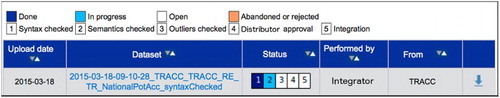
The quality checking, performed through the Checking tool, consists of several manual and automatic checks, resulting in a semi-automatic process. The verification steps are adjustable depending on the dataset type. Indeed, several dataset types may be defined within STeDI to adapt to different Data Distributor Authorities needs. For instance, some dataset types may require all the metadata fields defined in the STeDI model to be filled in order to answer high quality requirements of the Data Distributor Authorities; while other dataset types may be more permissive with the specifications and allow some metadata fields not to be fulfilled. This can be the case when the Data Distributor Authorities wish to collect data that do not necessarily comply with the INSPIRE specification, for instance. Such datasets, more permissive regarding metadata, may not need a Semantic Checking to be performed. Here, we comply with the first quality criteria, which is Relevance or Utility of data. The Distributor Authority can also resort, to Experts of her choice (e.g. statistician, historian, specialist of metadata), who will interact through the Checking tool to check the delivered datasets. This way, the Data Producer, the Experts and the Distributor Authority all together can monitor the dataset progression from the Checking tool dashboard. One instantiation of this dashboard is shown on . It presents datasets audit process in four steps (the last step ‘5 – Integration’ shown on is not part of the dataset audit, it is an automatic final step that consists in the integration of data and metadata into the system database.)
The verification steps automatically come one after the other and the identified stakeholders are automatically notified by email of actions performed on datasets. We describe hereunder the four steps of this quality process shown in and . The first step is entirely automatic, while human actors are involved in the other checking steps:
The Syntactic Checking ( and , Step 1) is performed by a software component, called Dataset Check, that automatically checks, at the time of the dataset upload, the dataset ‘syntax’, which means – by analogy with the syntactic organization of the words in a sentence – that the component checks the arrangement of data and metadata of the supplied dataset, ensures all the mandatory fields are filled and verifies that the field content is of the expected type (e.g. number). At the end of the automatic checking, a report is generated. It includes all the logs of the detected errors. Then, error messages help the Data Producer at improving the dataset compliance with the STeDI model. Afterward, the Producer submits the corrected dataset again, and so on until it returns no error. Hence, datasets entering the quality checking process performed by Experts are harmonized: they have the same format and contain a common set of metadata.
Then, the Semantic Checking ( and , Step 2) is performed by one or some Experts in statistical metadata who check the consistency of descriptions in free text fields. For instance, in the case of estimated statistical data (e.g. dataset simulating a scenario for a territory, in 2050), experts in statistical metadata verify the quality of methodology descriptions, so that, later, a User can assess the plausibility of scenarios simulated in datasets thanks to this accurate description of the methodology used. Here, we comply with the third quality criteria ‘Interpretability and Clarity’.
Expert analyses lead to reports filled and available within the Checking tool dashboard. The file format of the reports is left free to the authors (e.g. PDF, text file). Those reports are key reference documents for quality assessment (Bergdahl et al. Citation2007) and they are available for reading to all the Checking tool actors. The Data Producer is invited by email to consult these reports. Those reports contain recommendations. For instance, the Expert asks the Data Producer to ensure the reproducibility of the typologies, to provide the input indicators used to calculate the typologies and precise the methodology. Then, the Data Producer decides to submit (or not) a new version of the dataset that improves the previous one. If she (or he) decides not to modify her dataset, she explains why through a message addressed to the Experts and to the Data Distributor Authority.
The Outlier Checking ( and , Step 3), conducted by a statistician Expert, consists in verifying data by detecting the outlier values in the dataset. This check is done via some R programs that performed semi-automated tests on data (e.g. statistical analysis technics such as spatial, aspatial statistical tests, data distribution, missing values). Those tests vary depending on the data type (e.g. typology, stock, ratio). Spatial tests for outliers, like Local Moran’s I test, makes possible the measure of the global spatial autocorrelation in the data under test: negative value of the Local Moran’s I indicates that the value of the indicator for this zone is different from those of its immediate neighbours, suggesting the presence of an outlier value (Charlton, Harris, and Caimo Citation2012). Here, we comply with the second quality criteria ‘Accuracy and Reliability’.
The Distributor Approval is the final validation step ( and , Step 4), performed by the Data Distributor who finally authorizes or not the integration of datasets into the STeDI database ( and , Step 5). This is performed thanks to a component presented hereunder.
Figure 13. Example of a Quality Process organized via the Checking Tool.

Figure 14. One instantiation of the Checking tool dashboard (ESPON instantiation).
4.2.2.2. Components dedicated to data storage and restitution
In STeDI, a relational database handles territorial nomenclatures and datasets storage. The STeDI model has been implemented in the PostgreSQL-PostGIS Database Management System.
The SUNI tool achieves the integration of any new territorial nomenclature into the database (, Step 1). During the integration process, all the elements of the nomenclature are recorded into the database. In Telechev and Le Rubrus (Citation2013), colleagues from our research team have specified the elements a nomenclature must provide in order to describe a territory:
Metadata that help in uniquely identifying the nomenclature (e.g. name, acronym, version, validity period, previous version, contact) and provide a description of the statistical, historical or societal context behind this territorial representation. Later the User may query and access to such contextual information;
The territorial units of the nomenclature (e.g. code, name, geometry);
The changes that affect the territorial units, compared to the previous version of the nomenclature (see ).
Once nomenclatures have been described and integrated into the database, the system is able to record datasets that rely on these nomenclatures.
The Dataset Integrator component (, Step 4) is responsible for the integration of new TSI datasets. It browses all the sub-elements of the dataset (e.g. dataset metadata, indicators metadata, indicator values on territorial units) and stores them in the appropriate tables of the database. Then, datasets are dislocated into the system. This, in turn, enables high flexibility regarding the queries addressed to the system, through the Search tool (, Step 6).
Then, the Dataset Eraser offers the service of dataset deletion (, Step 8). Thus, thanks to the integration and deletion tools, data update can be performed. An obsolete dataset version can easily be removed from the system database. As a result, the dataset is unavailable for download by Users. However, each deleted version of a dataset is stored in the system back-office. Then, the Data Producer can upload a new version of the dataset from the Checking Tool dashboard and he/she can link the new version to the previous one, stored in the system back-office. Thus, Data Producer, Experts and Distributor Authority can access all versions of datasets from the Checking Tool dashboard. However, Users can only access the latest version of the datasets from the Search tool Graphical User Interfaces (GUIs).
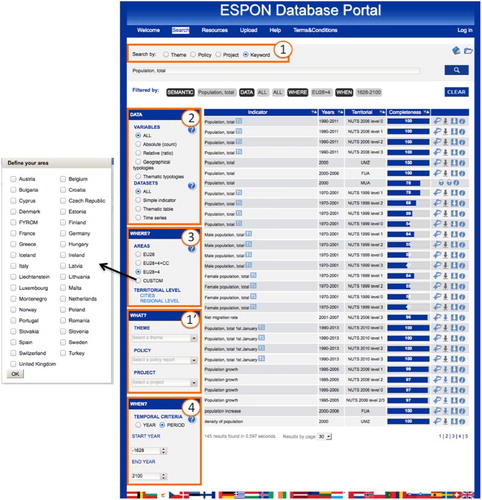
Several ways to query data are available, in order to provide Users with a wide range of data access. Then, here, we comply with the last quality criteria: ‘Accessibility’. An advanced Search tool is accessible from the Web Application of the system (, Step 6). It allows Users to search for data, filtering according to multiple criteria derived from datasets metadata. The User can formulate a request using any combination of the following search filters through the Search tool interface (see ):
The What filter (, Box 1) allows selecting a semantic search criterion (e.g. keywords, themes).
The Data filter (, Box 2) allows filtering the indicators by their nature type (e.g. count, ratio, time-series).
The Where filter (, Box 3) allows selecting a specific study area (e.g. a country) or a specific territorial nomenclature (i.e. NUTS level, UMZ, FUA, MUA and version of those nomenclatures).
Through the When filter (, Box 4), the User can look for data measured at a specific time period or date.
Figure 15. ESPON Database Key Indicator search GUI.
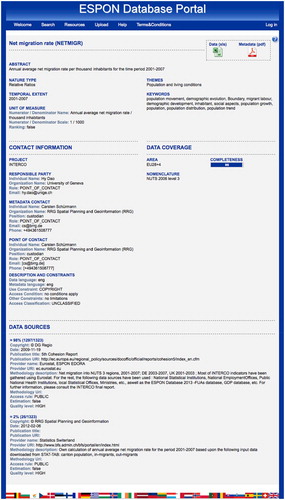
On the server side, the Data Access component processes the request by addressing the database. Then, it returns data and metadata in the requested format to the Search tool. Such a granular query process is made possible thanks to the richness of the metadata schema and to the high level of disaggregation (from one dataset to one value of indicator for one territorial unit at one given period for one version of a nomenclature) performed by the database schema. Then, for each indicator returned by the system after the search query, the user can also consult a metadata page (see ) for more information. Also, the user can download the results of the search query, in an Excel® spreadsheet, built on the fly by assembling values and metadata into a new dataset (M4D Citation2015).
Figure 16. ESPON Database metadata page.
Data and metadata are also disseminated via Web services. Indeed, the Dataset WS Publisher component (see , Step 6), in accordance with the INSPIRE directive and in order to ensure the STeDI interoperability, publishes three OGC services (recognized as GIS standards): the Catalogue Service for the Web (CSW) allows the discovery of data thanks to their metadata (OGC Citation2007); the Web Feature Service (WFS) allows the access to data (OGC Citation2005); the Web Map Service (WMS) enables the data visualization (OGC Citation2006). This component relies on the GeoServerFootnote13 free and open source software. The Web services disseminate data and metadata in various forms (image or text file) and formats (e.g. PNG, PDF, JPEG, GeoJSON, CSV, Shapefile). For example, the CSW returns metadata in agreement with standards such as Dublin Core or ISO-19115. The shows a response sent by the STeDI CSW after a request that asked for one record of the CSW (i.e. getRecordById request). Within STeDI, each CSW record targets one indicator, at a given time and territorial level. The response, encoded in GMD, which is an XML Schema derived from ISO-19115,Footnote14 describes the targeted indicator thanks to metadata and offers a way to access its data through a WFS link (see , line 13). In this case, the CSW record targets the indicator abstract Total population, both sexes (see , line 44) and it describes the indicator through metadata such as the geographic bounding box of the study area (see , lines 34–39) or keywords (see , lines 48–58).
Figure 17. STeDI CSW response to the getRecordById request.
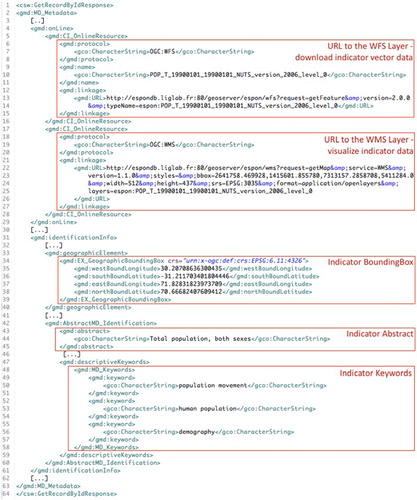
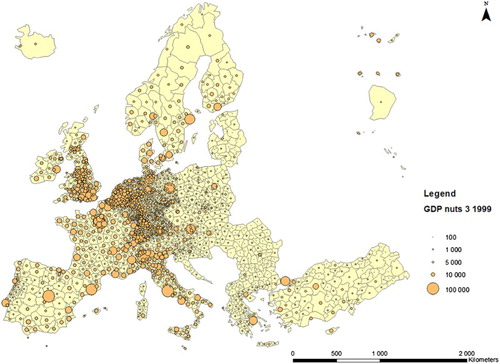
Then, the indicator values and the geometry of the territorial units where the values were measured may be downloaded through the WFS layer (pointed out by the link , line 13) and loaded from many client software (e.g. ArcGIS, QGIS or web-mapping clients Open Layers, Leaflet) that can read data in standard formats such as GML, CSV, GeoJSON, KML or Shapefile. For example, the displays the indicator Growth Domestic Product loaded from the ArcGIS client by connecting one layer of the STeDI WFS.
Figure 18. Map created from the ArcGIS client by connecting the STeDI WFS.
We made the choice of OGC services to adapt to practices of GIS specialists, familiar with these Web services. Indeed, this is most of the time these stakeholders who are asked to create maps from statistical data to allow policy-makers to analyse some territory. Web services provide STeDI with a gateway enabling other systems to disseminate STeDI data in turn. Thus, they enable the data flow from one SDI to another and improve visibility of data on the Web. To conclude, each dataset is downloadable (and reusable) as a tabular file from the Search tool. Also, Web services provide access to data and metadata from any OGC compliant tools.
5. STeDI: a generic SDI configurable to meet the needs of organizations
5.1. A scalable and generic SDI
The component architecture allows STeDI to be adapted to new needs. New components can be developed (with the help of the STeDI Java libraries common to all the components) and be integrated in the infrastructure to answer new objectives (e.g. new component dedicated to the visualization of statistical data through charts). Interaction between new components and existing ones is facilitated as they all share common STeDI core Java libraries. In addition, the STeDI system was built while ensuring the scalability of its components. For example, the Checking tool (see Section 4.2.2.1) can be setup at the time of its instantiation to be adapted to a quality process that evolves (e.g. additional verification steps can be added). In this case, a software developer would have to instantiate the main configurable Java classes we propose. Furthermore, the data model, implemented within the relational database, enables the integration of any new territorial nomenclatures. Indeed, the tool SUNI (see Section 4.2.2.2) can automatically integrate any territorial nomenclature provided that it complies with the specifications established (Telechev and Le Rubrus Citation2013). Then, STeDI may operate all territories (past, present and future) and their geographic objects, which ensures sustainability to the infrastructure.
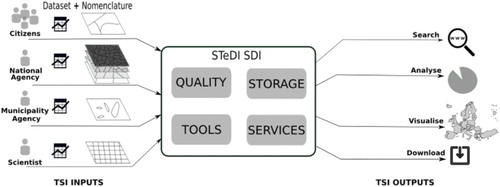
STeDI is configurable to manage any TSI, regarding any territory, at any time and according to various quality controls. Then, the STeDI instances can meet very different needs, in various domains. Data Producers and datasets delivered to STeDI may be very diverse, as illustrated by . For example, Data Producers may be citizens, scientists, national or municipality Agency. Datasets delivered may describe urban areas, regions at different territorial levels or elements of a geographic grid. Then, STeDI offers a common way to access all these different kinds of TSI (i.e. the search, analyse, visualize and download operations are common to all TSI).
Figure 19. Heterogeneity of TSI processed by STeDI.
The STeDI components are like skeletons or abstract classes. They can be customized for the needs of Data Distributors. To illustrate, based on this framework, an implementation adapted to the needs of the European applied research programme ESPON 2013 (European Observation Network, Territorial Development and Cohesion) has been created. This STeDI instance, called ESPON Database, is presented below.
5.2. STeDI instantiation under the ESPON programme
The European Commission enacted the ESPON 2013 European Programme in November 2007. This programme brings together several Transnational Project Groups (TPGs) producing statistical analysis of the European territory. The statistical analyses of TPGs cover various research domains to support the policy-making in the field of development and territorial cohesion. ESPON statistics are decision support to the European policy-makers.
As part of this programme, the Multi-Dimensional Database Design and Development (M4D)Footnote15 consortium (we belong to) is responsible for the collection, harmonization and dissemination through the Web of TSI datasets produced by the TPGs (M4D Citation2015). Data shall be accessible through a search GUIs intended for an audience of researchers and policy-makers. TPG datasets present innovative indicators based on proven methods (e.g. typologies, scenarios). They are complex datasets (combining multiple data sources) covering the whole European territory at different levels (e.g. macro regions, regions, cities). Moreover, they are based on different territorial nomenclatures and versions of those nomenclatures. In order to manage the dataflow – from acquisition to retrieval – of those heterogeneous datasets, the M4D project build an instance of STeDI, named ESPON Database. The portal to access the ESPON Database is available from the URL http://database.espon.eu.
Within the ESPON Database, TPGs act as Data Producers and the ESPON Coordination UnitFootnote16 acts as the Data Distributor Authority. The ESPON Database processes three types of datasets called Key Indicator, Case Study and Background Data (M4D Citation2015). Then, the STeDI components are implemented three times to perform each of them as they differ in some aspects. For example, three instances of the Checking tool are setup as the assessment process varies from one dataset type to another (e.g. Experts involved and checking steps differ).
Also, three search GUIs are designed according to these three dataset types. They allows users to search for datasets and they answer different user profiles such as a scientist, who wishes to filter data according to advanced search criteria (e.g. nature of indicators) and a policy-maker, who wishes to query data according to a theme or a keyword. Regarding the Key Indicator datasets, the search GUI () allows policy-makers to quickly find indicators about a theme expressed through a keyword (see , Box 1) describing their region (e.g. by selecting their country on the popup opened by clicking on option ‘custom’, see , Box 3). Scientists can search for data using more advanced search criteria (see , Box 2). For a complete description of the GUI please refer to M4D (Citation2015).
The search engine returns all the indicators that match the search criteria. Three download options are available: (1) the user can download the full dataset the indicator belongs to (tabular file); (2) the user can download the indicator data and metadata that match her query (a tabular file is build from the database); and (3) she can open the metadata page describing the indicator (see ).
The metadata page contains metadata regarding the indicator identity: its code, title, abstract and keywords for instance. This metadata page can be downloaded as a PDF file.
This implementation of STeDI, called the ESPON Database, demonstrates the reusability of STeDI components and the way our SDI can be used in real context. By connecting the ESPON Database, the M4D project has also created an OnLine Analytical Processing cube from data (M4D Citation2015). The Checking tool instantiated within the ESPON Database makes it possible to monitor more than a hundred datasets and more than 800 indicators. Four NUTS versions are available in the database as well as three urban nomenclatures.
6. Conclusion and future works
Many private or public organizations cope with TSI management issues: from the collection of datasets, often heterogeneous, to their restitution, in a standard form, conducive to data analysis. Thus, emerges the need for software tools automating the management while facilitating sharing of this complex information. In light of these observations, we have developed STeDI, a SDI, which aims at facilitating the collection, assessment, storage and dissemination of TSI. STeDI has been presented in this paper and we have also described how it has been instantiated in the real context of the ESPON Programme.
Similarly to the Digital Earth, STeDI has been motivated by the intuition that complex scientific questions cannot be answered from within one domain alone (Janowicz and Hitzler Citation2012). This is especially true in the field of TSI where policy-makers need prospective scenario that span over multiple disciplines from earth sciences to economics and social sciences. STeDI meets the Digital Earth challenge of a service infrastructure for multi-thematic and heterogeneous data while maintaining the variety brought in by different scientific domains. Indeed, STeDI facilitates the on-line acquisition of heterogeneous TSI datasets, together with their metadata, while enabling authoritative organizations to ensure high levels of harmonization and quality in these datasets. A collaborative Web platform orchestrates a semi-automatic quality check process, assisted by experts. Via the platform, actors interact and exchange reports on quality. These reports contain results and comments on tests performed, such as spatial tests to detect outliers values, achieved via R programs. Then, STeDI facilitates the dissemination of data through the publication of OGC services, which ensure the system interoperability and the cartographic representations of data from various software clients.
Beyond the software components, at the very heart of STeDI lies the data model that provides the components with a formal representation of spatio-temporal evolutive data. This model is innovative for it links statistical, spatial and temporal elements to describe and monitor territories evolution. It complies with the INSPIRE specifications and it is based on two key standards that are the ISO-19115 and the ISO-SDMX. It enables comprehensive representation of TSI. Hence, via this data model, we stress the importance of metadata that help understanding, analysing, comparing and assessing data reliability. They improve data classification and search thanks to metadata such as keywords, study area and time extent.
Compliance with standards and modular design are a guarantee and a key asset of the infrastructure scalability, since the architecture can be modified to remain usable despite users’ practices and supports (e.g. data, nomenclatures) that evolve. Moreover, STeDI, thanks to its generic nature, is transferable to many domains whatever is the time period or the territory described.
Finally, our current work consists in the use of Resource Description Framework (RDF) graph model embedded in the Semantic technologies, to allow indexing and improving the accessibility of TSI through the Linked Open Data Cloud. A new component will integrate the SDI in order to store and disseminate RDF triples (SDWWG Citation2016) described through the RDF Data CubeFootnote17 ontology, among others.
Acknowledgements
Camille Bernard, Jérôme Gensel, Timothée Giraud, Claude Grasland, Nicolas Lambert, Benoit Le Rubrus, Clément Louis, Christine Plumejeaud, Laurent Poulenard, Isabelle Salmon, Anton Telechev, Cassia Trojahn Dos Santos, Marlène Villanova-Oliver and Ronan Ysebaert contributed to the Design and Development of this study.
Disclosure statement
No potential conflict of interest was reported by the authors.
Additional information
Funding
Notes
1. http://ec.europa.eu/eurostat/web/nuts/overview (Accessed 22 February 2016, as well as all websites mentioned in this paper.)
2. ‘Fuas are defined as groupings of existing administrative areas (often LAU2 units)’. http://ec.europa.eu/eurostat/statistics-explained/index.php/Glossary:Metro_regions
3. Statistical data and metadata exchange http://www.iso.org/iso/catalogue_detail.htm?csnumber=52500
11. http://sdmx.org/
References
- Bergdahl, Mats, Ehling Manfred, Elvers Eva, Földesi Erika, Körner Thomas, Kron Andrea, Lohauß Peter, et al. 2007. Handbook on Data Quality Assessment Methods and Tools. Eurostat Technical Report.
- Brackstone, Gordon. 1999. “Managing Data Quality in a Statistical Agency.” Survey Methodology 25: 139–149.
- Brentjens, Thijs, and Michel Grothe. 2013. Joining Tabular and Geographic Data – Merits and Possibilities of the Table Joining Service. Geonovum Report.
- Charlton, Martin, Paul Harris, and Alberto Caimo. 2012. Detecting and Handling Anomalous Data in M4D. Technical Report ESPON 2013 Program. Accessed August 13, 2016. https://www.espon.eu/export/sites/default/Documents/Projects/ScientificPlatform/ESPONDatabaseII/revised_First-Interim-Report/TR_Outliers_june2012.pdf.
- Craglia, Max, Kees de Bie, Davina Jackson, Martino Pesaresi, Gábor Remetey-Fülöpp, Changlin Wang, Alessandro Annoni, et al. 2012. “Digital Earth 2020: Towards the Vision for the Next Decade.” International Journal of Digital Earth 5 (1): 4–21. doi:10.1080/17538947.2011.638500.
- Craglia, Max, and M. Campagna. 2009. Advanced Regional Spatial Data Infrastructures in Europe. Luxembourg: Office for Official Publications of the European Communities. https://www.researchgate.net/profile/Michele_Campagna/publication/267703755_Advanced_Regional_Spatial_Data_Infrastructures_in_Europe/links/54abb1630cf25c4c472f8884.pdf.
- Do, Ba-Lam, Peb Ruswono Aryan, Tuan-Dat Trinh, Peter Wetz, Elmar Kiesling, and A. Min Tjoa. 2015. “Toward a Framework for Statistical Data Integration.” In Proceedings of the 3rd International Workshop on Semantic Statistics Co-Located with 14th International Semantic Web Conference (ISWC 2015). CEUR-WS. http://semstats.github.io/2015/content/toward-a-framework-for-statistical-data-integration/article.pdf.
- European Commission. 2007. Establishing an Infrastructure for Spatial Information in the European Community (INSPIRE). Directive 2007/2/EC of the European Parliament and of the Council of 14 March 2007.
- European Commission, Eurostat. 2015. ESS Handbook for Quality Reports. Luxembourg Publications Office. http://dx.publications.europa.eu/10.2785/983454
- European Council. 2008. “ Official Journal of the European Union L326 – COMMISSION REGULATION (EC) No 1205/2008” of 3 December 2008 implementing Directive 2007/2/EC of the European Parliament and of the Council as Regards Metadata.
- European Joint Research Centre (JRC). 2007. INSPIRE Metadata Implementing Rules: Technical Guidelines Based on EN ISO 19115 and EN ISO 19119. Technical Report.
- European Joint Research Centre (JRC). 2013a. D2.8.III.1 INSPIRE Data Specification on Statistical Units – Technical Guidelines. Technical Report.
- European Joint Research Centre (JRC). 2013b. D2.8.III.10 INSPIRE Data Specification on Population Distribution – Technical Guidelines. Technical Report.
- Flowerdew, Robin, and Mick Green. 1989. “Statistical Methods for Inference Between Incompatible Zonal Systems.” In The Accuracy of Spatial Data Bases, edited by Michael Goodchild and Sucharlta Gopal, 239–247. London: Taylor & Francis.
- Gallego, Francisco Javier. 2010. “A Population Density Grid of the European Union.” Population and Environment 31 (6): 460–473. doi:10.1007/s11111-010-0108-y.
- Gore, Al. 1998. “The Digital Earth: Understanding Our Planet in the 21st Century.” Australian Surveyor 43 (2): 89–91. doi: 10.1080/00050348.1998.10558728
- Gottmann, Jean. 1975. “The Evolution of the Concept of Territory.” Social Science Information 14 (3): 29–47. doi:10.1177/053901847501400302.
- Gotzfried, August, and Marco Pellegrino. 2008. “The Euro-SDMX metadata structure and quality indicators.” Conference on Data Quality for International Organizations, Rome, Italy, July 7 and 8. http://unstats.un.org/unsd/accsub/2008docs-CDQIO/Ses1-Pap4.pdf.
- Grus, L., J. Crompvoets, and A. K. Bregt. 2010. “Spatial Data Infrastructures as Complex Adaptive Systems.” International Journal of Geographical Information Science 24 (3): 439–463. doi:10.1080/13658810802687319.
- Hendriks, Paul H.J., Ezra Dessers, and Geert van Hootegem. 2012. “Reconsidering the Definition of a Spatial Data Infrastructure.” International Journal of Geographical Information Science 26 (8): 1479–1494. doi:10.1080/13658816.2011.639301.
- Janowicz, Krzysztof, and Pascal Hitzler. 2012. “The Digital Earth as Knowledge Engine.” Semantic Web 3 (3): 213–221.
- M4D. 2014. “ESPON 2013 Database Dictionary of Spatial Units.” ESPON Database Portal, December 19. http://database.espon.eu/db2/dico?idDoc=66
- M4D. 2015. “M4D Final Report.” ESPON, January. http://www.espon.eu/export/sites/default/Documents/Projects/ScientificPlatform/ESPONDatabaseII/M4D_FinalReport_MainReport
- Madnick, Stuart, and Hongwei Zhu. 2006. “Improving Data Quality through Effective Use of Data Semantics.” Data & Knowledge Engineering 59 (2): 460–475. doi:10.1016/j.datak.2005.10.001.
- Nash, J. C. 2006. “Spreadsheets in Statistical Practice – Another Look.” The American Statistician 60 (3): 287–289. doi:10.1198/000313006X126585.
- Nebert, Douglas D. 2004. “Developing Spatial Data Infrastructures: The SDI Cookbook.” Version 2.0. Global Spatial Data Infrastructure, Technical Committee. ftp://181.118.144.33/DAPA/planificacion/GEOMATICA/SIG/Anexos_SIG/cookbookV2.0.pdf.
- O’Donnell, Michael S., Timothy J. Assal, Patrick J. Anderson, and Zachary H. Bowen. 2014. “Geospatial Considerations for a Multiorganizational, Landscape-Scale Program.” Journal of Map & Geography Libraries 10 (1): 62–99. doi:10.1080/15420353.2014.885925.
- OECD. 2002. Main Economic Indicators: Comparative Methodological Analysis: Wage Related Statistics Volume 2002 Supplement 3. Vol. 2002. OECD Publishing.
- OGC (OpenGIS Catalogue Service). 2005. “OpenGIS Web Feature Service (WFS) Implementation Specification.” Version 1.1.0. Document 04-094. http://docs.opengeospatial.org/is/09-025r2/09-025r2.html.
- OGC (OpenGIS Catalogue Service). 2006. “OpenGIS Web Map Service (WMS) Implementation Specification.” Version 1.3.0. Document 06-042. http://portal.opengeospatial.org/files/?artifact_id=14416.
- OGC (OpenGIS Catalogue Service). 2007. “OpenGIS Catalogue Service Implementation Specification.” Version 2.0.2. Document 07-006r1. http://portal.opengeospatial.org/files/?artifact_id=20555.
- Plumejeaud, Christine. 2011. “Modèles et méthodes pour l’information spatio-temporelle évolutive.” PhD diss., University of Grenoble Alpes (in French).
- SDMX. 2012. “SDMX2.1 User Guide”. SDMX, September 19. https://sdmx.org/wp-content/uploads/SDMX_2-1_User_Guide_draft_0-1.pdf.
- SDWWG (Spatial Data on the Web Working Group). 2016. “Spatial Data on the Web Best Practices” (Draft document). SDWWG, March 2. http://w3c.github.io/sdw/bp/.
- Statistical Services Centre – The University of Reading. 2003. “Disciplined Use of Spreadsheets for Data Entry.” 2016. http://www.reading.ac.uk/ssc/resource-packs/ILRI_2006-Nov/GoodStatisticalPractice/publications/guides/topsde.html.
- Sundgren, Bo. 2001 . “Documentation and Quality in Official Statistics.” EU Conference on Quality in Statistics, Stockholm, Sweden. https://www.researchgate.net/profile/Bo_Sundgren/publication/267862808_Documentation_and_Quality_in_Official_Statistics/links/55a55f8d08ae81aec91352f2.pdf.
- Szyperski, Clemens. 2002. Component Software: Beyond Object-Oriented Programming. 2nd ed. Boston, MA: Addison-Wesley Longman.
- Telechev, Anton, and Benoit Le Rubrus. 2013. “Nomenclatures Support”. ESPON Database Portal, December 19. Technical Report ESPON 2013 Program. http://database.espon.eu/db2/jsf/NomenclatureSupport/NomenclatureSupport_onehtml/index.html.
- USCB (United States Census Bureau). 2013. “Statistical Quality Standards”. USCB, July. http://www.census.gov/content/dam/Census/about/about-the-bureau/policies_and_notices/quality/statistical-quality-standards/Quality_Standards.pdf.
- WHO (World Health Organization). 2013. “Strengthening Civil Registration and Vital Statistics for Births, Deaths and Causes of Death: Resource Kit”. WHO. Accessed March 15, 2016. http://apps.who.int/iris/handle/10665/78917.