
ABSTRACT
Data covering the whole of the surface of the Earth in a homogeneous and reliable manner has been accumulating over many years. This type of data became available from meteorological satellites from the 1960s and from Earth-observing satellites at a small scale from the early 1970s but has gradually accumulated at larger scales up to the present day when we now have data covering many environmental themes at large scales. These data have been used to generate information which is presented in the form of global data sets. This paper will give a brief introduction to the development of Earth observation and to the organisations and sensors which collect data and produce global geospatial data sets. Means of accessing global data sets will set out the types of data available that will be covered. Digital elevation models are discussed in a separate section because of their importance in georeferencing image data as well as their application to analysis of thematic data. The paper will also examine issues of availability, accuracy, validation and reliability and will look at future challenges.
1. Introduction
There is now a vast amount of data from Earth-observation (EO) satellites that can provide valuable information on the current condition of the surface of the Earth, activities on the surface and of the changes which have occurred since civilian EO started in the 1970s. In order to understand Earth system processes, the data need to be timely, complete and thematically and geometrically correct (Suresh Citation2012). The key types of information collected are topography, land cover and land use, but themes such as population distribution, pollution and climate are equally important (UN-GGIM Citation2013), as well as data relating to the oceans and the atmosphere. Time series for monitoring change and determining patterns of activity are very valuable but these should lead to modelling which is essential to predict future trends. All of this contributes to the understanding of Earth processes and is necessary to tackle the effects of changes of physical processes such as climate change and anthropomorphic change.
The range of applications of EO data has been well defined by the Group on Earth Observation (GEO) (https://www.earthobservations.org) which has set out nine societal benefit areas for which data are required: disasters, health, energy, climate, agriculture, ecosystems, biodiversity, water and weather.
EO data are frequently used with complementary data sources such as statistical and social science data. An important class of data to supplement EO data is provided from voluntary geographic information, such as OpenStreetMap, that is, collected from many sources, but often providing valuable local information, aimed at the local community, but used also by the science community.
Some global data sets have been processed and validated and can be used with confidence; however the quality of the rest is not well determined and should be used with caution. This paper sets out to review the data available and to discuss the issues involved in using it. This review is a contribution to the Future Earth project which is a major international research platform; Future Earth has the objective of coordinating an interdisciplinary approach to research on global environmental change. In order to advance research in this area, reliable global-scale data is essential and EO is a key method of acquiring global geospatial data. Section 2 of the paper gives a brief history of EO and describes the sensors used for collecting data for global data sets and the organisations which collect and process data. Section 3 looks at thematic data sets which are distinct from digital elevation models (DEMs) which are covered in Section 4. DEMs are essential for correcting distortions in satellite imagery and show good techniques for validation; they are also essential to supplement thematic data. Section 5 discusses some of the issues related to the collection and use of global data sets including reliability, validation and presentation, and Section 6 looks at future challenges.
There are a vast number of global geospatial data sets and this review is not intended to be comprehensive, but will cover the major themes and issues associated with the data sets.
2. Development of EO
2.1. Space agencies
The initial development of EO was initiated by the government. The first nation to develop an EO programme for civilian use was the USA, which started the Landsat programme in 1972. The USA was followed by Europe and Japan. India and China are also generating large volumes of EO data, but these data are less accessible and have not been used extensively for open access global data sets. The bulk of data from global data sets has come from the programmes of these countries. A selection of these is shown in ; the sensors listed are discussed in Section 2.2.
Table 1. Principle space agencies with missions collecting data for global data sets.
The Landsat series of satellites was initially with a ground sample distance (GSD) of 80 m and revisit time of 18 days. In 1982, this increased to 28 m with a temporal revisit time of 16 days. This 44-year series of data from Landsat data has been processed to generate global data sets which are homogeneous and validated and can be regarded as the gold standard of global data sets. In 2016, there are many other sensors from space agencies and commercial companies collecting data at a variety of temporal, spatial and spectral scales and being used for a multitude of applications with various levels of accuracy and reliability. When Landsat 1 was launched in 1972, the USA was the only country operating an EO sensor which was widely available, whereas now there are 59 agencies operating active EO satellites as well as a number of commercial businesses.
2.2. Sensors
There are many sensors used to collect data for global data sets, these cover the land, the oceans and the atmosphere. The resolution varies according to the application, from around 15 m to greater than 1000 m, and covers spectral bands from visible to microwave. Some of the most important sensors for collecting data for global applications are listed in .
Table 2. Examples of sensors used to collect data for global data sets.
The Committee on Earth Observation Satellites (CEOS) has a mission to ensure international coordination of civil space-based EO programmes and promotes exchange of data to optimise societal benefit and inform decision-making for securing a prosperous and sustainable future for humankind and represents 59 agencies operating 134 satellites. These are shown in the CEOS handbook that provides a comprehensive database of agencies, missions and instruments (CEOS Citation2016). This is an indicator of the vast volume of data which is being collected, in addition to the archive of data already collected. Another useful database is the UCS Satellite Database (Citation2016).
2.3. Commercial developments
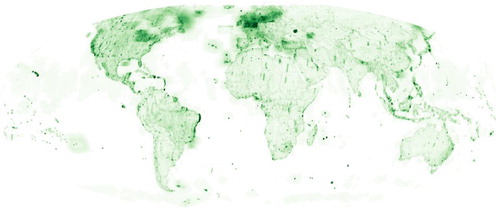
Data are also collected by commercial organisations. Most of these data are at high resolution, typically with a GSD of less than 5 m. This means that each scene collected is only a few square kilometres and global coverage not only takes a long time to collect, and it is also not a commercial proposition. shows the location and frequency of commercial acquisitions in 2015, this amounted to 1.5 million scenes, from more than 22 satellites (Geocento Citation2016). The darker areas indicate areas of high-density sampling; these are areas with a high commercial value such as busy maritime regions and areas of conflict, for example east Ukraine.
Figure 1. Frequency of commercial acquisitions in 2015 (Geocento Citation2016).
There are now a number of commercial organisations which operate satellite, and data from these sensors are used to generate global data sets. Airbus Defence and Space generates and sells products derived from Pléiades, TerraSAR and the DMC Constellation. Pléiades was initiated by CNES, but is now operated by Airbus. TerraSAR was developed by DLR in collaboration with Airbus. The DMC data collected from satellites developed by Surrey Satellite Technology Ltd. are offered with cross-calibrated satellites and seamless compatibility with Landsat. Airbus also offers WorldDEMTM which provides high-accuracy digital surface models (DSMs) and terrain models of 2 m (relative), and 4 m (absolute) vertical accuracy, in a 12 m × 12 m raster. However these data are not free. Another major commercial operator is DigitalGlobe which provides processed data in various formats from WorldView 1–3, Ikonos, GeoEye and Quickbird. A company called Vricon generates global DEMs from DigitalGlobe data. Other commercial organisations are Planet (formerly Planet Labs, Campitelli, [https://www.planet.com/pulse/meet-our-new-brand/]) which operates cubesats and the RapidEye constellation of five identical satellites which produce data with 5 m pixel size. The constellation provides rapid access to any area and can generate time series.
The government organisations discussed above are mainly concerned with providing data for scientific work and generally do this without cost; commercial organisations generate products for profit. Organisations such as Google and Microsoft provide global data free of charge. Google Maps for example contains maps and images covering the whole of the land surface of the Earth, but the quality varies and there is no statement of accuracy and there is no indication of whether relief correction has been applied. Google Earth Image data come from a variety of sources including satellite sensors and aerial photography. Microsoft Bing offers similar products to Google and the quality of this data is discussed in Section 5.2.
2.4. Acquiring global data sets
Most of the EO data that has been collected has been processed to generate global data sets which are homogeneous and available free of charge. lists examples of portals where the original data and processed data can be found.
Table 3. Examples of portals serving global data sets.
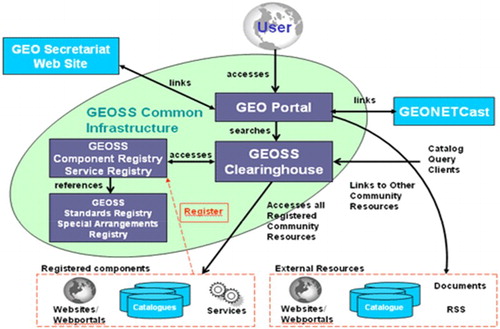
The GEO hosts the GEOSS portal which allows users to access EO data from all over the world. The portal, illustrated in , connects users to existing data sets and portals which have registered with the GEOSS portal and takes an important step towards integration and standardisation.
Figure 2. The GEOSS portal architecture which allows users to connect to existing data sets.
Another website which gives access to global data sets is WorldGrids which hosts 1 km environmental layers in a standardised format and provides functions for processing the data including simple point overlay, multi-point overlay, sub-setting grids, overlaying grids and aggregation.
3. Thematic global data sets
3.1. Principal data sets
A major source of global data is Landsat. NASA, in collaboration with the US Geological Survey (USGS) produces the Global Land Survey (GLS) data sets which are designed to allow scientists and data users which includes scientists involved in many areas including the environment and climate, as well as decision makers and the general public, to have access to a consistent, terrain corrected, coordinated collection of data (USGS Citation2015). Five epochs have been created, each using the primary Landsat sensor in use at the time:
GLS1975: uses Multispectral Scanner (MSS) data
GLS1990: uses Landsat 4–5 Thematic Mapper (TM) data
GLS2000: uses Landsat 7 Enhanced Thematic Mapper Plus (ETM+) data
GLS2005: uses a combination of Landsat TM and ETM+ data
GLS2010: uses a combination of Landsat TM and ETM+ data
The Landsat data incorporated into each GLS data set meets quality standards, and has a resolution of 30 m, except for the data from the MSS which has 80 m resolution. The data are in GeoTiff format and in the Universal Transverse Mercator projection on the WGS84 datum. Landsat data are also processed by other organisations such as the Global Land Cover Facility (GLFC) at the University of Maryland (http://glcf.umd.edu/aboutUs/) GLCF develops and distributes remotely sensed satellite data and products that explain land cover from the local to global scales. Also Landsat GLFC uses data from MODIS, AVHRR and GOES and generates products including Forest change, Albedo, Land cover and NDVI. Another example is the Globeland30, which is a global land cover data set of 30 m resolution (Chen et al. Citation2015), donated by China to the United Nations in 2014.
Global data sets may be generated by the organisations which collect the data, or by their partners, by organisations interested in particular themes, or by other groups. lists a number of organisations that produce or collect global data sets and make them available through websites. Exelis (Citation2016) have produced a paper on sources of geospatial imagery and raster GIS data which lists sources of free downloadable imagery and geospatial data, purchasable satellite imagery, web map servers, online viewers and virtual globe as well as other information on data sources.
Table 4. Organisations processing EO data to create global data sets.
Section 2.4 has listed portals where global data sets may be found. Two of these have the objective of collecting and standardising data sets. The WorldGrids portal provides access to the following layers:
Administrative and socio-economic data (available layers)
Climatic and meteorological images
DEM-derived parameters
Land cover and land use
MODIS products
Urbanisation and lights at night images
Geological and parent material maps
Natural hazards
World forest/wildlife resources
Ecoregions/biodiversity maps
WorldGrids also gives links to information about the data sets which are available.
Global Map is an international initiative to develop digital geographic information at the scale of 1:1 million to help with environmental and sustainable development decision-making. Data are collected from national mapping agencies and processed to a standard format. There are eight data layers. Four layers are vector: transportation, boundaries, drainage and population centres, and four are raster: land cover, land use, vegetation and elevation at 31 cm GSD.
3.2. Validation of thematic data sets
Validation of thematic data sets is a complex issue and varies according to the information required and the resolution of the data. A full review is beyond the scope of this, but the CEOS has a long established working group on calibration and validation and an exhaustive list of publications and information is available from their website http://calvalportal.ceos.org. The recent completion of the Globeland30 land cover data set provides an example of the validation process (Chen et al. Citation2015). In this case, sample areas were selected from locations in different land cover areas throughout the world and field tests were carried out to compare the classified data with the actual area on the ground. In addition, the data were compared with other land cover data sets.
4. Global DEMs
4.1. Uses of DEMs
DEMs are treated separately because besides providing height data, which is itself valuable information that is used to provide information on slope and aspect and which is particularly useful in hydrological analysis and prediction of flood prone areas, DEMs are essential for correcting relief distortion in images and hence to enable generation of georeferenced image data. DEMs can also provide a homogeneous global reference surface. An example of the need for DEMs is demonstrated in the Integrated Global Observing Strategy (IGOS) Geohazards Theme report (IGOS Citation2004) which notes the importance of DEMs for mapping features which may trigger geohazards and for rapid local update needed to show how the landscape has changed. A global DEM allows responders to disasters to obtain the data they need for any location on the globe. Generally, the main focus is on DEMs of the land surface, however with the advent of LIDAR, bathymetric DEMs are also generated and used, for example, for modelling tsunamis.
4.2. Sources of DEMs
Global DEMs have a long history but with a dramatic increase in coverage and accuracy since the use of EO sensors, particularly the Shuttle Radar Terrain Mission (SRTM) in 2000 and then the use of SPOT and ASTER data. shows the evolution of global DEMs.
Table 5. The evolution of global DEMs (compiled from several sources).
Global DEMs have been generated from various sources as shown in , but of particular interest are those generated from image matching of stereoscopic images and from SAR Interferometry such as SRTM. The accuracy depends on many factors as listed by Reuter, Hengl, et al. (Citation2009):
Source: stereo imagery, LIDAR, IfSAR, ground survey, digitisation of maps
Platform: satellite, plane, helicopter, unmanned aerial vehicles
Accuracy of measurement
Type of terrain and land cover
Sampling pattern: irregular, break lines, grid spacing
Method of interpolation and merging process (edge contamination, vertical and horizontal shift corrections, cloud/shadow)
Because of the many factors affecting the quality of DEMs, validation is particularly important. Current global DEMs such as SRTM, ASTER GDEM and WorldDEM are homogeneous and have been validated with clear quality information provided.
4.3. Validation of DEMs
Accuracy of DEMs can be assessed by comparison with other DEMs, comparison with ground control points (GCPs) or profiles and by looking at indicators of consistency such as smoothness of terrain and fitting to river patterns or view sheds (see Reuter, Hengl, et al. Citation2009). The SRTM provides a good example of the validation processes involved (NASA Citation2005). SRTM has been validated using kinematic GPS data processing with an estimated accuracy of less than 50 cm; comparison with higher accuracy DEMs; with Ground Control Points; ocean GCP’s from mean sea surface and tidal model with an accuracy better than 50 cm. summarises the SRTM performance observed by comparing against the available ground truth. All quantities represent 90% errors in meters. It is clear from this table that SRTM met and exceeded its performance requirements (Rodríguez et al. Citation2006).
Table 6. Accuracy of SRTM DEM determined from ground truth. All quantities represent 90% errors in meters.
Global DEMs derived from stereo matching or interferometric SAR give the surface which is imaged by the sensor, which is the top of vegetation or buildings. The DSM is ideal for correcting topographic effects, but if the digital terrain model (DTM), or base Earth model, is required additional processing is needed. Due to limitations in the stereo matching or SAR- processing DEMs have voids which must be filled from other data sources (Delaney, Kuuskivi, and Li Citation2005; Reuter, Nelson, and Jarvis Citation2007).
5. Issues
5.1. Standardisation
It is clear from the above that global data sets from EO are generated from a range of sensors, are processed by many organisations and are available from different sources. This means that the data come with different resolutions and in different formats and so to make optimum use of the data, integration is essential and it follows that standardisation would assist this process. United Nations Global Geospatial Information Management (UN_GGIM) has published a report on future trends in geospatial information management (UN_GGIM Citation2015), which stresses the need for integration and standardisation because of the many sources of data and the increasing use of geospatial data by different government departments. The report notes:
The role of National Spatial Data Infrastructures is more important than ever before. They can provide the means to organise and deliver authoritative core geographies for many national and global challenges including sustainable development. The paradigm of data availability is changing; there is a huge increase in the tracking and availability of real-time data. It is no longer just for mapping and delivery, but for integration, analytics, modelling and aggregation.
Work continues at a global level with international standards. The widespread and effective application of standards in many digital information fields is crucial not only for the continued effective use of internet-based products and services, but also for collaborations between different data organisations.
Similar goals are being pursued with the European INSPIRE initiative (EC Citation2007) which strives to harmonise high-resolution topographic data across the continent. The Open Geospatial Organisation (OGC) also works towards the standardisation of geospatial data. WorldGrids attempts to achieve this by using a standardised format in a reproducible manner, and by providing software which can merge data sets.
The US Group on EOs has developed a set of recommended standards and practices for EO data management. A draft document has been published (US Group on Earth Observations Citation2015) and feedback has been collected. The Common Framework adopts the definition of Earth-observation data used by the 2013 National Strategy for Civil Earth Observations:
[We] use the terms ‘data’ and ‘Earth observations’ interchangeably to mean geo-referenced digital information about Earth, including the observations, metadata, imagery, derived products, data-processing algorithms (including computer source code and its documentation), and forecasts and analyses produced by computer models. Non- digital data, published papers, preserved geological or biological samples, or other media that have not been digitized are not included in this definition …
The document covers Data Search and Discovery Services, Data-Access Services, Data Documentation and Common Formats and Vocabularies, and makes use of the principles of GEO and the standards of OGC. The primary use of the common format is within federal agencies within the USA, but it is hoped that this will be extended to non-federal organisations and the wider community. The document makes no mention of specific reference systems nor projections, but these would effectively be included.
5.2. Accuracy and validation
Data quality has been addressed by many authors, for example Devillers and Goodchild (Citation2009). Accuracy in this context comprises two components: Geometric accuracy and accuracy of content. Measures of accuracy are determined by validation. For global data sets, presented with low resolution, geometric accuracy is often not a major concern, but, for example, position on a land cover data set with 30 m cell size, such as Globeland30, could seriously affect information derived from the data. Hence considerable effort has been made to validate Globeland30 data.
There is also a concern regarding geometric accuracy with Google maps. It requires only a casual inspection to see that the imagery is not always correctly co-registered with the map data, Google claim (Miller, Citation2014) that they spend a lot of effort ensuring accuracy, but this may only involve making sure that the map data fits the imagery. The main effort is made in populated areas and Pulighe, Baiocchi, and Lupia (Citation2015) have given a review of the accuracy of Google Earth data and have made an assessment of accuracy of Google Earth images. Their study in the city of Rome shows positional accuracy of better than 1 m. The imagery used is described as ‘very high resolution’, but the actual source is not given. The paper also acknowledges that the accuracy of Google Earth data varies according to location and that specific information on accuracy is not usually available. In 2014 Google acquired Skybox Imaging, a constellation of maximum 24 cubesats, to improve accuracy. An evaluation of the quality can be found in d’Angelo, Kuschk, and Reinartz (Citation2014).
Microsoft Bing offers similar data to Google, but data sources are not revealed and Wikipedia, the only source discovered which provides information on Bing, states that aerial and Bird’s-Eye images for a particular location can sometimes be several years out-of-date. This is particularly noticeable in locations that have undergone rapid recent development or experienced other dramatic changes since the imagery was taken, such as areas affected by natural disasters.
While major companies such as Airbus and DigitalGlobe take considerable care in validating their data and giving detailed specifications, not all companies do this. For example, Planet claims to reach daily minimum 3–5 m resolution by 2016, but an assessment of the accuracy of this product is still outstanding, Validation is clearly a major requirement and this has already been covered in Sections 3.2 and 4.3. It is essential that the origin of the data, the processing which has been carried out and the validation are stated in metadata associated with the data sets.
One major pitfall is that validation results are reported at the overall level (e.g. per data set) instead of displaying the spatial distribution of the validation results. Often the reported values cannot be reproduced as some closed source data sets are used.
According to USGS (Citation1993) for a 7.5 minute DEM a single value is calculated using the RMSE, which is based on a minimum of 28 points located on 20 interior points and 8 edge points. In contrast to other disciplines, for example, climate change (Moss and Schneider Citation2000) or soil science, (Malone, McBratney, and Minasny Citation2011; Hengl et al. Citation2014) confidence intervals (CIs) are becoming more and more available. A reporting of the upper and lower 95% CI per pixel would be advisable.
Another issue is that the reported values cannot be reproduced as some closed source data sets are used. An example would be the NGA historical ground control points data set as mentioned in Farr et al. (Citation2007).
A second pitfall which needs to be addressed in the future is that the accuracy on all dimensions needs to be reported. For DEMs this implies that horizontal and vertical accuracies are reported (Reuter, Nelson, et al. Citation2009). For DEMs generated from multi-time series, the range of input data needs to be reported. While for the SRTM mission, the time lag consisted only of 11 days (11–22 February 2000) in which the data were recorded, the ASTER GDEM product contains data from several years and uses more than 1.75 million scenes.
A third aspect with respect to validation is the reporting of uncertainties. In other disciplines, for example climate change (Moss and Schneider Citation2000) or soil science (Malone, McBratney, and Minasny Citation2011) CIs are becoming more and more available, global elevation models report one value only. A reporting of the upper and lower 95% CI would be advisable.
5.3. Availability of data
A further issue is whether data is free of charge and available to any user. Many data sets are available free of charge but others, such as the DEMs generated by Airbus Defence and Space, are charged for. GEO has drafted new data-sharing principles (GEO Citation2015a) which state the following:
Data, metadata and products will be shared through GEOSS as Open Data by default, by making them available as part of the GEOSS Data-CORE without charge, without restrictions on reuse, subject to the conditions of registration and attribution when the data are reused.
Where international instruments, national policies or legislation preclude the sharing of data as Open Data, they should be made available through GEOSS with minimal restrictions on use and at no more than the cost of reproduction and distribution.
It has been demonstrated that sharing EO data brings a multitude of environmental and economic benefits. Examples of these are explored in a White Paper prepared for the GEO Plenary by the ICSU Committee on Data for Science and Technology (CODATA), a GEO Participating Organisation (GEO Citation2015b). The report demonstrates that the advantages of open EOs include supporting broad economic benefits and growth, enhancing social welfare, growing research and innovation opportunities, facilitating knowledge sharing among a new generation of scientists and effective governance and policy-making. A promising example is Planet Labs which has offered data to contribute to the UN objectives for sustainable development. One condition for this is that users must make added value products free as well. Planet makes data from California available under an open data licence, but other data and areas are not free.
Some commercial data providers have understood the business case for a spatially or temporally downscaled data set. A generalised data set will be sufficient for a proof of concept/research phase and will trigger commercial business as finer details are required to solve specific problem, for example insurance for flooding, plant growth for farmers. The commercial 5 m ALOS DEM compared to the freely available 30 m ALOS DEM is a good example, while the TerraSAR-X and TanDEM-X public–private-partnership (PPP) between the German Aerospace Centre (DLR) and EADS Astrium, now Airbus Defence and Space, might serve as the opposite example. The interferometric data from TanDEM-X are used to generate WorldDEM™, a seamless global DEMs. The WorldDEM mentioned earlier has been generated from these data and this is marketed by Airbus. Unfortunately, DLR is not allowed to release the 30 m version of the data due to its PPP funding source. DLR have many restrictions on onward distribution that even the release of the 90 m DEM is surrounded by caveats.
5.4. Presentation
The presentation and visualisation of geospatial data have a significant effect on how it is used and by whom. In the context of a sustainable Earth, where decision makers, who may not be able to make optimum use of image-processing software packages, need information, it is necessary that information can be presented in an understandable and easily manipulatable way, so user friendly interfaces are required.
With the ubiquitous use of mobile phones and widespread use of tablets, many people need data on these devices. Google and Bing offer this through apps, but presenting large volumes of complex data on small format-viewing devices presents a big challenge and requires compromises to be made in the richness of the data.
The CEOS working group on Information Systems and Services (WGISS) addresses the best way of presenting EO information and creates and demonstrates prototypes which support CEOS and GEO requirements. WGISS also addresses the internal management of EO data, the creation of information systems and the delivery of interoperable services. WGISS works on the premise that optimum presentation of data and information will encourage greater use of EO information and the activities and expertise of WGISS span the full range of the information life cycle from the requirements and metadata definition for the initial ingestion of satellite data into archives through to the incorporation of derived information into end-user applications.
5. Future challenges
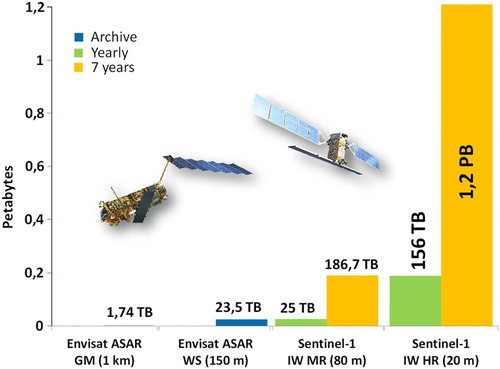
The data being collected by EO satellites are increasing all the time. An example of this is given by Wagner (Citation2015) who showed the step change in data management introduced by sensors like Sentinel is illustrated in . Wagner emphasised the need for cooperation and networking between organisations to maximise the benefits from massive data sources such as Sentinel.
Figure 3. Growth of data volume from ENVISAT ASAR to Sentinel-1 (Wagner Citation2015).
In order to make the best use of the data, automatic interpretation of images is necessary to derive meaningful and high-quality information from these large data sets. Techniques of data mining, pattern recognition and machine learning are required. The International Society for Photogrammetry and Remote Sensing (ISPRS) Vision paper (Chen et al. Citation2016), prepared for the 2016 ISPRS Congress, points at developments in processing and data handling and shows that there is a demand for higher resolution, and for time series, for example Kuenzel, Dech, and Wagner (Citation2015). From a weather-climate-hazards viewpoint, a seamless prediction system should be able to use imagery from recent hours, seasons and decades, from local to global, for all kinds of hazards (McBean Citation2014).
6. Conclusions
Global data sets are widely available from many sources, but in order to make optimum use of these data, standardisation is necessary in order to combine data sets and to share them among the increasing number of users.
Ready to use, freely available data sets should be the first motivation. Moves are being made towards this goal, these include such development such as the GEOSS portal and Worldgrids.org and the need is recognised in reports from UN-GGIM and the US GEOs. In the area of sharing map data, the INSPIRE project in Europe is a prime example of moves towards standardisation and data sharing for policy-making.
There are though still major issues facing the widespread use of global geospatial data sets. These include universal statements of quality and descriptions of the validation carried out, something that can be done by standardised metadata. GEO has done much to encourage open sharing of data, but large quantities of useful data remain locked within organisations that do not wish to release them. On the other hand, work still needs to be done on presentation so that decision makers can understand what is shown from EO data.
We can conclude that EOs has provided scientists, decision makers and the general public with a valuable resource that is easily available and that is being continually updated and improved, however it is always necessary to understand how the data has been produced, the geometric and semantic accuracy and to ensure that the data is fit for purpose.
Disclosure statement
No potential conflict of interest was reported by the authors.
References
- d’Angelo, P., G. Kuschk, and P. Reinartz. 2014. “Evaluation of Skybox Video and Still Image Products.” The International Archives of the Photogrammetry, Remote Sensing and Spatial Information Sciences XL-1: 95–99. doi:10.5194/isprsarchives-XL-1-95-2014.
- CEOS. 2016. “CEOS Handbook.” http://database.eohandbook.com.
- Chen, Jun, Jin Chen, Anping Liao, Xin Cao, Lijun Chen, Xuehong Chen, Chaoying He, et al. 2015. “Global Land Cover Mapping at 30 m Resolution: A POK-Based Operational Approach.” ISPRS Journal of Photogrammetry and Remote Sensing 103 (2015): 7–27. doi: 10.1016/j.isprsjprs.2014.09.002
- Chen, Jun, I. Dowman, Songnian Li, Zhilin Li, M. Madden, J. Mills, N. Paparoditis, et al. 2016. “Information from Imagery: ISPRS Scientific Vision and Research.” ISPRS Journal of Photogrammetry and Remote Sensing 115 (2016): 3–21. doi: 10.1016/j.isprsjprs.2015.09.008
- Delaney, M., T. Kuuskivi, and Xiaopeng Li. 2005. “Evaluation of Different Solutions to Fill Voids in SRTM Elevation Datasets.” PECORA 16 “Global Priorities in Land Remote Sensing”, Sioux Falls, South Dakota, October 23–27, 2005.
- Devillers, Rodolphe, and Helen Goodchild. 2009. Spatial Data Quality: From Process to Decisions. Abington: CRC Press. ISBN 9781439810125 - CAT# K10503.
- EC. 2007. “Directive 2007/2/EC of the European Parliament and of the Council of 14 March 2007 Establishing an Infrastructure for Spatial Information in the European Community (INSPIRE).” ELI. Accessed July 2016. http://data.europa.eu/eli/dir/2007/2/oj.
- Exelis. 2016. “Geospatial_Imagery_Raster_GIS_Data_Sources.” Accessed January 2016. http://www.exelisvis.com/portals/0/pdf/6-14_Geospatial_Imagery_Raster_GIS_Data_Sources.pdf.
- Farr, T., Rosen, P., Caro, E., Crippen, R., Duren, R., Hensley, S., Kobrick, M., et al. 2007. “The Shuttle Radar Topography Mission.” Reviews of Geophysics 45, RG2004/2007, 33.
- GEO. 2015a. “Data Sharing Principles Post-2015.” Accessed January 2016. https://www.earthobservations.org/documents/dswg/Annex%20III%20-%20GEOSS%20Data%20Sharing%20Principles%20Post-2015.pdf.
- GEO. 2015b. “The Value of Open Data Sharing.” Accessed January 2016. http://www.earthobservations.org/documents/geo_xii/GEO-XII_09_The%20Value%20of%20Open%20Data%20Sharing.pdf.
- Geocento. 2016. “Satellite Image Acquisitions in 2015.” Accessed July 2016. http://geocento.com/satellite-images-acquisitions-in-2015/#.VpisxjbHTzJ.
- Hengl, T., J. Mendes de Jesus, R. MacMillan, N. Batjes, G. Heuvelink, E. Ribeiro, A. Samuel-Rosa, et al. 2014. “SoilGrids1 km – Global Soil Information Based on Automated Mapping.” PLoS ONE 9 (8): 1–17. doi:10.1371/journal.pone.0105992.
- IGOS. 2004. “Geohazards Theme report.” Accessed January 2016. https://www.google.com/url?q=http://unesdoc.unesco.org/images/0014/001405/140532eo.pdf&sa=U&ved=0ahUKEwiOy7Dg6fKAhVHvhQKHTFMCS8QFggHMAE&client=internal-udscse&usg=AFQjCNE6WvxRs3DCjgWFTf53ZlxwtynE9w.
- Kuenzel, C., S. Dech, and W. Wagner. 2015. Remote Sensing Time Series – Revealing Land Surface Dynamics. Berlin: Springer.
- Malone, B. P., A. B. McBratney, and B. Minasny. 2011. “Empirical Estimates of Uncertainty for Mapping Continuous Depth Functions of Soil Attributes.” Geoderma 160: 614–626. doi: 10.1016/j.geoderma.2010.11.013
- McBean, G. A. 2014. “The Grand Challenges of Integrated Research on Disaster Risk. Extreme Natural Hazards.” Disaster Risks and Societal Implications 1: 15–26. doi: 10.1017/CBO9781139523905.004
- Miller, G., 2014. “The Huge, Unseen Operation Behind the Accuracy of Google Maps”. Accessed June 2016. http://www.wired.com/2014/12/google-maps-ground-truth/.
- Moss, R. H., and S. H. Schneider. 2000. “Uncertainties in the IPCC TAR: Recommendations to Lead Authors for More Consistent Assessment and Reporting.” In Guidance Papers on the Cross Cutting Issues of the Third Assessment Report of the IPCC, edited by R. Pachauri, T. Taniguchi, and K. C. S. Tanaka, 33–51. Geneva: World Meteorological Organization.
- NASA. 2005. “An Assessment of the SRTM Topographic Products.” Accessed January 2, 2016. www2.jpl.nasa.gov/srtm/SRTM_D31639.pdf.
- Pulighe, G., V. Baiocchi, and F. Lupia. 2015. “Horizontal Accuracy Assessment of Very High Resolution Google Earth images in the City of Rome, Italy.” International Journal of Digital Earth. doi:10.1080/17538947.2015.1031716.
- Reuter, H., T. Hengl, P. Gessler, and P. Soille. 2009. “Preparation of DEMs for Geomorphometric Analysis.” In Developments in Soil Science, edited by Tomislav Hengl, and Hannes I. Reuter, 87–120. Amsterdam: Elsevier. ISSN 0166-2481, ISBN 9780123743459. doi:10.1016/S0166-2481(08)00004-4.
- Reuter, H. I., A. Nelson, and A. Jarvis. 2007. “An Evaluation of Void-Filling Interpolation Methods for SRTM Data.” International Journal of Geographic Information Science 21 (9): 983–1008. doi:10.1080/13658810601169899.
- Reuter, H., A. Nelson, P. Strobl, W. Mehl, and A. Jarvis. 2009. “A First Assessment of Aster GDEM Tiles for Absolute Accuracy, Relative Accuracy and Terrain Parameters.” Geoscience and Remote Sensing Symposium, 2009 IEEE International, IGARSS 2009 (5): V-240–V-243.
- Rodríguez, E., C. Morris, J. Belz, E. Chapin, J. Martin, W. Daffer, and S. Hensley. 2006. “An Assessment of the SRTM Topographic Products.” Technical Report JPL D-31639, Jet Propulsion Laboratory, Pasadena, California, 143 pp. http://www2.jpl.nasa.gov/srtm/srtmBibliography.html.
- Suresh, S. 2012. “Global Challenges Need Global Solutions.” Nature 490 (8): 337–338. doi: 10.1038/490337a
- UCS. “Satellite Database.” Accessed January 2016. http://www.ucsusa.org/nuclear-weapons/space-weapons/satellite-database#.VqkhEUZ6S3E.
- UN-GGIM. 2013. “United Nations Global Geospatial Information Management: Future Trends in Geospatial Information Management – the Five to Ten Year Vision.” New York. ISBN: 978-0-319-08792-3.
- UN_GGIM. 2015. “Future Trends in Geospatial Information Management: The Five to Ten Year Vision.” Accessed July 2016. http://ggim.un.org/docs/UN-GGIM-Future-trends_Secondedition.pdf.
- US Group on Earth Observations. 2015. “Draft Common Framework for Earth-Observation Data.” Accessed January 2016. https://www.whitehouse.gov/sites/default/files/microsites/ostp/common_framework_for_earth_observation_data_draft_120215.pdf.
- USGS. 1993. “USGS – Digital Elevation Models – Data Users Guide 5.” Accessed June 2016. http://agdc.usgs.gov/data/usgs/geodata/dem/dugdem.pdf.
- USGS. 2015. “Global Land Surveys.” http://landsat.usgs.gov//science_GLS.php.
- Wagner, W. 2015. “Big Data Infrastructures for Processing Sentinel Data.” In Photogrammetric Week 2015, edited by D. Fritsch, 93–104. Berlin: Wichmann.