
ABSTRACT
We compared the ability of two legend designs on a soil-landscape map to efficiently and effectively support map reading tasks with the goal of better understanding how the design choices affect user performance. Developing such knowledge is essential to design effective interfaces for digital earth systems. One of the two legends contained an alphabetical ordering of categories, while the other used a perceptual grouping based on the Munsell color space. We tested the two legends for 4 tasks with 20 experts (in geography-related domains). We analyzed traditional usability metrics and participants’ eye movements to identify the possible reasons behind their success and failure in the experimental tasks. Surprisingly, an overwhelming majority of the participants failed to arrive at the correct responses for two of the four tasks, irrespective of the legend design. Furthermore, participants’ prior knowledge of soils and map interpretation abilities led to interesting performance differences between the two legend types. We discuss how participant background might have played a role in performance and why some tasks were particularly hard to solve despite participants’ relatively high levels of experience in map reading. Based on our observations, we caution soil cartographers to be aware of the perceptual complexity of soil-landscape maps.
1. Introduction
Soil-landscape maps often feature a large number of categories to represent the diversity of landscapes and soils within a particular region. Having to represent many categories leads to visually complex maps that require well-designed legends to support map reading tasks. Because reducing the number of categories is not an option (given that the goal is to document existing soil types), it is worthwhile to explore how to best support map reading tasks through effective legend design.
Understanding the effectiveness of fundamental map design elements such as legends is necessary to support the development of useful and usable digital earth systems that can help users transform geographic data into actionable information. A complete representation of the Earth, as described in the original digital earth vision, must include soils knowledge. Soil-landscape maps abstract this knowledge through complex landscape representations for use in a number of application areas, for example, for land use planning, energy development, and hazard assessment. Their users need to be able to interpret and synthesize these complex representations to support decision-making activities. Therefore, we view soil-landscape maps as important examples of (necessarily) complex visualizations found in digital earth systems, and we believe it is important to evaluate them.
It is well-understood in cartography that, when possible, one should avoid presenting too much information simultaneously (Slocum et al. Citation2001). This principle is supported by cognitive theories such as information overload and working memory capacity (Eppler and Mengis Citation2004; Hegarty Citation2011). When visual working memory is stretched to its limits by a demanding task, the brain’s information processing system might guide people to get assistance from other cognitive resources for support, such as verbal memory (Lenneberg Citation1961). For example, when preparing statistical maps, cartographers suggest keeping the number of categories to a maximum of five-to-seven (Gilmartin and Shelton Citation1989). This ‘five-to-seven’ limit is based on what the visual working memory literature suggests, that is, what humans can cognitively process at once, as indicated, for example, in Miller’s seminal work ‘Magical number seven, plus or minus two’ (Citation1956, 343). In fact, a recent study even suggests four is the ‘magical number’ (Cowan Citation2001). Magic aside, cartographic generalization and level-of-detail management approaches recommend only displaying relevant information, as far as one can determine what is relevant (e.g. Çöltekin and Reichenbacher Citation2011). Another recommended strategy is to group related elements on the display perceptually and spatially closer together (e.g. Schnürer, Sieber, and Çöltekin Citation2015). However, separating relevant information from the irrelevant is not always feasible. For example, when categories are ‘naturally imposed’, such as in soil-landscape maps, one cannot simply omit categories. In such cases, all categories are potentially necessary and relevant, as opposed to the cases where a cartographer can arbitrarily decide how many classes should be represented.
Thus, in this paper we examine a soil-landscape map that features many categories. We designed a user study, in which 20 participants completed basic map reading tasks. These tasks, while basic, contain essential operations common in map reading: a visual search and identification of specific categories, followed by a comparison and association exercise. The operations, ‘locate, identify, compare, and associate’, are considered essential for map reading (Knapp et al. Citation1995). Because the legend design is very important for interpreting visually complex maps, we focused on evaluating two alternative legend designs in our experiment. Specifically, we studied how ‘color-ordered’ categories (order based on perceptually compared dimensions of hue, lightness, and saturation) compare to ‘alphabetically ordered’ categories in the legend. In the color-ordered legend, we sequenced the items according to color ordering in the perceptually structured Munsell color space (Citation1905). ‘Munsell soil color charts’ are routinely used in the field for characterizing soil colors by soil scientists (Escadafal, Girard, and Courault Citation1988, Citation1989; Landa Citation2004; Viscarra Rossel et al. Citation2006). However, even though an implicit perceptual ordering might occur in soil map legends where the categories are based on similarity of soil types (in soil-landscape maps, they might also be grouped according to broader landscape elements or geology), ordering the legends based on Munsell color space organization is rare with soil maps. We selected these two methods (alphabetically ordered versus color-ordered) to order the items in the legend primarily because they might each provide certain perceptual and cognitive advantages. Furthermore, alphabetically ordered legends have been traditionally used in soil maps (although it is important to note that there has been a shift in recent years to categorical orderings), and the Munsell-based color-ordered legend is a novel design solution.
Based on previous literature, we formulated two competing hypotheses: (1) alphabetical ordering of categories may allow for a better coupling of visual and verbal working memories (Lenneberg Citation1961), leading to more effective visual information processing than perceptual ordering; (2) perceptually motivated color ordering might restrict the visual search space on the legend and allow for more efficient visual information processing than the alphabetical ordering. For example, in the color-ordered legend, if a soil is represented in a shade of green, the viewer would go to where all green shades are in the legend and, because the search space is restricted, we expect that people would solve the task more quickly (Verghese Citation2001). Thus, taking the two legend designs as our independent variable, we studied the standard usability metrics of performance effectiveness (accuracy) and efficiency (speed) as dependent variables. Furthermore, we studied performance differences based on task type and participant background (previous knowledge of soils and map interpretation abilities), as well as how task type and participant background each interact with legend type. We complemented the study with eye movement analysis to better understand the role of specific design elements on the display, as well as to interpret our results in terms of strategy differences between participants.
2. Related work
2.1. Soil mapping
Soil maps and soil-landscape maps are a way of capturing and communicating expert knowledge. Soil-landscape maps display mapped areas of land with a common suite of soil types and landscape attributes. Typically, a soil surveyor becomes an expert in a particular region with a unique composition of landscapes and soil types. The process for creating these maps utilizes both point-based soil characterization and sampling, together with a conceptual model of soil-landscape relationships (Nussbaum et al. Citation2011). These maps depict the scientist’s ‘mental map’ of a region and communicate the soil characteristics to a broad audience (including researchers, extension and policy staff, and farmers). Soil-landscape maps are a useful and necessary part of decision-making processes related to agricultural and natural resources research and management; however, many users seemingly find it difficult to extract information from specific soil surveys and their resultant maps (e.g. McDonald Citation1979). Naturally, soil-landscape maps have evolved in terms of legend design since 1979 (i.e. there is more grouping in the legends based on soil types in modern maps), however, their perceptual complexity is persistent, because they often must represent many categories. Ultimately, the map-reader’s understanding of the soil classification depends upon how the legend communicates this complexity. Thus, the legend will determine the legibility of a soil map (Imhof et al. Citation2008).
A first design issue regarding legends in this context derives from the large number of categories typically present in soil maps. Having to represent a large number of categories results in an inability to convey all of the required soil attributes (e.g. geology, landform, dominant soils, etc.) using a visual symbol alone (e.g. color or texture). Indeed, one research team noted: ‘Colors are never to be used alone!’ (Sombroek and van de Weg Citation1980, 8). This difficulty has led soil cartographers to create elaborate legends that include a large range of soil attributes, and map labels that are associated with particular map symbols. This presents a second design issue: how to organize information within a legend. Some legend designs make it easier to extract required information than others. For example, in a study of soil map reading by non-experts, Valentine, Naughton, and Navai (Citation1981) reported that more than half of their respondents found it challenging to extract the information they were seeking from soil maps. In particular, Valentine, Naughton, and Navai (Citation1981) found that complex, connotative map labels were harder for non-experts to work with than simple labels. In a later study Coulson and Ellehoj (Citation1993) also compared complex, connotative labels (‘open legends’) with simpler labels (‘closed legends’). In this study open legends carried more information within the labels themselves rather than the legend, ‘essentially reflecting the map field notes of the surveyor’ (Coulson and Ellehoj Citation1993, 261), while closed legends move information from the label (thus from within the map) to the legend (please refer to the original paper by Coulson and Ellehoj (Citation1993) for a visual example). Coulson and Ellehoj (Citation1993) found that closed legends better facilitated the search for information associated with a particular map symbol, and improved task accuracy and efficiency.
2.2. Legend designs and the use of color
Despite the improvements in map usability derived from choosing a closed legend design, soil maps remain challenging to read. In addition to the information about multiple soil attributes, it is common for a soil-landscape map legend to include dozens of categories using a large range of colors and/or textures. Thus, a key map reading challenge is finding the desired symbol and its associated soil attribute information within the legend. The individual symbols in these legends are traditionally ordered alphabetically or, more recently, thematically (e.g. by soil category). Irrespective of how the categories are organized in a legend, color is commonly used in thematic maps to represent categories, including in soil-landscape maps. Brewer (Citation1989) compared multiple approaches for developing cartographic color schemes and developed a method for translating painted Munsell colors into ‘printable colors’, using process-color (cyan, magenta, yellow, and black). The fundamental premise of Brewer’s (Citation1989) work was that perceptually designed color schemes, such as Munsell colors, are ideal candidates for cartographic design, because they leverage what we know about map readers’ color discrimination abilities. In a perceptually designed color scheme, map readers should be able to easily differentiate between individual map colors; a task that can be challenging when a map depicts many different categories. Later, Brewer (Citation1994) proposed a general set of guidelines for designing thematic map color schemes based on perceptual dimensions, which were eventually implemented in the online ColorBrewer tool (Harrower and Brewer Citation2003); widely used by map makers, graphic designers, and data scientists. In other words, visualization designs based on an understanding of how we perceive colors have been evaluated in previous studies.
2.3. Evaluating map designs with eye tracking
Eye tracking has been used for a long time in evaluating how people study visual scenes (Yarbus Citation1967) as well as maps (Brodersen and Andersen Citation2002). In the last decade, enabled by affordable and precise technology, we have seen many different uses of eye tracking in evaluating geographic visualizations, ranging from interface evaluations and studying visual strategies of participant groups, based on temporal analysis (Çöltekin et al. Citation2009, Citation2010), to color perception and discriminability thresholds (Brychtova and Çöltekin Citation2015, Citation2016a), differences in expert/non-expert behavior (Çöltekin, Fabrikant, and Lacayo Citation2010; Ooms, De Maeyer, and Fack Citation2013), how environmental information is transmitted via text and animation (Russo et al. Citation2014), or to understanding how different visual highlighting mechanisms (including color) work in multiple-view displays (Griffin and Robinson Citation2015). Eye tracking data allow analysis of where participants look: what they see and what they do not; how long they search for something and how often they look at a design feature, and in which order they study the design elements within a display. This allows inferring some of the cognitive processes that might be taking place as the participants work with maps (Li, Çöltekin, and Kraak Citation2010). In this study, participants’ attention is necessarily split between the map and the legend. Eye tracking enables us to assess the time spent studying each, and can help tease apart the number of transitions between the map and the legend with the two legend designs. If an interaction design goal is to reduce the number of transitions to improve efficiency, we can observe this only through eye tracking.
3. Methods
Our goal was to evaluate the extent to which ordering legend items in a soil-landscape map by category name (alphabetically ordered) or category color (color-ordered) has an impact on the effectiveness (i.e. accuracy) and efficiency (i.e. speed of successful task completion) of participants in typical soil-landscape map reading tasks. To conduct our evaluation, we developed an empirical experiment in which we utilized standard usability metrics as well as eye tracking.
3.1. Experiment design
Our independent variable was the legend design: one soil-landscape map with two alternative legend designs (color-ordered versus alphabetically ordered). We further explored the effects of the tasks and participant background as experimental factors. We used an existing map with an alphabetically ordered legend as a baseline (), and, because color-ordered designs based on Munsell color organization are uncommon, we redesigned the legend of this map according to the Munsell color space ().
Figure 1. Layout of the Maffra region soil-landscape map with the alphabetically ordered legend. See (left) for a close-up of the color organization. Colour images can be viewed online at www.tandfonline.com/doi/full/10.1080/17538947.2016.1234007
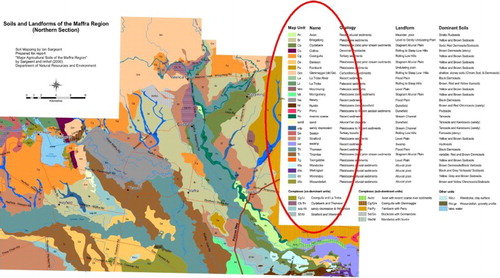
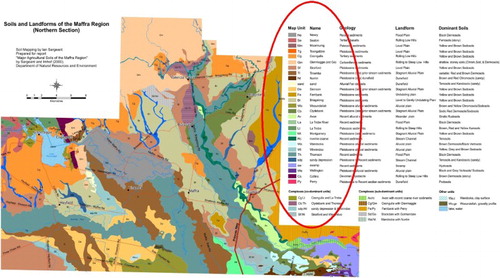
Figure 2. Layout of the Maffra region soil-landscape map redesigned with a color-ordered legend. See (right) for a close-up of the color organization. Colour images can be viewed online at www.tandfonline.com/doi/full/10.1080/17538947.2016.1234007
We developed four tasks requiring the use of the map legend that included Knapp et al.’s (Citation1995) primary (visual) operators locate, identify, associate, and compare. The precise wording of the tasks can be seen in . We used a within-subjects experimental design, meaning that each participant completed all four tasks for each of the legend designs. We recorded accuracy (number of correct responses), speed (task completion times), which legend design the participants preferred, and eye movements, as our dependent variables.
Table 1. Experimental tasks, correct answers and their underlying visual operators.
3.2. Materials
We used a TobiiTM X60 eye tracker with a built-in infrared sensor at the base of a 24″ monitor (1920 × 1200 pixels), with a constant color calibration through the experiment. The X60 samples eye movements at 60 Hz, and records the screen as well as a webcam video to support multiple types of post hoc analysis. We selected the visual stimulus from the soil-landscape maps available in the Victorian Resources Online (VRO) website (http://www.depi.vic.gov.au/vro), which has been the principal means for accessing information about landforms and soils in Victoria since 1997 (Imhof et al. Citation2011, Citation2012). We selected the map of the Maffra region, originally developed by Sargeant and Imhof (Citation2000), as an example of a complex soil-landscape map on the website ().
The Maffra region map was one of the earliest soil-landscape maps to be developed specifically for the VRO website and has remained unchanged since 2002. The map legend displays map units (categories), most named after localities in the region, in alphabetical order (Avon to Wooundellah), together with the dominant geology, landform, and soil type/s. Colors were based on web-safe options and were designed to represent broad landform categories, with darker brown colors indicating areas of higher relief (i.e. hills), and green colors indicating various riverine landscapes, etc. The original map is interactive, and the map legend is clickable via the map unit name to link to descriptions of the landscape and soil in each map unit. However, in the experiment, static screenshots were used for better experimental control, that is, to ensure all participants worked with identical information without possible interference from zoom and pan operations, or from varying interactive behavior.
The original layout was a portrait orientation, with a very large legend that covered more than half of the page. To maximize the size of the map on the display we used, and best match our eye tracking hardware parameters, we switched to a landscape layout and repositioned the legend. shows the modified layout of the original map. This map was also adjusted to ensure the legend and other map elements were fully readable with the monitor we used. We developed the alternative color-ordered legend and organized the categories by hue and saturation, according to the Munsell color system (Citation1905). shows the color-ordered legend layout.
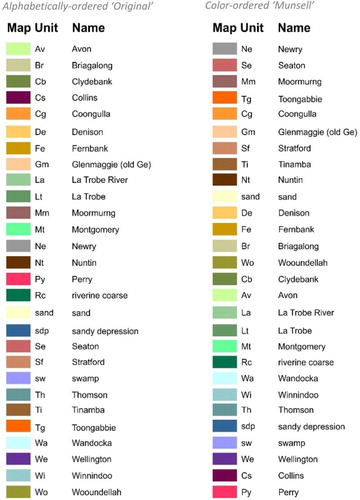
shows a ‘zoomed-in’ version of both the alphabetically ordered (left) and color-ordered (right) legend designs. We did not modify the colors in the color-ordered legend, but simply re-ordered them to match as closely as possible the order in which they would occur in the Munsell Color System. As can be seen in (left), the alphabetically ordered legend design has some perceptually similar colors close together, while others are far apart. The grouping on (right) could potentially allow for easier matching between the legend and the map, or may have the opposite effect if the colors displayed close to each other are too similar. We studied whether the colors were too similar using the color metric ΔE, which yielded no ‘red flags’ (ΔE > 10) in all comparisons (Brychtova and Çöltekin Citation2015, Citation2016a, Citation2016b). Thus, we hypothesized that the perceptual grouping would be more likely to be helpful rather than harmful.
Figure 3. Left: the alphabetically ordered legend from the original Maffra Soils Map. Right: the redesigned color-ordered legend based on Munsell color system. Colour images can be viewed online at www.tandfonline.com/doi/full/10.1080/17538947.2016.1234007
3.3. Participants
We recruited 20 participants (9 females, 10 males, 1 who did not identify their gender, age range: 26–45) from a geovisual analytics workshop held in conjunction with a meeting of the International Society for Photogrammetry and Remote Sensing (ISPRS) in Melbourne, Australia. We deliberately sought out a participant pool that had substantial map reading/interpretation expertise as the experiment uses a specialized map type. 90% of participants strongly agreed with the statement ‘I’m comfortable with maps’. However, for ability to interpret soil maps only 20% marked ‘high’, 45% ‘partial’, and 30% ‘none’. Knowledge about soils was self-reported somewhat similarly: 25% marked ‘expert’, 35% ‘partial’, 40% ‘none’. Note that ‘soils knowledge’ could be limited, for example, to soil chemistry, which does not necessarily mean that they are familiar with soil-landscape mapping or are used to reading this type of map. No participants had impaired color vision.
3.4. Procedure
After an introduction, the eye tracker was calibrated for each participant. Then, participants completed the tasks, and rated their confidence using a five-point Likert scale. We randomized the stimuli and questions to avoid order effects. After the experiment, participants marked their preference for the two legend designs, filled out a demographic questionnaire, and completed an Ishihara color vision test (Clark Citation1924).
4. Results
We first report the overall performance of participants (accuracy and response time) with the two legend designs, then, their performance by task and their expertise levels. Following this, we report the interactions between the studied factors, and offer insights gathered from the eye movement analyses. Because of a technical glitch, the confidence data were not recorded in a usable format for all participants, and is therefore not reported in this paper. The confidence data were intended help us explore potential differences between more and less confident responses, but confidence was not the primary focus of our work.
4.1. Legend design
Overall accuracy for both legend designs was surprisingly low: the alphabetically ordered design yielded 55% success, and the color-ordered design 53.75% (). A chi-square test revealed no statistically significant difference in accuracy based on the two legend designs (χ2 = 0.101, df = 1, p = .75, left). Similarly, we observed no statistically significant differences in participants’ overall response times with either legend design (t = 0.23, p = .82, right).
Figure 4. Participants’ overall accuracy (left) and response times (right) per legend design. Error bars: ±2SEM.
Participants’ preference between two legend designs was evenly split: 50% preferred the alphabetically ordered legend and 50% the color-ordered.
4.2. Tasks
While legend design did not influence participants’ overall performance or preference, we found substantial disparities in terms of performance between experimental tasks ( left), ranging from 17.5% (Q2) to 87.5% accuracy (Q4). A chi-square test confirmed that the differences in accuracy are statistically significant (χ2 = 127.67, df = 3, p < .01) for task types. A pairwise comparison showed that the differences were significant between all tasks except Q3–Q4 (Q1–Q2 χ2 = 4.94, df = 1, p = .02; Q1–Q3 χ2 = 10.02, df = 1, p < .01; Q1–Q4 χ2 = 19.53, df = 1, p < .01; Q2–Q3 χ2 = 26.59, df = 1, p < .01; Q2–Q4 χ2 = 39.29, df = 1, p < .01, Q3–Q4 χ2 = 2.05, df = 1, p = .15). Task-wise response times also differed (F = 2.71, df = 3, p = .047, right) and confirm that Q2 was difficult: not only did participants have the lowest accuracy with this task, but they also used more time for Q2 than for the other tasks. Pairwise comparisons confirmed significant response time differences between Q1–Q2 (t = 2.46, p = .02) and Q1–Q3 (t = 2.13, p = .04).
Figure 5. Participants’ accuracy (left) and response times (right) on individual tasks (across both legend designs). Error bars: ±2SEM. *p ≤ .05, **p < .01.
4.3. Previous knowledge and experience
Our participant group included five participants with expert knowledge about soils, six with partial, and eight with no previous knowledge. The groups’ overall performance differences suggest an advantage for those who declared themselves to be experts ( left, accuracy; right, response time). A chi-square test revealed dependence between the level of expertise and overall accuracy (χ2 = 24.2, df = 2, p < .01). Expert participants (75% accuracy) obtained better results than those with no previous knowledge (48.4% accuracy, χ2 = 7.2, df = 1, p = .01) or partial knowledge (47.9%, χ2 = 6.7, df = 1, p = .01), and we observed no differences between participants with no or partial previous knowledge of soils (X = 0.003 df = 1, p = .96) (, left). Response time analysis did not yield any statistically significant differences between participant groups (F = 1.16, df = 2, p = .327). However, it is noteworthy that the average response time steadily decreases with increasing knowledge (, right).
Figure 6. Participants’ accuracy based on their soils expertise levels (left), response times (right). Error bars: ±2SEM. **p < .01.
Similarly, we analyzed accuracy and response times based on participants’ self-declared ‘ability to interpret soil maps’ (, left, accuracy; right, response time). In this case, four participants reported that they had no ability to interpret soil maps, nine were in the middle and six rated their ability as ‘high’ (one participant did not mark an answer). The results confirmed the findings from the ‘previous soils knowledge’ analysis reported above, showing clearer differences, both in accuracy and in response time, and therefore indicating that the self-assessed ability to interpret soil maps was reflected in actual performance.
Figure 7. Participants’ accuracy based on their self-assessed ‘ability to interpret soil maps’. A consistent climb in accuracy and decrease in response times suggests a clear pattern for how map interpretation abilities affect performance. Error bars: ±2SEM. *p ≤ .05, **p < .01.
A chi-square test confirmed that soil map reading abilities had an effect on the overall accuracy (χ2 = 38.8, df = 2, p < .01). Those with the highest soil map reading abilities achieved the highest accuracy (65% correct). Confirming this, response times decrease as self-reported soil map reading abilities increase (F = 4.31, df = 2, p = .015). Pairwise comparisons revealed statistically significant differences between the none and high-ability groups (t = −2.87, df = 64.7, p < .01), as well as partial- and high-ability groups (t = −2.15, df = 57.81, p = .03), while the partial- and high-ability groups did not differ.
4.4. Interactions
To better understand these differences in performance, we examined the interactions between the studied factors (tasks, previous knowledge, and ability to interpret soil maps) in relation to legend design, our primary independent variable.
4.5. Tasks and legend design do not interact
We analyzed the accuracy and response time measurements to understand if they were affected by the tasks in relation to legend design. A chi-square test revealed that accuracy was not influenced by task per legend design (Task 1: χ2 = 0.41, df = 1, p = .52; Task 2: χ2 = 0.17, df = 1, p = .68; Task 3: χ2 = 0.00, df = 1, p = 1.00; Task 4: χ2 = 0.22, df = 1, p = .63). Similarly, we observed no interaction between the legend designs and tasks, based on response time (Task 1: t = 0.87, p = .34; Task 2: t = 0.85, p = .40; Task 3: t = −0.73, p = .48; Task 4: t = −0.58, p = .56).
4.6. Previous knowledge and legend design do not interact
Next, we studied the interactions between self-declared soil knowledge and legend design. Descriptive statistics suggested that participants with no previous knowledge of soils were more successful with the color-ordered design than the alphabetically ordered, while the participants with partial and expert knowledge were more successful with the alphabetically ordered design ().
Figure 8. Interactions between self-assessed soils knowledge and legend design in terms of participants’ accuracy (left) and response times (right). Error bars: ±2SEM.
However, neither the differences in accuracy (none: χ2 = 1.56, df = 1, p = .21; partial: χ2 = 2.08, df = 1, p = .14, expert: χ2 = 0.53, df = 1, p = .46), nor in response times (none: t = 0.22, df = 31, p = .82; partial: t = -0.74, p = .46; expert: t = 0.54, df = 1, p = .59) were statistically significant.
4.7. Soil map interpretation ability and legend design interact
Analyzing the interactions between the legend design and self-declared ability to interpret soil maps suggests an advantage for participants with strong abilities in interpreting soil maps in using the alphabetically ordered legend ().
Figure 9. Interactions between self-assessed abilities when interpreting soil maps and legend design. Error bars ±2SEM. *p ≤ .05.
A chi-square test revealed that the influence of legend design on accuracy based on the self-declared soil map interpretation abilities of participants was not statistically significant (high: χ2 = 3.20, df = 1, p = .07; medium: χ2 = 0.51, df = 1, p = .47; no: χ2 = 0.12, df = 1, p = .71). The descriptive pattern suggests that the high-ability group did better with the alphabetically ordered legend, in comparison to the other two groups. The response times analysis showed a stronger difference: participants with high soil map interpretation skills were faster with the alphabetically-ordered design (t = −2.58, df = 23, p = .01), while the two other groups’ response times were not influenced by legend design (no: t = 0.34, df = 15, p = .73; medium: t = 1.60, df = 35, p = .11).
4.8. Eye movement analysis
To better understand the differences in the success between participant groups, we studied their eye movements through (1) the transitions between the map and the legend, (2) an area of interest (AOI) analysis for the utilization of color versus text in the legend, and (3) a qualitative analysis of the eye movement recordings to gain insight into their map-use strategies.
4.9. Transitions
We compared the number of times participants switched their gaze between the map and the legend, and grouped this based on ‘ability to interpret soil maps’. Confirming our previous analyses, the transition analysis revealed that participants with high map interpretation abilities went back and forth between the map and legend considerably fewer times with the alphabetically ordered legend (on average 5.3 transitions for the color-ordered, 3.0 for the alphabetically ordered), while it made no difference for the other groups. shows the differences in the number of transitions between the studied groups.
Figure 10. Average number of gaze transitions between the map and the legend per visualization type, based on ‘ability to interpret soil maps, averaged by number of participants and tasks.
A closer look at the transition analysis at the task level revealed that this difference occurred mostly during Q3, in which the task requires switching the gaze between map→egend→map, as opposed to the others where there is only map→legend or legend→map ().
4.10. Legend AOIs
Because the participants with greater soils knowledge and soil map interpretation abilities did better overall with the alphabetically ordered legend, in a post-hoc hypothesis, we speculated that they might be able to recognize the codes used for unit names on the maps, and thus may have had less reliance on colors. Even though recognizing these codes does not necessarily require expert knowledge, familiarity could have made it easier. To test this, we defined two AOIs: around color patches in the legend (color) and around the text in the legend (text) ().
Figure 11. The two AOIs in the legend (color versus text).
The sums of fixation durations (dwell times) over the color/text AOIs revealed that the dwell times of ‘none’ and ‘partial’ groups did not differ, while ‘high’ group spent more time looking at the color AOI in the color-ordered legend than in the alphabetically ordered legend (t = −2.51, df = 23, p = .01, mean of differences −1.32 s), confirming our expectations ().
Figure 12. Dwell times of participant groups on color (left) and text (right) AOIs in the legend. All groups spent more time looking at the text; however, dwell times go down for both the color AOI and text AOI for the no-ability group from alphabetically ordered to color-ordered, while this is the opposite for the high-ability group. Error bars: ±2SEM. *p ≤ .05.
Even though we did not observe statistically significant differences in other pairwise comparisons, we find the pattern in noteworthy: no/partial ability groups performed better with the color-ordered design (dwelling more on the color AOI), while the opposite is true for the high-ability group, confirming the findings with the standard performance metrics (e.g. as presented in ).
4.11. Scanpaths and gaze densities
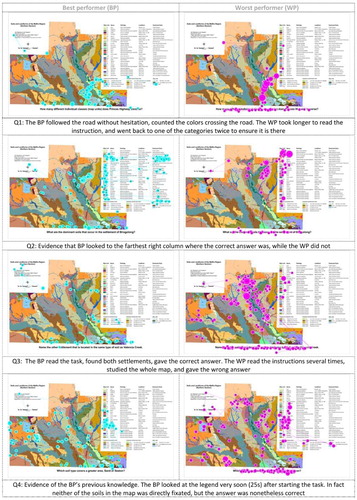
Eye movement recordings can provide qualitative insights into participant strategies. Thus, we ‘eyeballed’ the successful and less-successful participants’ gaze trajectories (scanpaths). , as an illustrative example, shows the scanpaths of the best-performing participant (a partial expert), and the worst (a non-expert) for the alphabetically-ordered legend design in terms of response accuracy. The best performer is clearly less hesitant in all cases, and we can see that she or he relies on previous knowledge.
Figure 13. The scanpaths of the best-performing participant and the worst-performing participant (presented only on the alphabetically ordered design as an illustrative example).
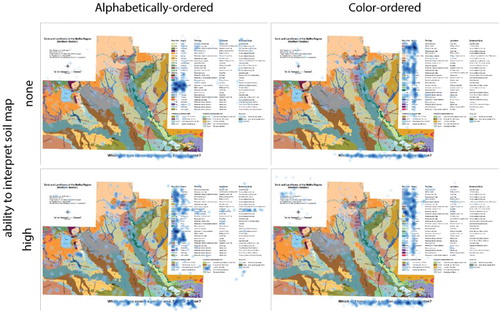
In addition to the individual gaze plots, we studied the gaze densities (‘heatmaps’) of the participant groups based on their ability to interpret soil maps. and show the gaze densities of the high- and no-ability groups for the hardest and easiest questions, respectively.
Figure 14. Gaze density maps for the hardest question (Q2) for the two groups.
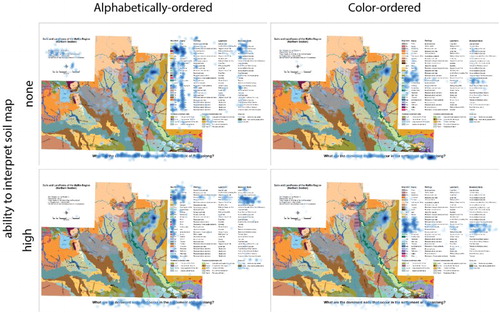
Figure 15. Gaze density maps for the easiest question (Q4) for the two groups.
Average gaze behavior of the high- and no-ability groups clearly differs with the alphabetically ordered design in both cases, showing a more deliberate visual behavior for the expert participants. With the harder question (), we see that experts search less with the alphabetically ordered design. With the easier question, experts appear to search more on the legend, and read the text more than the non-experts. For the color-ordered legend, the pattern looks similar between experts and non-experts. Gaze densities overall suggest that experts apply concrete strategies with the alphabetically ordered design while the non-experts somewhat randomly search for the information; while with the color-ordered legend, the two groups both have to simply search.
5. Discussion
We conducted this study to understand the role of legend design on the perceptual complexity of soil-landscape maps. With such maps, the number of represented categories cannot be reduced to the cartographically recommended 5–7, because the categories are naturally imposed. In such cases, legend design can play an especially important role in map legibility. We hypothesized that alphabetically-ordered legends could lead to more effective map reading through verbal associations (Lenneberg Citation1961), while color-ordered legends could allow for more efficient visual search as they would restrict the search space (Verghese Citation2001). Below we discuss the nuanced findings in this study, and implications of design for human performance with soil-landscape maps.
5.1. Expertise and the legend design: for whom does the design work?
We observed no overall differences in performance between the two legend types (), suggesting, at first, that the two designs could be arbitrarily exchanged. However, a closer look revealed that this was not true for all audiences: experts (we use the term ‘expert’ both for ‘expert soils knowledge’, and ‘high soil map interpretation abilities’ in this section) did better than non-experts overall ( and ), and particularly with the alphabetically ordered design ( and ). On the other hand, non-experts did better than experts with the color-ordered design, especially in terms of efficiency (). This is remarkable, given that the overall success rates were clearly in favor of the experts ( and ), because it suggests that the experts did really badly with the new, color-ordered design. This could be because the experts are well conversant with (and conditioned by) the alphabetically ordered design. These findings are in line with previous research that demonstrates the performance and strategy differences between experts and non-experts in spatial tasks (e.g. Çöltekin, Fabrikant, and Lacayo Citation2010; Ooms, De Maeyer, and Fack Citation2013). Our results confirm previous findings also in the case of soil-landscape maps, reassuring for the internal validity of the study, as well as the potential generalizability of the results. Moreover, our findings regarding expertise are consistent over various analyses, for example, we see the same pattern in performance metrics as well as in the eye movement analysis. The fact that non-experts benefitted from the color-ordered legend more than experts is also supported by previously published results, that is, inexperienced users are guided by design, while experienced users might have established strategies (Çöltekin, Fabrikant, and Lacayo Citation2010). In this case, it appears that the non-experts were guided by color and made use of the perceptual organization (). On the other hand, the experts struggled as the new design did not use the design convention to which they were accustomed (i.e. alphabetically ordered soil maps are common; ). We believe that experts might have benefitted from having recognized the codes used on the map in the alphabetically-ordered design, thus ignoring colors entirely in some cases and going straight to the verbal information. This is evident in the eye movement recordings (), and is similar to the findings of Valentine, Naughton, and Navai (Citation1981) and Coulson and Ellehoj (Citation1993). Another interesting observation regarding the expertise levels in this study is that ‘partial’ knowledge or abilities did not provide much effect: Participants who marked their knowledge and abilities ‘partial’ might be overestimating their knowledge, or these findings might be suggestive of a ‘threshold effect’ (i.e. a sufficient level of expertise is needed to effectively use the relevant knowledge in interpreting soil-landscape maps).
These performance differences between experts and non-experts provide additional evidence to support the commonly expressed statement ‘the designer is not the user’. It is important to remember that those who design are often experts (Richter, Tomko, and Çöltekin Citation2015). In our case, a map legend designed by soil experts was accessible to other expert users, but not necessarily to non-experts (even if they were experts in geography-related domains). Even seemingly subtle design decisions, such as re-ordering the items in the legend, might have consequences for performance, especially for some user groups. Another related and interesting point to consider is that while we grouped ‘soils knowledge’ and ‘ability to interpret soil maps’ into one group in the Discussion section for convenience (‘experts’), we see a stronger difference based on map interpretation ability on all discussed accounts. Soils knowledge suggested an advantage too, but the ability to interpret soil maps appears to be a stronger moderator of overall success and the division in performance based on legend types. Thus, we see that maps could be designed differently for beginners or novices, with perceptually optimized designs. Specifically, our results suggest that Munsell organization of colors has opposite effects on experts and non-experts. Further experimentation is worthwhile to validate the impact of the visual variable position in connection with the perceptual grouping of colors in legends designed for visually complex maps.
5.2. Hard tasks, harder tasks: the relevance of design
At the task level, the first striking result is that the overall accuracy levels are very low, regardless of the legend design. This was especially pronounced for two of the four tasks (). Why could this be so? Our participants were professionals in geography-related domains (90% said they were comfortable with maps); we left the codes on the map, yet they are clearly failing in tasks that are essentially basic map reading tasks requiring perceptual interpretation and not high levels of soils knowledge per se. A similar result has been shown in earlier work by Valentine, Naughton, and Navai (Citation1981), where more than half of the participants had difficulties with the soil maps (in that case, non-experts). We believe these results provide empirical evidence for the perceptual complexity of soil-landscape maps.
However, the accuracy is not low in all cases, which might be explained by task type (). The two harder tasks (Q1 and Q2) are ‘association’ tasks (Knapp et al. Citation1995). The problems participants experienced with Q2 were especially severe (82.5% failure). We believe this is linked to a design problem that makes the association of the color and related text difficult: the text is too far from the referring color, thus legend does not facilitate solving the task with the necessary precision. It has been previously demonstrated that the gap between map elements can matter for perceptual tasks (Brychtová and Çöltekin Citation2016b). A reorganization of the legend with better visual hierarchy, or well-designed dynamic highlighting, could solve this problem. On the other hand, the low success rates with Q1 (63.5% failure) is likely explained by working memory capacity; that is, Miller’s (Citation1956) ‘magical number seven’ or Cowan’s (Citation2001) ‘magical number four’ might be relevant here. This task required discriminating 10 colors/categories, and even if it was simply counting them, participants struggled (counting some twice, or skipping one). This clearly demonstrates the perceptual complexity of maps that represent many categories.
Participants fared better with the other two tasks (Q3 and Q4), which are both ‘comparison’ tasks (Knapp et al. Citation1995), and importantly, with only two items to compare. Thus, these were easier than association tasks in this context. Q3 yielded a significantly better score (25% failure) than the previous two (Q1 and Q2). With Q3, mistakes were caused by two shades of red color that were somewhat similar. As suggested by Brychtova and Çöltekin (Citation2016a), we checked the color distance between these two shades and found it was ΔE00 = 15.2. Brychtova and Çöltekin (Citation2016a) demonstrated that ΔE00 > 10 was a ‘large enough’ difference; however, their study featured ‘fictional’ thematic maps with seven categories. Thus, for perceptually complex maps with many categories, the color distance should possibly be applied even more conservatively. Q4 was the easiest task (12.5% failure), where participants compared two relatively large areas without too much difficulty.
We derive two general observations from the differences at the task level: (1) we need to think through what the maps are going to be used for (‘map purpose’); (2) and when conducting experiments, we need to design the tasks carefully. Conducting tests with a single task type might compromise the interpretation of the results (i.e. one can say ‘the map is hard to read’ but the truth would be ‘the map is hard to read for x’). A task taxonomy, specific for the purpose of the map type, is worth considering for systematic testing (Rautenbach, Coetzee, and Çöltekin Citation2016).
Finally, we note potential limitations in our work that could be explored in future research. First, one could argue that the sample population size of 20 participants may not be large enough. It is quite difficult to recruit a large number of people with expertise in geovisualization and/or soil mapping, but this is an area of potential future focus nonetheless. Seeking participants from different geographic regions would also be beneficial (ours were all from the same region). We might also query expertise with specific legend types in soil maps as part of participant recruiting efforts to support deeper comparisons. In connection to the issue of sample size, we acknowledge that the sub-groups are very small, however all of our descriptive statistics reveal similar patterns, thus we think the internal consistency of the results are robust. Furthermore, it is also important to note that we have checked for speed-accuracy trade-off and we found that participants who responded more accurately were also faster, further confirming our observations. Thus despite the limitations regarding the sample size, we believe we provide many interesting first insights regarding the perceptual complexity of soil maps, and associated user behavior based on expertise.
6. Conclusions and outlook
With this study, we have provided empirical evidence that soil-landscape maps indeed are perceptually complex (based on the very low overall success rates). Furthermore, we contribute to the existing body of knowledge that changes in design, even those as subtle as reordering a legend, could have a different impact on different audiences. Understanding the implications of design on human performance is a necessary (albeit complicated) endeavor (Çöltekin, Pettit, and Wu Citation2015). With this study, we demonstrated that a perceptually driven design might be helpful for novice users, and the experts might be strongly conditioned to follow conventions to which they were accustomed. Awareness of such differences is important, as we might resist the idea of change based on introspection (i.e. ‘if it works for me, it works for everyone’, or ‘if this change is frustrating for me, it should be for all’). While introspection can be a powerful tool, what works for us might not work for others, even for other experts in related domains (i.e. geographers versus soil scientists). It is also important to remember that perceptual/visual complexity has many dimensions. The purpose clearly matters and should be kept in mind when creating and using soil maps.
We believe that there are various ways to address the perceptual complexity of soil-landscape maps. Naturally, further testing to establish the findings for a larger audience, and with more maps, would strengthen these findings. Perhaps as an immediate next step, testing legends that feature perceptually grouped soil-landscape types would also allow us to better understand the interaction between perceptual and cognitive processes during soil map reading. Additional legend types should also be explored, including those that use alternative strategies for ordering, grouping, and color arrangement. Most of all, a visual highlighting mechanism could be helpful for interactive digital soil mapping in digital earth applications. Based on this study, and analysis of the related literature, we believe a real time gaze- and/or mouse-based highlighting approach would be worth considering. While such a system is limited in its use for printed maps, it could be conceived for digital earth applications. Thus we intend to implement such a system and test it as a next step to better enable future digital earth applications to preserve and provide proper access to information on soils.
Supplementary_Materials_Video_2.mp4
Download MP4 Video (486.5 KB)Supplementary_Materials_Video_1.mp4
Download MP4 Video (649.1 KB)Acknowledgements
We would like to thank our participants and Matthew Cox for his contributions in preparing the original soil map in this study.
Disclosure statement
No potential conflict of interest was reported by the authors.
ORCiD
Arzu Çöltekin http://orcid.org/0000-0002-3178-3509
Alžběta Brychtová http://orcid.org/0000-0003-0513-3972
Amy L. Griffin http://orcid.org/0000-0001-6548-7970
Anthony C. Robinson http://orcid.org/0000-0002-5249-8010
Mark Imhof http://orcid.org/0000-0002-0464-0502
Chris Pettit http://orcid.org/0000-0002-1328-9830
Related Research Data
References
- Brewer, C. A. 1989. “The Development of Process-printed Munsell Charts for Selecting Map Colors.” Cartography and Geographic Information Science 16 (4): 269–278. doi:10.1559/152304089783813945.
- Brewer, C. A. 1994. “Guidelines for Use of the Perceptual Dimensions of Color for Mapping and Visualization.” In IS&T/SPIE 1994 International Sympsium on Electronic Imaging: Science and Technology, edited by J. Bares, 54–63. Bellingham, WA: SPIE – International Society of Optics and Photonics. doi:10.1117/12.175328.
- Brodersen, L., and H. H. K. Andersen. 2002. Applying Eye-Movement Tracking for the Study of Map Perception and Map Design, Publication Series 4, Vol. 9. Copenhagen: National Survey and Cadastre.
- Brychtova, A., and A. Çöltekin. 2015. “Discriminating Classes of Sequential and Qualitative Colour Schemes.” International Journal of Cartography 1 (1): 62–78. doi:10.1080/23729333.2015.1055643.
- Brychtova, A., and A. Çöltekin. 2016a. “An Empirical User Study for Measuring the Influence of Colour Distance and Font Size in map Reading Using eye Tracking.” The Cartographic Journal 51 (4): 1–11. doi:10.1179/1743277414Y.0000000103.
- Brychtová, A., and A. Çöltekin. 2016b. “The Effect of Spatial Distance on the Discriminability of Colors in Maps.” Cartography and Geographic Information Science. Advance online publication. doi:10.1080/15230406.2016.1140074.
- Clark, J. H. 1924. “The Ishihara Test for Color Blindness.” American Journal of Physiological Optics 5: 269–276.
- Çöltekin, A., S. I. Fabrikant, and M. Lacayo. 2010. “Exploring the Efficiency of Users’ Visual Analytics Strategies Based on Sequence Analysis of eye Movement Recordings.” International Journal of Geographical Information Science 24 (10): 1559–1575. doi:10.1080/13658816.2010.511718.
- Çöltekin, A., B. Heil, S. Garlandini, and S. I. Fabrikant. 2009. “Evaluating the Effectiveness of Interactive map Interface Designs: A Case Study Integrating Usability Metrics with eye-Movement Analysis.” Cartography and Geographic Information Science 36 (1): 5–17. doi:10.1559/152304009787340197.
- Çöltekin, A., C. Pettit, and B. Wu. 2015. “Geovisual Analytics: Human Factors.” International Journal of Digital Earth 8 (8): 595–598. doi:10.1080/17538947.2015.1047173.
- Çöltekin, A., and T. Reichenbacher. 2011. “High Quality Geographic Services and Bandwidth Limitations.” Future Internet 3 (4): 379–396. doi:10.3390/fi3040379.
- Coulson, M. R., and E. A. Ellehoj. 1993. “Soil map Legends as Tools of Cartographic Communication.” Catena 20 (3): 257–271. doi:10.1016/0341-8162(93)90004-9.
- Cowan, N. 2001. “The Magical Number 4 in Short-term Memory: A Reconsideration of Mental Storage Capacity.” The Behavioral and Brain Sciences 24 (1): 87–114, discussion 114–185. doi:10.1017/S0140525X01003922.
- Eppler, M. J., and J. Mengis. 2004. “The Concept of Information Overload: A Review of Literature from Organization Science, Accounting, Marketing, MIS, and Related Disciplines.” The Information Society 20 (5): 325–344. doi: 10.1080/01972240490507974
- Escadafal, R., M. C. Girard, and D. Courault. 1988. “Modeling the Relationships Between Munsell Soil Color and Soil Spectral Properties.” International Agrophysics 4 (3): 249–261.
- Escadafal, R., M. C. Girard, and D. Courault. 1989. “Munsell Soil Color and Soil Reflectance in the Visible Spectral Bands of Landsat MSS and TM Data.” Remote Sensing of Environment 27 (1): 37–46. doi:10.1016/0034-4257(89)90035-7.
- Gilmartin, P. P., and E. Shelton. 1989. “Choropleth Maps on High Resolution CRT’s. The Effects of Number of Classes and Hue on Communication.” Cartographica 26 (2): 40–52. doi:10.3138/W836-5K13-1432-4480.
- Griffin, A. L., and A. C. Robinson. 2015. “Comparing Color and Leader Line Highlighting Strategies in Coordinated View Geovisualizations.” IEEE Transactions on Visualization and Computer Graphics 21 (3): 339–349. doi:10.1109/TVCG.2014.2371858.
- Harrower, M., and C. A. Brewer. 2003. “ColorBrewer.org: An Online Tool for Selecting Colour Schemes for Maps.” The Cartographic Journal 40 (1): 27–37. doi:10.1179/000870403235002042.
- Hegarty, M. 2011. “The Cognitive Science of Visual-Spatial Displays: Implications for Design.” Topics in Cognitive Science 3 (3): 446–474. doi:10.1111/j.1756-8765.2011.01150.x.
- Imhof, M., G. Chapman, R. Thwaites, and R. Searle. 2008. “Communication.” In Guidelines for Surveying Soil and Land Resources, 2nd ed., edited by N. J. McKenzie, M. J. Grundy, R. Webster, and A. J. Ringrose-Voase, 515–524, Collingwood: CSIRO Publishing.
- Imhof, M., M. Cox, A. Fadersen, W. Harvey, S. Thompson, D. Rees, and C. Pettit. 2011. “Natural Resource Knowledge and Information Management via the Victorian Resources Online Website.” Future Internet 3 (4): 248–280. doi:10.3390/fi3040248.
- Imhof, M. P., M. T. Cox, D. W. Harvey, G. E. Heemskerk, and C. J. Pettit. 2012. “Landscape Visualization on the Internet.” ISPRS Annals of Photogrammetry, Remote Sensing and Spatial Information Sciences I-2: 141–146. doi:0.5194/isprsannals-I-2-141-2012.
- Knapp, L. 1995. “A Task Analysis Approach to the Visualization of Geographic Data.” In Cognitive Aspects of Human Computer Interaction for Geographic Information Systems, edited by T. L. Nygeres, D. M. Mark, R. Laurini, and M. J. Egenhofer, 355–371. Dordrecht: Kluwer Academic. doi:10.1007/978-94-011-0103-5_25.
- Landa, E. R. 2004. “Albert H. Munsell: A Sense of Color at the Interface of Art.” Soil Science 169 (2): 83–89. doi:10.1097/01.ss.0000117789.98510.30.
- Lenneberg, E. H. 1961. “Color Naming, Color Recognition, Color Discrimination: A re-Appraisal.” Perceptual and Motor Skills 12 (3): 375–382. doi:10.2466/pms.1961.12.3.375.
- Li, X., A. Çöltekin, and M.-J. Kraak. 2010. “Visual Exploration of Eye Movement Data Using the Space-Time-Cube.” Lecture Notes in Computer Science 6292: 295–309. doi:10.1007/978-3-642-15300-6_21.
- McDonald, R. C. 1979. “Forum: A National Soil Survey: The Groundwork for Tomorrow’s Australia.” Journal of the Australian Institute of Agricultural Science 45 (3): 179–186.
- Miller, G. A. 1956. “The Magical Number Seven, Plus or Minus Two: Some Limits on our Capacity for Processing Information.” Psychological Review 63 (2): 81–97. doi:10.1037/h0043158.
- Munsell, A. H. 1905. A Color Notation. Boston, MA: G.H. Ellis Company.
- Nussbaum, M., L. Ettlin, A. Çöltekin, B. Suter, and M. Egli. 2011. “The Relevance of Scale in Soil Maps.” BGS Bulletin 32: 63–70.
- Ooms, K., P. De Maeyer, and V. Fack. 2013. “Study of the Attentive Behavior of Novice and Expert Map Users Using Eye Tracking.” Cartography and Geographic Information Science 41 (1): 37–54. doi:10.1080/15230406.2013.860255.
- Rautenbach, V., S. Coetzee, and A. Çöltekin. 2016. “Development and Evaluation of a Specialized Task Taxonomy for Spatial Planning – A map Literacy Experiment with Topographic Maps.” ISPRS Journal of Photogrammetry and Remote Sensing. Advance Online Publication. doi:0.1016/j.isprsjprs.2016.06.013.
- Richter, K.-F., M. Tomko, and A. Çöltekin. 2015. “Are we There Yet? Spatial Cognitive Engineering for Situated Human-Computer Interaction.” In CESIP 2015: Cognitive Engineering for Spatial Information Processes: From User Interfaces to Model-driven Design. Workshop at COSIT 2015, October 12. Santa Fe, NM.
- Russo, P., C. Pettit, A. Çöltekin, M. Imhof, M. Cox, and C. Bayliss. 2014. “Understanding Soil Acidification Process Using Animation and Text: An Empirical User Evaluation with Eye Tracking.” In Cartography from Pole to Pole – Lecture Notes in Geoinformation and Cartography, edited by M. Buchroithner, N. Prechtel, and D. Burghardt, 431–448. Berlin: Springer-Verlag. doi:10.1007/978-3-642-32618-9_31.
- Sargeant, I., and M. Imhof. 2000. Major Agricultural Soils of the Maffra Region. Melbourne: Department of Natural Resources and Environment.
- Schnürer, R., R. Sieber, and A. Çöltekin. 2015. “The Next Generation of Atlas User Interfaces: A User Study with ‘Digital Natives’.” In Modern Trends in Cartography – Lecture Notes in Geoinformation and Cartography, edited by J. Brus, A. Vondrakova, and V. Vozenilek, 23–36. Berlin: Springer-Verlag.
- Slocum, T. A., C. Blok, B. Jiang, A. Koussoulakou, D. R. Montello, S. Fuhrmann, and N. R. Hedley. 2001. “Cognitive and Usability Issues in Geovisualization.” Cartography and Geographic Information Science 28 (1): 61–75. doi:10.1559/152304001782173998.
- Sombroek, W. G., and R. F. van de Weg. 1980. Some Considerations on Quality and Readability of Soil Maps and Their Legends. Wageningen: International Soil Museum Annual Report. ISIRIC.
- Valentine, K., W. Naughton, and M. Navai. 1981. “A Questionnaire to Users of Soil Maps in British Columbia: Results and Implications for Design and Content.” Canadian Journal of Soil Science 61 (1): 123–135. doi:10.4141/cjss81-013.
- Verghese, P. 2001. “Visual Search and Attention.” Neuron 31 (4): 523–535. doi:10.1016/S0896-6273(01)00392-0.
- Viscarra Rossel, R. A., B. Minasny, P. Roudier, and A. B. McBratney. 2006. “Colour Space Models for Soil Science.” Geoderma 133 (34): 320–337. doi:10.1016/j.geoderma.2005.07.017.
- Yarbus, A. L. 1967. Eye Movements and Vision. New York: Plenum Press. doi:10.1007/978-1-4899-5379-7.