
ABSTRACT
Permafrost is one of the largest elements of the terrestrial cryosphere and is extremely sensitive to climate change. Based on mean annual ground temperature (MAGT) data from 189 boreholes on the Qinghai–Tibet Plateau (QTP), terrain factors, and climate data from China Meteorological Forcing Dataset, we propose a new mean annual ground air temperature (MAGAT) statistical model between meteorological parameters with subsurface temperatures to simulate permafrost distribution and variation of MAGT on the QTP over the past three decades (1981–2010). Validation of the model with MAGT data from 13 boreholes and permafrost maps of the QTP indicated that the MAGAT model is applicable to simulate the distribution and evolution of permafrost on the QTP. Simulation results show that the spatiotemporal MAGT of permafrost significantly increased by 0.37°C, or 0.25°C/10 yr, and the total area of permafrost decreased by 2.48 × 10⁵ km2 on the QTP over the past three decades. Regionally, the changes of permafrost in the southwestern QTP were greater than other regions of the QTP.
1. Introduction
The Qinghai–Tibet Plateau (QTP) is the highest plateau in the world, with a mean altitude above 4000 m. The QTP is the largest permafrost region at middle-low latitude in the world. Permafrost over the QTP is very sensitive to climate change (Cheng and Wu Citation2007). Permafrost temperature is a sensitive climate indicator (Lachenbruch and Marshall Citation1986), since permafrost can preserve a record of temperature changes at the Earth’s surface (Nelson Citation2003). Climate change may lead to widespread thawing of permafrost and trigger climatic feedbacks from a local to global scale and severely affect hydrology, ecosystems, infrastructure, and communities (Streletskiy, Anisimov, and Vasiliev Citation2014; Schuur et al. Citation2015; Guo and Wang Citation2016; Liljedahl et al. Citation2016). As the global climate has become warmer over the last century and is projected to undergo further warming during the next 100 years (Meehl et al. Citation2007; Stocker et al. Citation2013), it is highly important to explain the characteristics and variation of permafrost temperature, and determine the evolution of permafrost changes on the QTP.
The QTP is subject to a typical high-altitude permafrost with the characteristic of three-dimensional zonality (Cheng Citation1984). The vertical zonality affects water and heat conditions, the longitude zonality affects water vapour sources and the status of atmospheric circulation, and the latitude zonality affects the difference in solar radiation from north to south. The lower limit of permafrost on the QTP decreases gradually towards the north and west, approximately equivalent to mean annual air temperature (MAAT) isothermal of −2.0°C to −2.5°C (Jin et al. Citation2000). From north to south, the lower limit of permafrost increases about 150–200 m as latitude decreases 1°C and the mean annual ground temperature (MAGT) decreases 0.6–1.0°C for each 100-m rise of altitude (Zhou et al. Citation2000).
Examination of permafrost on the QTP is of practical and scientific interest, and estimations of its distribution have been provided in numerous studies (Boeckli et al. Citation2012; Cheng et al. Citation2012; Gruber Citation2012; Guo and Wang Citation2013; Guo, Wang, and Li Citation2012; Ran et al. Citation2012; Wang et al. Citation2016). Due to the data limitation, modelling based on in situ observation is a powerful tool to simulate permafrost on the QTP. At present, many simulation models have been developed; they are typically grouped into empirical statistical models and process-oriented models (Hoelzle et al. Citation2001; Li and Cheng Citation2002). Considering the randomness and certainty of permafrost models, Harris et al. (Citation2009) divided permafrost models into regionally calibrated empirical statistical models and more physically based numerical models. These simulation models mainly concentrate on permafrost distribution, but seldom focus on changes in permafrost distribution over several decades of years.
Since permafrost on the QTP is classified as high-altitude, some models are not suitable for use in this region. A set of models have been developed specifically to reflect the characteristics of high-altitude permafrost. Cheng (Citation1984) evaluated the thermal stability of high-altitude permafrost using a MAGT zonation model and divided permafrost into six categories. Li and Cheng (Citation1999) discussed the characteristics of latitude zonality of high-altitude permafrost, and established a Gaussian model. The Gaussian model can be applied to simulate the lower bounds of permafrost, and compare the corresponding local altitude to indicate whether permafrost is present or not. Wu, Li, and Li (Citation2000) simulated permafrost distribution along the Qinghai–Tibet Highway using the MAGT model. Nan, Li, and Liu (Citation2002) established a relationship between MAGT, latitude, and a digital elevation model (DEM). Wu, Li, and Li (Citation2000) and Zhao et al. (Citation2007) stated that the altitude-response model was more suitable for the QTP than the MAGT model. Li and Cheng (Citation1999) simulated the permafrost response to climate change on the QTP. Li et al. (Citation2011) simulated permafrost in the Shule River and Datong River of Qilian Mountain, China, using the equivalent-elevation model, which is based on the altitudinal model. Guo and Wang (Citation2013) simulated permafrost and seasonally frozen ground conditions of the QTP from 1981 to 2010 using the Community Land Model, version 4 (CLM4). They found that the near-surface permafrost areas are decreasing in response to the Plateau warming. Guo and Sun (Citation2015) analysed future permafrost thaw and the associated thermal settlement hazard onset timing along the Qinghai–Tibet highway/railway using high-resolution soil temperature data from the CLM4 in combination with multiple model and scenario soil temperature data from the fifth phase of the Coupled Model Inter-comparison Project (CMIP5). Their results show that soil temperature and active layer thickness increased markedly from 2006 to 2099 using the CMIP5 scenarios. Zhang et al. (Citation2015) simulated future permafrost changes under four representative concentration pathway climate scenarios based on the altitude-response model. They determined that from current to 2070, the permafrost will experience different degrees of significant degradation under the four representative concentration pathway scenarios.
However, these models simulated permafrost distribution and permafrost change under the scenarios of climate change over the QTP. These approaches neglect our need to better understand diverse response of MAGT to climate change, permafrost, and MAGT changes in different subtypes over several distinct periods of time under the scenarios of climate change. Therefore, in this paper, a new statistical model is proposed to simulate and analyse MAGT characteristics and variation, permafrost distribution and evolution in different sub-zones on the QTP from 1981 to 2010. The mean annual ground air temperature (MAGAT) model is based on MAGT, MAAT, mean annual precipitation (MAP), and downward long-wave radiation (LRad) data in combination with a DEM. We validated the MAGAT model based on some MAGT data and maps, through which we can determine whether the MAGAT model is able to accurately simulate MAGT and permafrost evolution on the QTP.
2. Methods and data acquisition
2.1. Study region
The total area of the QTP is about 2.60 × 10⁶ km2, which accounts for approximately a quarter of the total area of the Chinese mainland (Zhang, Li, and Zheng Citation2002). We use the boundary of the 1:3,000,000 Permafrost Map on the QTP as the study region’s boundary, which was compiled by Lanzhou Institute of Glaciology and Geocryology, Chinese Academy of Sciences to support basic research on cryospheric dynamics in China (Li and Cheng Citation1996). The map is a compound of field data, literature, aerial photographs, satellite images, and many other relevant maps, and extends from 73°E to 105.6°E and from 25°N to 41°N ().
Figure 1. 1: 3,000,000 Permafrost Map on the QTP, and the MAGT data points (revised from Li and Cheng Citation1996).
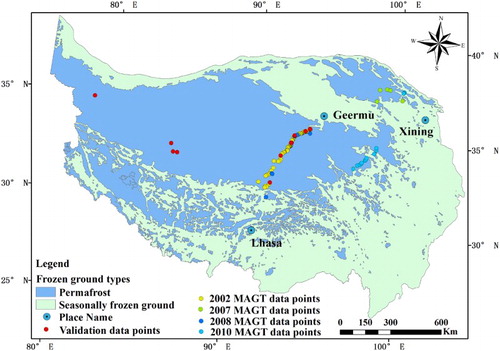
Excluding the southwest of the QTP, which has a mean daily air temperature above 0°C, there is wide distribution of permafrost. The total area of permafrost on the QTP is about 1.5 × 10⁶ km2, which accounts for approximately 70% of the total area of Chinese permafrost (Nan, Li, and Cheng Citation2005). Furthermore, glaciers and lakes are scattered on the QTP, which are about 4.66 × 10⁴ km2 (Li et al. Citation1986) and 2.42 × 10⁴ km2 in area, respectively (Yang et al. Citation1983). Thus, the areas of glaciers and lakes are neglected in this study.
In Chinese permafrost classification, permafrost can be divided into continuous and discontinuous zones (Cheng and Wang Citation1982; Jin et al. Citation2008). The continuous permafrost zone is consistent with the International Permafrost Association permafrost classification (Brown et al. Citation1997). Considering the permafrost thermal stability to climate change and engineering activities, permafrost is divided into extremely stable, stable, substable, transition, unstable, and extremely unstable permafrost, based on air temperature and MAGT () (Cheng and Wang Citation1982). In this article, we use this classification to study the response of permafrost thermal stability to climate change from 1981 to 2010.
Table 1. MAGT-based on permafrost types in the QTP (Cheng and Wang Citation1982).
2.2. Data
2.2.1. MAGT
The MAGT data used in this study were mainly obtained from the borehole temperatures of the observation sites along the Qinghai–Tibet Railway, and in source areas of the Yellow River and Datong River in the Qilian Mountains (, ). Furthermore, we obtained additional MAGT data from 13 boreholes to validate the MAGAT model, including soil temperature monitoring data of nine sites along the Qinghai–Tibet Highway, one site in Tianshuihai in the western part of the QTP, and three sites in the Gaize district (). Soil temperature measurements were taken continuously at all sites at depths of between 0.5 and 15 m.
Table 2. The information of MAGT data.
2.2.2. Meteorological data
The meteorological data used in this study include MAAT, MAP, and LRad on the QTP. These data were mainly provided by the China Meteorological Forcing Dataset, developed by the Data Assimilation and Modelling Center for Tibetan Multi-spheres, Institute of Tibetan Plateau Research, Chinese Academy of Sciences (Yang et al. Citation2010). The temporal and spatial resolution of this data set was every 3 h and 0.1 × 0.1° in longitude and latitude from 1981 to 2010, covering the entire region of China. The data were constructed by merging observations from 740 meteorological stations with the corresponding Princeton meteorological forcing data (Sheffield, Goteti, and Wood Citation2006), the Tropical Rainfall Measuring Mission 3B42 precipitation products (Huffman et al. Citation2007), the Asian Precipitation-Highly Resolved Observational Data Integration Towards Evaluation of the Water Resources project (Yatagai et al. Citation2009), and the Global Energy and Water Cycle Experiment-Surface Radiation Budget short-wave radiation data set (Pinker and Laszlo Citation1992). The combined dataset was compared with site observations from the Global Energy and Water Cycle Experiment/Asian Monsoon Experiment (GAME-Tibet) and the Coordinated Enhanced Observing Period/Asia-Australia Monsoon Project on the Tibetan Plateau (CAMP-Tibet) (He Citation2010). The dataset has also been used in other research (Guo and Wang Citation2013; Xue et al. Citation2013; Zhang et al. Citation2013; Gao et al. Citation2015). In our study, the 3 h data were averaged to provide annual mean data from 1981 to 2010. We interpolated it into raster data using kriging method, and then we extract MAAT, LRad, and MAP from it based on GIS (Li Citation1998; Li, Cheng, and Lu Citation2000).
2.2.3. Topographic conditions
The DEM data for QTP were provided by the Environmental and Ecological Science Data Center for West China (http://westdc.westgis.ac.cn/data/), at a spatial resolution of 90 m. We used the DEM data to obtain aspect data with the help of GIS. The aspect of the QTP ranged from 0° to 360° and were divided into north (0–45° or 315–360°), east (45–135°), south (135–225°), and west (225–315°). We further divided the aspects into sunny aspect (90–270°) and shaded aspect (0–90° or 270–360°).
The difference of solar radiation energy induced by aspect not only results in the diversities of MAGT, but the permafrost distribution. On the QTP, MAGT on the sunny aspect is usually higher than that on shaded aspect and the limits of permafrost on the sunny aspect is usually higher than that on shaded aspect. As aspect data cannot be used directly in the modelling, they are divided into two classes according to the solar radiation difference affected by aspect direction.
2.3. Simulation model of permafrost thermal stability
We propose a new model to simulate permafrost distribution and thermal stability on the QTP, and to study the response of permafrost change to climate change.
Climate factors and topographic conditions play an important role in permafrost distribution on the QTP. Air temperature and precipitation is a key element affecting permafrost temperature and permafrost distribution (Sannel et al. Citation2015). Slopes with different aspects receive highly variable amounts of direct incoming solar radiation, thus at the same altitude, permafrost distributions at different aspects and slopes are clearly different (Cheng Citation2004).
Solar radiation is the source of energy, short-wave radiation heats land surface, and land surface emits long-wave radiation, heats air temperature. A portion of long-wave is reflected by atmosphere to land surface, and heats land surface further. Thus, incoming short-wave solar radiation and downward long-wave radiation are the two portions energy, which heats land surface. Air temperature and downward short-wave radiation have a linear correlation, and air temperature in 2 m reflects characteristic of land surface at the same time. So, we replaced downward short-wave radiation by air temperature, and it also can reflect heat absorption of land surface.
Air temperature have reflected characteristic of land surface already. Due to the absence of high-resolution land surface information over the QTP, we can only choose air temperature to reflect heat absorption and characteristic of land surface.
Therefore, we analyse the relationships among MAGT, MAAT, MAP, continentality (C), downward short-wave radiation (SRad) and LRad (). A new MAGAT model based on multi-element regression statistical analysis of the mentioned is as follows:
where H is the altitude of the grid (m). The multiple regression coefficients are 0.827 for Model (1) and 0.705 for Model (2). The MAGAT model was built between MAGT, topographic factors, and meteorological factors. The meteorological factors were collected at different phase, which were corresponding with MAGT at same phase. The MAGAT model is empirically statistically based, which predicts equilibrium states of permafrost and cannot consider lag times associated with permafrost formation and degradation. Due to these lag effects, the model only referred the upper few metres of permafrost in the near-term (Bonnaventure and Lewkowicz Citation2011).
Table 3. Statistical correlation coefficients between different influencing factors.
3. Results
3.1. MAGT changes
Based on the MAGAT model, we calculated the MAGT distribution of the QTP during the period of 1981–2010 ( and ). The results show that the MAGT significantly increased on the QTP during the period of 1981–2010 with a change rate of spatial average MAGT over the QTP of 0.25°C/10 yr, MAGT over QTP rises by 0.37°C (). (c) indicates that there is considerable change of MAGT in space; the MAGT had a clear increasing trend in the southwestern area and middle of the QTP and there was a slight decreasing trend in the western and northwestern areas of the QTP from 1981 to 2010. There was a sharp increase of average MAGT over the QTP in 1997 (). Notably, the average rate of MAGT increase in the whole QTP was larger than that of permafrost regions (0.09°C/10 yr) from 1981 to 2010 on the QTP ().
Figure 2. MAGT on the QTP in 1981(a) and in 2010 (b) with a change rate of MAGT(c).
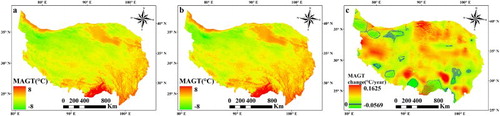
Figure 3. Variation in spatial average MAGT on the QTP (a), permafrost regions (b), and seasonally frozen ground regions (c) during the period of 1981–2010.
3.2. Permafrost changes
Based on the thermal stability of permafrost proposed by Cheng and Wang (Citation1982), we consider the MAGT larger than 0°C as the boundary between permafrost and seasonally frozen ground. With the help of GIS, reclassification of MAGT zonation was conducted to obtain the change of permafrost types and permafrost distribution and seasonally frozen ground over the past three decades on the QTP (). The areas of glaciers and lakes were neglected in this study. The area of permafrost on the QTP is listed in . The permafrost regions on the QTP strongly decreased by 2.48 × 10⁵ km2 within the past 30 years, with a decrease rate of 1.26 × 10⁴ km2/10 yr (). The decreased permafrost area was mainly on the edge of permafrost and in the central of the QTP, which may be caused by climate change and engineering activity.
Figure 4. Distribution and evolution of permafrost on the QTP over the past three decades. (a), (b), (c), and (d) are permafrost distribution of 1981, 1991, 2001, and 2010, respectively.
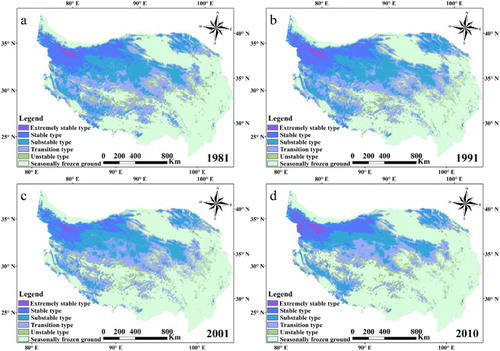
Figure 5. Change of permafrost area and seasonal frozen ground during the period of 1981–2010. The rate of area variation (×104 km2/a) in permafrost and seasonal frozen ground is −1.26 and 1.26, respectively.
Table 4. Area (× 106 km2) of permafrost on the QTP over the past three decades.
Notably, permafrost is experiencing a degradation and increase in MAGT, resulting in area change in the permafrost type. The area under permafrost, with MAGT below −0.5°C, clearly decreased, at an average rate of 3.5 × 10⁴ km2/10 yr, while the area in permafrost, with MAGT above −0.5°C, clearly increased, at a rate of 1.5 × 10⁴ km2/10 yr (). The areal decrease in permafrost, with MAGT between −5°C and 1.5°C, is greater than the areal change in permafrost, with MAGT below −5°C and MAGT between −1.5°C and −0.5°C (). However, the areal change in permafrost with MAGT above −0.5°C is maximum because permafrost with MAGT below −0.5°C degrades into permafrost, with MAGT above −0.5°C. In contrast, permafrost with MAGT above −0.5°C is degraded into seasonally frozen ground.
Figure 6. Change of permafrost subtype area during the period of 1981–2010. The rate of area variation (× 104 km2/10a) in permafrost subtypes is as follows: extremely stable type: −0.2; stable type: −4.2; substable type: −7.7; transition type: −2; and unstable type: 1.5.
4. Model validation
4.1. Comparison between the simulation maps and the map of permafrost
According to the QTP 1996 map (Li and Cheng Citation1996), we can obtain the permafrost distribution of the QTP, and we compared the 1996 map with our simulation map (). Here, we took 0°C of MAGT as the boundary of permafrost and seasonally frozen ground (Li et al. Citation2012, Citation2016; Chen et al. Citation2015). The differences are mapped in and described in .
Figure 7. Permafrost distributions on the QTP simulated by the MAGAT model (MAGAT Map) (a) and the 1: 3,000,000 Permafrost Map on the QTP (QTP 1996) (b).
Figure 8. Discrepancy in permafrost distribution on the QTP. Here, ‘0’ represents full agreement between MAGAT Map and 1996 Map, for which the area is 2.15 × 10⁶ km2 (about 82.02% of the total QTP area). Here, ‘1’ represents permafrost in the MAGAT map and seasonally frozen ground in the 1996 Map, respectively, for which the area is 0.345 × 10⁶ km2 (about 13.16% of the total QTP area) and ‘−1’ represents seasonally frozen ground in the MAGAT map and permafrost in the 1996 Map, respectively, for which the area is 0.127 × 10⁶ km2 (about 4.83% of the total QTP area).
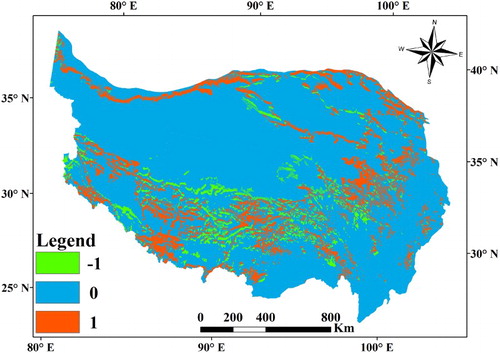
Table 5 Area comparison between the QTP 1996 and the MAGAT model.
The comparison of the 1996 Map with the MAGAT map indicates that the MAGAT map is basically consistent with the 1996 Map. The permafrost area on the QTP was 1.26 × 10⁶ km2, and the seasonally frozen ground area was 1.36 × 10⁶ km2 according to the 1996 Map, which were 48.00% and 52.00% of the total QTP area, respectively. In contrast, the permafrost area was 1.46 × 10⁶ km2, and the seasonally frozen ground area was 1.16 × 10⁶ km2 according to the MAGAT map, which were 55.72% and 44.28% of the total QTP area, respectively. Using spatial overlay analysis with GIS between the 1996 Map and the MAGAT map, we found that a discrepancy of permafrost and seasonal frozen ground between MAGAT Map and Map 1996 mainly appears near the boundary of permafrost and seasonally frozen ground ( and ). This discrepancy may indicate that local factors caused an uncertain permafrost distribution. The 1996 Map was inferred and compiled by the elevation of permafrost occurrence, but whether or not permafrost existence has partly been documented by field data. In this research, we obtained much more permafrost temperature data from boreholes than the permafrost temperature data when the 1996 Map was compiled. Therefore, the MAGAT Map is suitable for practical use in modelling the permafrost distribution and evolution on the QTP.
Table 6. Discrepancy area of permafrost on the QTP.
4.2. Comparison between the simulation results and permafrost maps
Many maps have been published to show the permafrost distribution on the QTP, such as the Permafrost Map of China (Zhou and Guo Citation1982), the 1: 4,000,000 Snow, Ice and Permafrost Map of China (Shi et al. Citation1988), and the 1: 3,000,000 Permafrost Map on the QTP (Li and Cheng Citation1996), which were all based on field survey data of different periods and on cartographical generalisations. The total areas of permafrost shown in various permafrost maps on the QTP are listed in . The differences between the simulation results and various permafrost maps shown in are small. Differences in the map age, boundaries, and scale may be the factors that lead to these inconsistencies (Wang et al. Citation2000). Considering these factors, using the MAGAT model is a feasible method to simulate the permafrost distribution and evolution on the QTP.
Table 7. Total areas of permafrost on the QTP from various permafrost maps.
4.3. Comparison with observations and model in MAGT
To validate the model further, we compare MAGT simulated by the MAGAT model with MAGT measured, which has not been taken to multi-element regression statistical analysis. These measured MAGT data include the MAGT from nine boreholes measured in 2010 along the Qinghai–Tibet Highway, one borehole measured in 2011 in Tianshuihai, western QTP, and three boreholes measured in 2011 in the Gaize district ( and ). The results show that there is a good consistency between simulated and observed data (), except in Kaixinling, ZK17 and ZK18 site data. The correlation coefficient of simulated and observed MAGT is 0.79. Discrepancies between simulated and observed data may be because the Kaixinling dataset is located on the boundary of transition type and unstable-type permafrost and the climate on the boundary is relatively active and sensitive. The ZK17 and ZK18 MAGT data were observed in 2011, while the simulated MAGT data used to validate the model were observed in 2010. Therefore, there will be some deviation between the simulated and observed MAGT.
Figure 9. Comparison between simulated and observed MAGTs at different sites.
Table 8. Location details of the 13 soil temperature monitoring sites and simulated and observed values of MAGTs on the QTP.
4.4. Model merits and limitations
The model validation process indicated that the simulation results are reasonable, and thus are a feasible method to simulate the permafrost distribution and evolution on the QTP. Compared with previous models, the MAGAT model has some merits and limitations as described below.
The input data (MAAT, LRad, MAP, and DEM) in the MAGAT model have a high precision and quality. The MAGT data are distributed in the northeastern and central part of the QTP. Thus, the MAGAT model does reflect the MAGT condition of the whole QTP. Furthermore, our study has provided change in permafrost distribution and MAGT over the past three decades.
However, there are some limitations associated with the MAGAT model. The MAGAT model assumes the equation did not change in 30 years under climate change conditions, which may cause a little deviation for the simulation results of other periods. Furthermore, the model cannot consider the lag in permafrost. In addition, because of the limitations of the MAGT data on the western part of the QTP, the model may therefore be less accurate in these areas.
5. Discussion
Based on the analysis of the change in MAAT and MAGT over the past three decades, we found that permafrost change has a clear response to climate change (), but with spatial and temporal differences in permafrost MAGT zonality (). The relationship between MAGT and MAAT on the QTP in the 1980s has a larger uncertainty and such a result may depend on insignificant climate change (Figures 10(c) and 11). In addition, permafrost change may be influenced by other factors, except air temperature. However, the significance in response of permafrost change to climate change increased from the 2000s to the 2010s (Figure 10(f) and 10(i)) because of climate change, with a rising trend in MAAT of 1.4°C/10 yr in the 2000s and 0.2°C/10 yr in the 2010s (), indicating that permafrost change is dominantly influenced by climate change.
Figure 10. The change of MAAT, MAGT in the 1980s, 1990s, 2000s and 30 years (1981–2010). The (a), (b), (c) are the 1980s, (d), (e), (f) are the 1990s, (g), (h), (i) are the 2000s, and (j), (k), (l) are 30 years. The (a), (d), (g), (j) are MAAT change, (b), (e), (h), (k) are MAGT change, and (c), (f), (i), (l) are the relation between MAAT change and MAGT change, respectively.
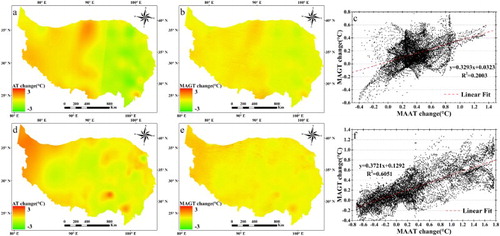
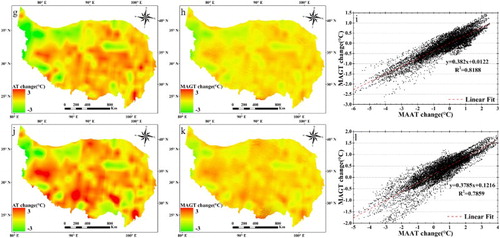
Figure 11. MAAT change during the period of 1981–2010.
However, based on the comparison of changes in the average MAGT over the QTP and over the permafrost regions over the past three decades, the increase rate of average MAGT over the QTP (0.25°C/10 yr) is larger than that over the permafrost regions (0.09°C/10 yr) (). This is because the effect of latent heat dominated the ground thermal regime. The effect of latent heat is especially pronounced in (a) ice-rich ground and (b) where subsurface temperatures are close to 0°C (Romanovsky, Smith, and Christiansen Citation2010). Therefore, the increase of MAGT in seasonally frozen ground (about 45% of the QTP) is much easier and faster than that of MAGT in permafrost (about 55% of the QTP) under the effects of climate change. In addition, the increase rate of mean air temperature in summer (JJA) (0.4°C/10 yr) is almost the same as that in winter (DJF) (0.5°C/10 yr) over the QTP.
Compared with other previous studies (Guo and Wang Citation2013, Citation2016; Zhang et al. Citation2015), permafrost on the QTP shows a decreasing trend in all these studies under the scenario of climate change. Simulated permafrost area is close to, but larger than the ranges from previous studies. From 1981 to 2010, the permafrost decreased rate is smaller than the ranges from previous studies.
As permafrost is widely distributed on the QTP, changes in the permafrost could have significant impacts on the local hydrology, land surface energy and moisture balances, carbon exchange between the land and the atmosphere, and ecosystems, as well as on engineering infrastructure (Cheng and Zhao Citation2000; Nelson, Anisimov, and Shiklomanov Citation2001; Zhang et al. Citation2005).
6. Conclusions
A new model for simulating permafrost distribution and MAGT over the QTP was proposed based the relationships among MAGT and MAAT, LRad, C, and slope aspect. Model validation showed that the MAGAT model can better simulate change in permafrost distribution and MAGT over the past three decades on the QTP than previous model. Considering the merits and limitations of our model, we conclude the following based on initial analysis and modelling in this study:
Over the past 30 years, the area of permafrost on QTP significantly decreased, with an area decrease value of 2.48 × 10⁵ km2 and a decrease rate of 1.26 × 10⁴ km2/yr. Whereas, MAGT of permafrost significantly increased on the QTP, with a spatial and temporal difference of MAGT zonality. The response of permafrost to climate change was insignificant in the 1980s, but the response of permafrost to climate change significantly increased after the 1980s. The decreased permafrost area was mainly on the edge of permafrost and in the central of the QTP, which may be caused by climate change and engineering activity.
Permafrost in subtypes is changing under the scenarios of climate change. Permafrost in substable type, stable type, and transition type significantly decreased, with an area decrease rate of 7.7 × 10⁴ km2/10a, 4.2 × 10⁴ km2/10a, and 2.0 × 10⁴ km2/10a, respectively. It is inconspicuous permafrost decreased in extremely stable type, with an area decrease rate of 0.2 × 10⁴ km2/10a. While in unstable type, permafrost is increasing due to climate change, with an area increase rate of 1.5 × 10⁴ km2/10a. Thus, we can conclude that extremely stable type, stable type, substable type, and transition type permafrost convert to unstable-type permafrost or even seasonally frozen ground under the scenarios of climate change.
It is widely hypothesised that permafrost decreased in response to climate change. Such a response may be complicated (Wu, Zhang, and Liu Citation2012), climate factors are dominant in changes of permafrost.
Acknowledgments
The meteorological data used in this study were developed by the Data Assimilation and Modeling Center for Tibetan Multi-spheres, Institute of Tibetan Plateau Research, Chinese Academy of Sciences. The figure data set is provided by Cold and Arid Regions Sciences Data Center at Lanzhou (http://westdc.westgis.ac.cn).
Disclosure statement
No potential conflict of interest was reported by the authors.
Additional information
Funding
References
- Boeckli, L., A. Brenning, S. Gruber, and J. Noetzli. 2012. “Permafrost Distribution in the European Alps: Calculation and Evaluation of an Index Map and Summary Statistics.” The Cryosphere 6 (4): 807–820. doi:10.5194/tc-6-807-2012.
- Bonnaventure, P. P., and A. G. Lewkowicz. 2011. “Modelling Climate Change Effects on the Spatial Distribution of Mountain Permafrost at Three Sites in Northwest Canada.” Climatic Change 105 (1–2): 293–312. doi:10.1007/s10584-010-9818-5.
- Brown, J., O. J. Ferrians Jr, J. A. Heginbottom, and E. S. Melnikov. 1997. Circum-Arctic Map of Permafrost and Ground-ice Conditions.
- Chen, H., Z. T. Nan, L. Zhao, Y. J. Ding, J. Chen, and Q. Q. Pang. 2015. “Noah Modelling of the Permafrost Distribution and Characteristics in the West Kunlun Area, Qinghai-Tibet Plateau, China.” Permafrost and Periglacial Processes 26 (2): 160–174. doi:10.1002/ppp.1841.
- Cheng, G. D. 1984. “Problems on Zonation of High-altitudinal Permafrost.” Acta Geographica Sinica 39 (2): 185–193.
- Cheng, G. D. 2004. “Influences of Local Factors on Permafrost Occurrence and their Implications for Qinghai-Xizang Railway Design.” Science in China Series D 47 (8): 704–709. doi:10.1007/bf02893300.
- Cheng, G. D., and S. L. Wang. 1982. “On the Zonation of High-altitude Permafrost in China.” Journal of Glaciology and Geocryology 4 (2): 1–17.
- Cheng, G. D., and T. H. Wu. 2007. “Responses of Permafrost to Climate Change and Their Environmental Significance, Qinghai-Tibet Plateau.” Journal of Geophysical Research 112 (F2). doi:10.1029/2006jf000631.
- Cheng, G. D., and L. Zhao. 2000. “The Problems Associated with Permafrost in the Development of the Qinghai-Xizang Plateau.” Quaternary Sciences 20 (6): 521–531.
- Cheng, W. M., S. M. Zhao, C. H. Zhou and X. Chen. 2012. “Simulation of the Decadal Permafrost Distribution on the Qinghai-Tibet Plateau (China) over the Past 50 Years.” Permafrost and Periglacial Processes 23 (4): 292–300. doi:10.1002/ppp.1758.
- Gao, S. R., Q. B. Wu, Z. Q. Zhang, and X. M. Xu. 2015. “Impact of Climatic Factors on Permafrost of the Qinghai–Xizang Plateau in the Time-frequency Domain.” Quaternary International 374: 110–117. doi:10.1016/j.quaint.2015.02.036.
- Gruber, S. 2012. “Derivation and Analysis of a High-resolution Estimate of Global Permafrost Zonation.” The Cryosphere 6 (1): 221–233. doi:10.5194/tc-6-221-2012.
- Guo, D. L., and J. Q. Sun. 2015. “Permafrost Thaw and Associated Settlement Hazard Onset Timing over the Qinghai-Tibet Engineering Corridor.” International Journal of Disaster Risk Science 6 (4): 347–358. doi:10.1007/s13753-015-0072-3.
- Guo, D. L., and H. J. Wang. 2013. “Simulation of Permafrost and Seasonally Frozen Ground Conditions on the Tibetan Plateau, 1981–2010.” Journal of Geophysical Research: Atmospheres 118 (11): 5216–5230. doi:10.1002/jgrd.50457.
- Guo, D. L., and H. J. Wang. 2016. “CMIP5 Permafrost Degradation Projection: A Comparison Among Different Regions.” Journal of Geophysical Research: Atmospheres 121 (9): 4499–4517. doi:10.1002/2015jd024108.
- Guo, D. L., H. J. Wang, and D. Li. 2012. “A Projection of Permafrost Degradation on the Tibetan Plateau During the 21st Century.” Journal of Geophysical Research 117 (D5). doi:10.1029/2011jd016545.
- Harris, C., L. U. Arenson, H. H. Christiansen, B. Etzelmüller, R. Frauenfelder, S. Gruber, W. Haeberli, et al. 2009. “Permafrost and Climate in Europe: Monitoring and Modelling Thermal, Geomorphological and Geotechnical Responses.” Earth-Science Reviews 92 (3–4): 117–171. doi:10.1016/j.earscirev.2008.12.002.
- He, J. 2010. “Development of a Surface Meteorological Dataset of China with High Temporal and Spatial Resolution.” Master diss., Chinese Academy of Science.
- Hoelzle, M., C. Mittaz, B. Etzelmüller, and W. Haeberli. 2001. “Surface Energy Fluxes and Distribution Models of Permafrost in European Mountain Areas: An Overview of Current Developments.” Permafrost and Periglacial Processes 12 (1): 53–68. doi:10.1002/ppp.385.
- Huffman, G. J., R. F. Adler, D. T. Bolvin, G. J. Gu, E. J. Nelkin, K. P. Bowman, Y. Hong, E. F. Stocker, and D. B. Wolff. 2007. “The TRMM Multisatellite Precipitation Analysis (TMPA): Quasi-Global, Multiyear, Combined-Sensor Precipitation Estimates at Fine Scales.” Journal of Hydrometeorology 8 (1): 38–55. doi:10.1175/JHM560.1.
- Jin, H. J., S. X. Li, S. L. Wang, and L. Zhao. 2000. “Impacts of Climatic Change on Permafrost and Cold Regions Environments in China.” Acta Geographica Sinica 55 (2): 161–173.
- Jin, H. J., Z. Wei, S. L. Wang, Q. H. Yu, L. Z. Lü, Q. B. Wu, and Y. J. Ji. 2008. “Assessment of Frozen-ground Conditions for Engineering Geology Along the Qinghai-Tibet Highway and Railway, China.” Engineering Geology 101 (3–4): 96–109. doi:10.1016/j.enggeo.2008.04.001.
- Lachenbruch, A. H., and B. V. Marshall. 1986. “Changing Climate: Geothermal Evidence from Permafrost in the Alaskan Arctic.” Science 234 (4777): 689–696. doi:10.1126/science.234.4777.689.
- Li, X. 1998. “The Cryospheric Information System and Its Applications.” PhD diss., Chinese Academy of Sciences.
- Li, S. D., and G. D. Cheng. 1996. Map of Frozen Ground on Qinghai -Xizang Plateau. Lanzhou: Gansu Culture Press.
- Li, X., and G. D. Cheng. 1999. “A GIS-aided Response Model of High-altitude Permafrost to Global Change.” Science in China Series D: Earth Sciences 42 (1): 72–79. doi: 10.1007/BF02878500
- Li, X., and G. D. Cheng. 2002. “Review on the Interaction Models Between Climatic System and Frozen Soil.” Journal of Glaciology and Geocryology 24 (3): 315–321.
- Li, X., G. D. Cheng, and L. Lu. 2000. “Comparison of Spatial Interpolation Methods.” Advance in Earth Sciences 15 (3): 260–265.
- Li, J., Y. Sheng, J. C. Wu, Z. L. Feng, S. T. Wang, Y. B. Cao, X. Y. Hu, W. Cao, J. Wang, and X. M. Zhang. 2016. “Variations in the Ground Temperatures of Permafrost in the Two Watersheds of the Interior and Eastern Qilian Mountains.” Environmental Earth Sciences 75 (6): 480. doi:10.1007/s12665-016-5330-1.
- Li, J., Y. Sheng, J. C. Wu, J. Wang, B. Zhang, B. S. Ye, X. M. Zhang, and X. Qin. 2011. “Application of the Equivalent-elevation Approach to Alipine Permafrost Distribution Models in the Upper Reaches of the Shule River, Qilian Mountain.” Journal of Glaciology and Geocryology 33 (2): 357–363.
- Li, J., Y. Sheng, J. C. Wu, J. Wang, B. Zhang, B. S. Ye, X. M. Zhang, and X. Qin. 2012. “Modeling Regional and Local-scale Permafrost Distribution in Qinghai-Tibet Plateau Using Equivalent-elevation Method.” Chinese Geographical Science 22 (3): 278–287. doi:10.1007/s11769-012-0520-6.
- Li, J. J., B. X. Zheng, X. J. Yang, Y. Q. Xie, L. Y. Zhang, Z. H. Ma, and S. Y. Xu. 1986. Glaciers of Xizang (Tibet). Beijing: Science Press.
- Liljedahl, A. K., J. Boike, R. P. Daanen, A. N. Fedorov, G. V. Frost, G. Grosse, L. D. Hinzman, et al. 2016. “Pan-Arctic Ice-wedge Degradation in Warming Permafrost and its Influence on Tundra Hydrology.” Nature Geoscience 9 (4): 312–318. doi:10.1038/ngeo2674.
- Luo, D. L. 2012. “Monitoring, mapping and modeling of permafrost and active layer processes in the Sources Areas of the Yellow River (SAYR) on Northeastern Qinghai-Tibet Plateau.” PhD diss., Chinese Academy of Sciences.
- Meehl, G. A., T. F. Stocker, W. D. Collins, P. Friedlingstein, A. T. Gaye, J. M. Gregory, A. Kitoh, et al. 2007. “Global Climate Projections.” Climate Change 3495: 747–845.
- Nan, Z. T., Z. S. Gao, S. X. Li, and T. H. Wu. 2003. “Permafrost Changes in the Northern Limit of Permafrost on the Qinghai-Tibet Plateau in the Last 30 Years.” Acta Geographica Sinica 58 (6): 817–823.
- Nan, Z. T., S. X. Li, and G. D. Cheng. 2005. “Prediction of Permafrost Distribution on the Qinghai-Tibet Plateau in the Next 50 and 100 Years.” Science in China Series D 48 (6): 797–804. doi:10.1360/03yd0258.
- Nan, Z. T., S. X. Li, and Y. Z. Liu. 2002. “Mean Annual Ground Temperature Distribution on the Tibetan Plateau:Permafrost Distribution Mapping and Further Application.” Journal of Glaciology and Geocryology 24 (2): 142–148.
- Nelson, F. E. 2003. Geocryology: Enhanced: (Un)frozen in Time.” Science 299 (5613): 1673–1675. doi: 10.1126/science.1081111
- Nelson, F. E., O. A. Anisimov, and N. I. Shiklomanov. 2001. “Subsidence Risk from Thawing Permafrost.” Nature 410: 889–890. doi: 10.1038/35073746
- Pang, Q. Q. 2011. Influences of Local Factors on Permafrost in the Qinghai-Tibet Plateau. Lanzhou: Cold and Arid Regions Environmental and Engineering Research Institute, Chinese Academy of Sciences.
- Pinker, R. T., and I. Laszlo. 1992. “Modeling Surface Solar Irradiance for Satellite Applications on a Global Scale.” Journal of Applied Meteorology 31 (2): 194–211. doi:10.1175/1520-0450(1992)031<0194:MSSIFS>2.0.CO;2.
- Ran, Y. H., X. Li, G. D. Cheng, T. J. Zhang, Q. B. Wu, H. J. Jin, and R. Jin. 2012. “Distribution of Permafrost in China: An Overview of Existing Permafrost Maps.” Permafrost and Periglacial Processes 23 (4): 322–333. doi:10.1002/ppp.1756.
- Romanovsky, V. E., S. L. Smith, and H. H. Christiansen. 2010. “Permafrost Thermal State in the Polar Northern Hemisphere During the International Polar Year 2007–2009: A Synthesis.” Permafrost and Periglacial Processes 21 (2): 106–116. doi:10.1002/ppp.689.
- Sannel, A. B. K., G. Hugelius, P. Jansson, and P. Kuhry. 2015. “Permafrost Warming in a Subarctic Peatland–Which Meteorological Controls are Most Important?” Permafrost and Periglacial Processes 27 (2): 177–188. doi:10.1002/ppp.1862.
- Schuur, E. A. G., A. D. McGuire, C. Schadel, G. Grosse, J. W. Harden, D. J. Hayes, G. Hugelius, et al. 2015. “Climate Change and the Permafrost Carbon Feedback.” Nature 520 (7546): 171–179. doi:10.1038/nature14338.
- Sheffield, J., G. Goteti, and E. F. Wood. 2006. “Development of a 50-Year High-Resolution Global Dataset of Meteorological Forcings for Land Surface Modeling.” Journal of Climate 19 (13): 3088–3111. doi:10.1175/JCLI3790.1.
- Shi, Y. F., D. S. Mi, Q. H. Feng, P. J. Li, and Z. L. Wang. 1988. Map of Snow, Ice and Frozen Ground in China. Beijing: Cartographic Publishing House.
- Stocker, T. F., D. H. Qin, G. K. Plattner, M. Tignor, S. K. Allen, J. Boschung, A. Nauels, Y. Xia, B. Bex, and B. M. Midgley. 2013. IPCC, 2013: Climate Change 2013: The Physical Science Basis. Contribution of working group I to the fifth assessment report of the intergovernmental panel on climate change.
- Streletskiy, D., O. Anisimov, and A. Vasiliev. 2014. “Permafrost Degradation.” Snow and Ice-Related Hazards, Risks, and Disasters 303–344. doi:10.1016/b978-0-12-394849-6.00010-x.
- Wang, S. L. 1997. “Study of Permafrost Degradation in the Qinghai-Xizang Plateau.” Advanced in Earth Sciences 12 (2): 164–167.
- Wang, S. L., H. J. Jin, S. X. Li, and L. Zhao. 2000. “Permafrost Degradation on the Qinghai-Tibet Plateau and its Environmental Impacts.” Permafrost and Periglacial Processes 11 (1): 43–53. doi: 10.1002/(SICI)1099-1530(200001/03)11:1<43::AID-PPP332>3.0.CO;2-H
- Wang, W., A. Rinke, J. C. Moore, X. Cui, D. Ji, Q. Li, N. Zhang, et al. 2016. “Diagnostic and Model Dependent Uncertainty of Simulated Tibetan Permafrost Area.” The Cryosphere 10 (1): 287–306. doi:10.5194/tc-10-287-2016.
- World Data Centre for Glaciology and Geocryology. 2010. The Type of Permafrost and Frozen Ground. Lanzhou: WDC for Glaciology and Geocryology.
- Wu, Q. B., X. Li, and W. J. Li. 2000. “Computer Simulation and Mapping of the Regional Distribution of Permafrost along the Qinghai-Xizang Highway.” Journal of Glaciology and Geocryology 22 (4): 323–326.
- Wu, J. C., Y. Sheng, H. Yu, and J. P. Li. 2007. “Permafrost in the Middle-East Section of Qilian Mountains (II): Characters of Permafrost.” Journal of Glaciology and Geocryology 29 (3): 426–432.
- Wu, Q. B., T. J. Zhang, and Y. Z. Liu. 2012. “Thermal State of the Active Layer and Permafrost Along the Qinghai-Xizang (Tibet) Railway from 2006 to 2010.” The Cryosphere 6 (3): 607–612. doi:10.5194/tc-6-607-2012.
- Xu, X. Z., and J. C. Wang. 1983. “Preliminary Discussion on the Distribution of Frozen Ground and its Zonality in China.” Paper presented at the proceedings of 2nd national conference on permafrost (Selection), Lanzhou Institute of Glaciology and Cryopedology, Chinese Academy of Sciences.
- Xue, B. L., L. Wang, K. Yang, L. D. Tian, J. Qin, Y. Y. Chen, L. Zhao, et al. 2013. “Modeling the Land Surface Water and Energy Cycles of a Mesoscale Watershed in the Central Tibetan Plateau During Summer with a Distributed Hydrological Model.” Journal of Geophysical Research: Atmospheres 118 (16): 8857–8868. doi:10.1002/jgrd.50696.
- Yang, K., J. He, W. J. Tang, J. Qin, and C. C. K. Cheng. 2010. “On Downward Shortwave and Longwave Radiations Over High Altitude Regions: Observation and Modeling in the Tibetan Plateau.” Agricultural and Forest Meteorology 150 (1): 38–46. doi:10.1016/j.agrformet.2009.08.004.
- Yang, Y. C., B. Y. Li, Z. S. Yin, Q. S. Zhang, F. B. Wang, K. Jing, and Z. M. Chen. 1983. Geomorphology of Xizang (Tibet). Beijing: Science Press.
- Yatagai, A., O. Arakawa, K. Kamiguchi, H. Kawamoto, M. I. Nodzu, and A. Hamada. 2009. “A 44-Year Daily Gridded Precipitation Dataset for Asia Based on a Dense Network of Rain Gauges.” Science Online Letter on the Atmosphere 5: 137–140. doi:10.2151/sola.2009-035.
- Zhang, X. M. 2012. “Study on the Relationship Between Permafrost and Alpine Ecosystem in the Source Region of Datong River in the Qilian Mountains.” PhD diss., Chinese Academy of Sciences.
- Zhang, T. J., O. W. Frauenfeld, M. C. Serreze, A. Etringer, C. Oelke, J. McCreight, R. G. Barry, et al. 2005. “Spatial and Temporal Variability in Active Layer Thickness Over the Russian Arctic Drainage Basin.” Journal of Geophysical Research 110 (D16). doi:10.1029/2004jd005642.
- Zhang, Y. L., B. Y. Li, and D. Zheng. 2002. “A Discussion on the Boundary and Area of the Tibetan Plateau in China.” Geographical Research 21: 1–8.
- Zhang, T. Z., G. H. Lin, E. Nevo, C. H. Yang, and J. P. Su. 2013. “Cytochrome b Gene Selection of Subterranean Rodent Gansu Zokor Eospalax Cansus (Rodentia, Spalacidae).” 252 (1): 118–122. doi: http://dx.doi.org/10.1016/j.jcz.2012.04.002.
- Zhang, W. J., Z. P. Ren, L. Yao, C. H. Zhou, and Y. Q. Zhu. 2015. “Numerical Modeling and Prediction of Future Response of Permafrost to Different Climate Change Scenarios on the Qinghai–Tibet Plateau.” International Journal of Digital Earth 1–15. doi:10.1080/17538947.2015.1041431.
- Zhao, S. M., W. M. Cheng, H. X. Chai, and Y. L. Qiao. 2007. “Research on the Information Extraction Method of Periglacial Geomorphology on the Qinghai-Tibet Plateau Based on Remote Sensing and SRTM: A Case Study of 1: 1,000,000 Lhasa Map Sheet (H46).” Geographical Research 26: 1175–1185.
- Zhou, Y. W., and D. X. Guo. 1982. “Pricipal Characteristics of Permafrost in China.” Journal of Glaciology and Geocryology 4 (1): 1–19.
- Zhou, Y. W., D. X. Guo, G. Q. Qiu, G. D. Cheng, and S. D. Li. 2000. Geocryology in China. Beijing: Science Press.