
ABSTRACT
Repetitive structures of a building share features in terms of geometries and appearance and, therefore, the 3D information for these structures can be transferred from one specification to another for the purpose of 3D modeling and reconstruction once they are identified as repetitive structures. In this paper, a novel approach is proposed for the detection of the repetitive structures specified by the polygons of a building’s footprints. Instead of directly operating on the polygon in 2D space, the polygon is converted into a bend angle function representation in 1D space, whereby an extrusion is represented as a closed polygon intersected by the x-axis and located above it, while an intrusion is represented as a closed polygon below the x-axis. In this way, a polygon of a footprint is decomposed into a number of extrusions and intrusions which can in turn be processed. The task of detecting any repetitive structures specified in a building’s footprints then becomes the task of clustering the intersected polygons in the bend angle function space. The extrusions/intrusions which can be placed in the same clusters can be regarded as repetitive structures. Experiments show that this proposed approach can detect repetitive structures with different sizes, orientations and complexities.
1. Introduction
Repetitive structures are quite common features of many buildings, especially structurally complicated ones such as churches, palaces, and other public and office buildings. These repeated structures often take the form of pillars of different shapes and sizes; for instance the pillars of a church ((a)). They can also be bulges on the flank of a building which may result from protuberant rooms or, perhaps, the large balconies of large modern buildings, as shown on the two example buildings of (b) (source: google map). On the 2D footprints, these repetitive structures are represented as a number of components made up of polylines all with the same shape and size.
Figure 1. Example buildings with repetitive structures.
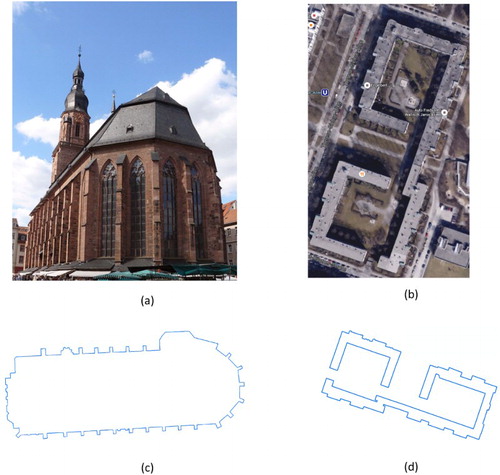
In the field of Geographic Information Science it is of great importance to detect these kinds of structures. Firstly, a number of the components of a complicated building may be occluded by trees or other buildings during the process of 3D data acquisition. In the corresponding process of 3D reconstruction, the 3D geometries of the repetitive structures which are in the occluded area can be taken from those of the related structures outside of any occlusion (Becker Citation2009). Secondly, the repetitive structures can be modeled by modeling only one of the structures with full, detailed geometries (e.g. polygons) and by just using hyperlinks for the others (Gröger et al. Citation2008). In this way, the resources required for the storage of the 3D model of the building is significantly reduced. Furthermore, the detection of repetitive structures on a footprint, or in general on a polygon, is an essential step which must be taken before the generalization operator of typification can be applied to the structure as a whole (Van Kreveld Citation2001).
On a building footprint, a bulge is represented as an extrusion while an indentation is represented as an intrusion, and the repetitive structures present form patterns of extrusions and/or intrusions. This paper describes a new method for detecting these repetitive structures. Instead of directly operating on the polygon of a building’s footprint, in the proposed approach the 2D polygon is converted into a 1D bend angle function which represents the characteristics of a polygon shape by taking a bend angle as a function of the normalized accumulated length of polygon edges. In relation to the sign of a bend angle function, an inwards turning is a negative angle while an outwards turning is a positive one. An extrusion starts and ends with inwards turnings while an intrusion starts and ends with outwards turnings. In the bend angle function space, an extrusion is then represented as a set of positive bend angles, while an intrusion is represented as a set of negative bend angles, and the bend angle function intersects with the x-axis when turning from an extrusion to an intrusion or vice versa. According to these kinds of characteristics, an extrusion is defined as a closed polygon of a bend angle function above the x-axis, while an intrusion is defined as a closed such polygon below the x-axis. A footprint then can be decomposed as a series of extrusions and intrusions that appear in turn. In the next step, these intrusions/extrusions are clustered according to the size and shape of their intersected polygons in the bend angle function space. The extrusions/intrusions in the same clusters are regarded as repetitive structures because their intersected polygons are similar in shape and size in the bend angle function space, which means their corresponding polylines in the 2D space are similar in shape and size.
The remainder of this paper is structured as follows: Section 2 gives an overview of related works; Section 3 describes the methodology, developed here, of detecting repetitive structures based on bend angle functions; Section 4 demonstrates some experimental results and Section 5 concludes the work and suggests possibilities for future work.
2. Related work
In the existing literature, repetitive structures of buildings are mostly referred to in terms of the structural elements (such as windows and balconies) in the building facades which can give rise to them. These structures are normally detected in images by tracking and analyzing local image features (Leung and Malik Citation1996; Schaffalitzky and Zisserman Citation1999; Loy and Eklundh Citation2006; Park, Collins, and Liu Citation2008; Schindler et al. Citation2008; Wenzel et al. Citation2008; Wu, Frahm, and Pollefeys Citation2010). Alternatively they may be detected in the 3D environment by using the linear and planar characteristics and the alignment distribution of the façade elements (Marshall, Lukacs, and Martin Citation2001; Bellon and Silva Citation2002; Chao and Stamos Citation2007; Sam and Stamos Citation2012).
In contrast to the abovementioned works, this paper deals with repetitive structures on buildings as being semantically located on a level higher than that of façade objects. Namely, they are façade components of buildings. Façade elements on these façade components may or may not be repetitive; however, a façade component may have the same façade elements with the same distribution as several others, and thus these components form repetitive structures when observed on the building footprint. Therefore, it would seem that the abovementioned approaches cannot detect these kinds of repetitive structures.
So far, the work which is most directly related to this essay, operating on vector data, detects symmetries on polygon features because the results of this can be used to further detect repetitive structures. The classic method for this is the string-matching approach. A polygon is represented as a string by using a sequence of angles at vertices and lengths of edges. A polygon is then mirror symmetric if the reversal of the string is a substring of the concatenation of the string with its duplication (Wolter, Woo, and Volz Citation1985). Based on this method, Haunert (Citation2011, Citation2012) developed algorithms which worked by combining techniques of shape simplification, grouping of lines and least-squares adjustment in order to detect both the symmetries of a single polygon and the symmetrical relations among polygons.
There are two drawbacks of string-matching-based approaches. First, it is sensitive to noise. Specifically, the method fails if a polygon contains non-characteristic or redundant points because, in this case, two polygon components with the same geometric structure may be encoded by different strings. This problem can be solved by simplifying the polygons before they are converted into string representation, as Haunert (Citation2012) suggested. Second, string-matching-based approaches can better handle polygons with many rectangles. However, they may encounter problems when dealing with polygons which contain curve geometry. Two curved polygon components (i.e. rooms with curved doors, curved living rooms or circle-shaped watch towers) may consist of different numbers of line segments which have different lengths and form different angles. Nevertheless, they may be similar in shape and size. In this case, they will not be found as mirror symmetric, although they are indeed mirror symmetric in the real world.
3. The methodology
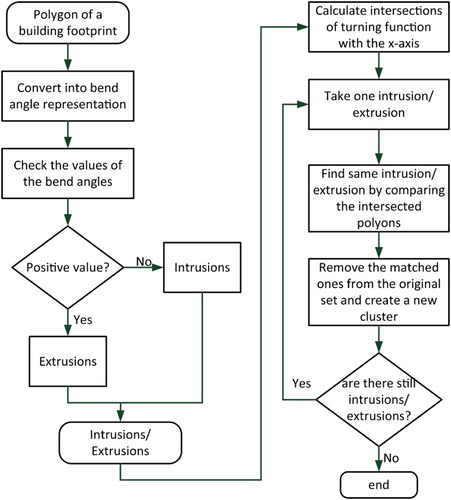
illustrates the work flow of the proposed approach. First of all, the polygon of a building footprint will be converted to a bend angle representation. The characteristics of the intrusion and extrusion structures will then be analyzed before, finally, repetitive structures will be detected based on comparing the size and shape of the extrusions and intrusions in the bend angle function domain. In this section, the technical details will be described step by step by using example building footprints.
Figure 2. The work flow of the proposed method.
3.1. Bend angle representation
Conventionally, there are two ways to represent a closed polygon: (i) by giving a list of vertices or (ii) by giving a list of line segments. Alternatively, a polygon can be represented using a list of angle-length pairs. In Arkin et al. (Citation1991), the turning function or tangent function was introduced, whereby the angle at a vertex is the accumulated tangent angle at this point while the corresponding length is the normalized accumulated length of the polygon edges up to this point. A turning function is proposed as a form to use to compare two polygons in terms of shape as it is invariant against translation, scaling and rotation. In the field of GIS, turning functions have been used to measure shape similarity in a number of different applications: e.g. evaluating the quality of map generalizations (Frank and Ester Citation2006; Fan and Meng Citation2010) and assessing the shape accuracy of building data on OpenStreetMap (OSM) (Fan et al. Citation2014).
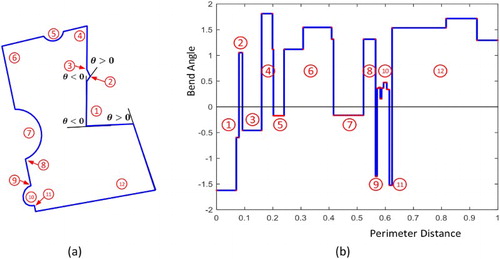
However, the method based on turning functions cannot directly be used to detect self-similarity between different components of a polygon, as the turning angle is calculated as an accumulated tangent angle and vertices at the same positions within different (but possibly repeated) partial structures, meaning they therefore have different values for their turning angle. For the method described in this paper, the tangent angle is not accumulated from the starting point. Instead, the tangent angle is directly just the bend angle at a vertex. The bend angle is calculated so that a clockwise turn is a negative angle, whereas a counterclockwise turn is a positive angle as shown in (a). Thus, the 2D polygon can be represented by a 1D bend angle function which measures the change in the angle
counterclockwise along the polygon curve as a function of the normalized curve length,
, as shown in (b).
Figure 3. Bend angle representation.
3.2. Decomposition of a polygon into intrusions and extrusions
In this work, an intrusion is defined as a set of inwards turnings while an extrusion is defined as a set of outwards turnings, and a polygon can be decomposed into a set of intrusions and extrusions representing stretches where the polyline turns significantly. Because an intrusion contains bend angles with negative values and an extrusion contains bend angles with positive values, the curve of the bend angle function interacts with the x-axis when the shape turns from an intrusion to an extrusion or inversely. Taking the intersecting component as an edge, an intrusion is then a closed polygon with rectangles below and bounded by the x-axis while an extrusion is a closed polygon with rectangles above, bounded by the x-axis.
The polygon shown in (a) can be decomposed into six intrusions and six extrusions according to the abovementioned algorithm. As shown in (a), an intrusion or extrusion can be very simply structured by only one bend angle, or complexly structured with a number of them. In the bend angle function space, a simple intrusion (numbers 3, 9, and 11) is represented as a rectangle below the x-axis while a simple extrusion (numbers 2 and 8) is a rectangle above the x-axis. A complex intrusion/extrusion contains two or even more bend angles. If these bend angles are even (e.g. in the intrusions 5 and 7), its shape in bend angle function space is a rectangle too. Otherwise, a complex intrusion/extrusion with uneven angles is represented as a complex polygon with at least six rectangles (e.g. the intrusion 1 and the extrusions 4, 6, 10 and 12).
In practice, the decomposition can be carried out without the use of a great deal of computing resources. First of all, the bend angles of all the polygon vertices are calculated. After that, the starting point is selected at one of the vertices where the sign of its bend angle is different to that of the previous vertex. Then, moving from this starting point, a curve growing process is conducted in the counterclockwise direction. The next point is grouped together with the current point if its bend angle has the same sign. Otherwise, the grouping stops and the point at which the grouping stopped is then used as the starting point for a new grouping. The entire process terminates when the last vertex has been examined and grouped. Finally, intrusions and extrusions can be identified according to the signs of the bend angles.
3.3. Detecting repetitive structures
A repetitive structure of a polygon is defined as two or more intrusions or extrusions with the same shapes and sizes. After the intrusions and extrusions on a polygon have been detected, they can be further clustered according to their shapes and sizes.
Let and
be two intrusions (or extrusions) of a polygon representing a building footprint, while
and
are the representations of these structures based on bend angle functions.
and
intersected with the x-axis and form two closed polygons called
and
.
and
are identical in shape and size, if and only if
and
are identical in shape and size. In this work,
and
are regarded as similar in shape and size if (i) their areas are similar, (ii) their rectangularity is similar and (iii) their edges, intersected with the x-axis, are similar. This is because the polygons yielded in this way contain only rectangles and at least three of their edges can be overlapped with their polygon of a Minimum Bounding Rectangle (MBR). In fact, the intersecting polygons are normally rectangles because most repetitive intrusions/extrusions contain bend angles with (almost) the same values. In this case, the intersected polygon is a rectangle.
The area of the intersected polygon can be calculated as follows:(1) where
contains
bend angles with the same sign (
) and the corresponding accumulated edges are (
); thus, the edge intersected with the x-axis is obtained by
(2) The rectangularity can be calculated as
(3) where
The clustering starts from the first intrusion (or extrusion). The other intrusions (or extrusions) are compared with the first intrusion in terms of the abovementioned three values ,
and
. If the differences are smaller than given thresholds, the corresponding structure is clustered together with the first, and the average values of
,
and
are then calculated. These will then be used for the comparison when searching for a possible third one. In the case where there is not any intrusion that is similarly structured to the first one, the first one is treated as a cluster with only one element. The remaining intrusions are clustered recursively in the same manner. The process terminates when there is only one or no intrusion left. The result is that repetitive structures are detected where there is more than one element in a cluster.
The algorithm described above can be illustrated by using an example polygon. (a) shows a polygon with 16 vertices. After the bend angles are calculated, is selected as the starting point. The polygon is then decomposed into 4 intrusions and 4 extrusions which appear in turn in the bend angle space. (b) shows the intrusions and extrusions, as represented by the bend angle functions, in an intuitively evident form. For every intersected polygon in (b), three values,
,
and
, are calculated, as listed in . It is obvious that there are three extrusions (highlighted in dark grey in ) which are similar in shape and size and two intrusions (highlighted in light grey in ) which are similar in this manner
Figure 4. Detecting repetitive structures on a polygon.
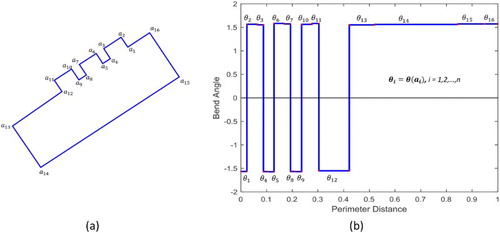
Table 1. The values of the parameters of the intersected polygons.
4. Experimental results
The algorithm has been implemented and tested by using building footprints with a variety of different shapes. The thresholds that are used to judge the similarity of the intersected polygons can only be set in relation to the accuracy of the data. The footprints used for experiments in this work come from, in the UK, the Ordnance Survey data and, in Germany, the OSM data. Images from Google Map and Google Street View have also been used as true data in order to manually determine and cluster the repetitive structures of the buildings. The investigations have shown that the proper thresholds for the data sets used can be set as: 10% of the area , as well as the length of the intersected edge
and 5% of the rectangularity.
In the following, the workings for three examples are demonstrated. In the first example, a residential building of the modern industrial era is used because it is constructed with a number of building parts that are exactly the same in shape and size. In the second example, the footprint is complicated because there are intrusions and extrusions with different shapes and sizes, and some of these intrusions and extrusions are constellated in a curved form. In the third example, a building footprint with circle-shaped repetitive structures is used for the experiment in order to see if the proposed algorithm can handle very complicated extrusions/intrusions.
(a) is the footprint of a building in Southwest London downloaded from the Ordnance Survey. It is a typical building in terms of subsidized housing, with a large area and composed of a number of building blocks which form repetitive structures on the building footprint. As show in (a), the polygon of the footprint is decomposed into seven intrusions and seven extrusions according to the values of the bend angles. In the bend angle function space ((b)), these can be distinguished easily, because the bend angle curves of the extrusions are located above the x-axis while the bend angle curve of the intrusions are located below. The parameters of the intersected polygons are calculated and listed in . Visually, the intrusions ① to ⑦ (numbering in red on (a)) are the same in shape and size. Comparing the values of the parameters of their intersected polygons, it can be seen that the values are almost the same in terms of area, rectangularity and length of the intersected edge. For this reason, they will be clustered together as repetitive intrusions. When clustering the extrusions, according to the calculated values of the intersected polygons, two clusters are formed. The first cluster contains six extrusions (numbered in green in (a)), and the extrusions within this cluster are regarded as repetitive structures on the footprint. The second cluster contains only one extrusion since its values (highlighted in light grey in ) are significantly different from those of the others. Therefore, it is discarded (as a repeated structure).
Figure 5. A building footprint of a large building in southwest London.
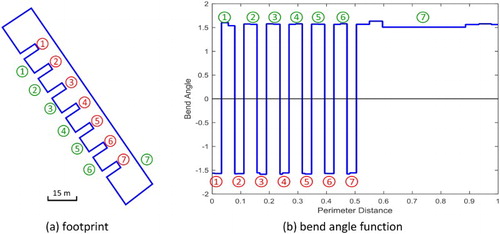
Table 2. The parameters of intersected polygons of a subsidized housing building.
shows the more complex building footprint of the Heiliggeistkirche in Heidelberg, Germany. There are 23 stone pillars around the building, as shown in the picture of the church in . In reality, these 23 pillars have the same structure in terms of size and shape. However, they have been digitized differently on the OSM. As shown in , the pillars on the south façade have been displayed as smaller than the others. Therefore, the pillars are detected as two clusters of repetitive extrusions (numbered in grey and light grey, respectively). The structures between every pair of pillars are detected as intrusions because their bend angles are negative. These intrusions are also classified into two groups because the intrusions on the curved side (numbered in black in (a)) are formed with slightly obtuse angles while the intrusions on the north and south façades are formed with rectangles. For each cluster of intrusion/extrusion, the root mean square deviations (RMSE) of the parameters of the intersected polygons are listed in . Within the cluster, the RMSEs are quite small. This means that the polygons are very similar in shape and size.
Figure 6. Detection of repetitive structures on Heiliggeistkirche.
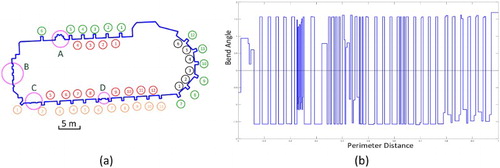
Table 3. The intrusions and extrusions on the footprint of the Heiliggeistkirche.
The footprint of the Heiliggeistkirche in Heidelberg also contains several small, more detailed, structures, as indicated by the magenta circles (A, B, C, D) shown on (a). displays these structures in detail and the clippings of their bend angle function. As shown in , the proposed approach can also find these structures to be repetitive. The polyline on (a) contains three extrusions and four intrusions. According to the parameters of the intersected polygon in the bend angle function space, the first two intrusions are regarded as similar while the last two intrusions are also clustered together. The second and third extrusions are similar and larger than the first. In reality, the three extrusions are the same in shape and size, as well as the fourth intrusion. There are two possible reasons for this kind of difference appearing in the footprint. Firstly, there is the possibility of distortion being present in the aerial image which was used for digitization onto OSM. Secondly, it is challenging to digitize repetitive structure with non-rectangular shapes using a possibly distorted aerial image. The structure on (b) is composed of two extrusions and three intrusions. The two extrusions are similar in shape and size while the three intrusions are different in size. Furthermore, two extrusions are detected and regarded as similar in shape and size on the small structure, shown on Figures 7(c, d), respectively, because the parameters of their intersected polygons are similar, as denoted in .
Figure 7. Detailed repetitive structure from the footprint of Heiliggeistkirche.
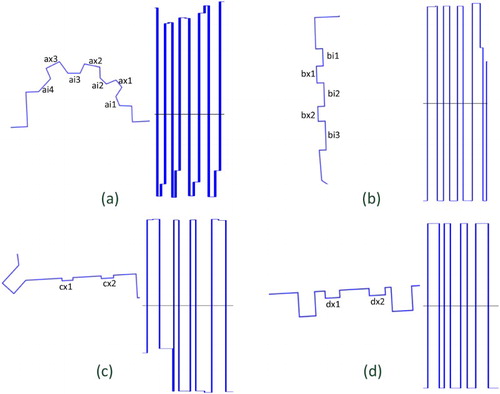
Table 4. The small structures on the footprint of the Heiliggeistkirche.
Further experiments have been carried out in order to demonstrate the detection of complicated repetitive structures. shows an example using the footprint of the Marstall building in Heidelberg, Germany. In total, three sets of repetitive structures have been detected on this building footprint: namely, two sets of extrusions (numbered in green and magenta on (a)) and one set of intrusions (numbered in red). As depicted in , in each set of repetitive structures the intersected polygons are similar in terms of the three parameters.
Figure 8. Detecting repetitive structures on the footprint of Marstall in Heidelberg.
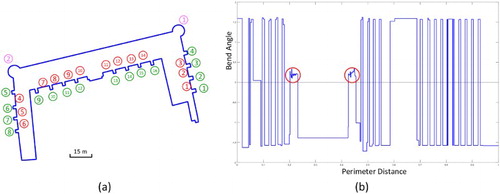
Table 5. The similarities of the intersected polygons of the repetitive structures on Marstall.
The extrusions numbered in green and the intrusions numbered in red are typical of extrusions and intrusions on building footprints and similar to those in and . The special structures in this example are the two extrusions numbered in magenta. In fact, these two structures are two watch towers at the corners of the Marstall. These two watch towers are the same and should be represented by polylines with the same shape and size on the footprint. However, they are digitized and represented in the data differently. There are 45 line segments in extrusion 1 (numbered in magenta) at the Northeast corner, while there are 38 line segments in extrusion 2 (numbered in magenta) at the Northwest corner. Correspondingly, the angles among these line segments should be different. This circumstance is reflected in the bend angle functions in the two red circles in (b). Nevertheless, the intersected polygons are similar when comparing their area, rectangularity and the length of the edge intersected with the x-axis, as shown in . Therefore, they are clustered together and regarded as two repetitive structures on the footprint of Marstall.
Table 6. The parameters of the intersected polygons of the two circle-shaped extrusions.
5. Discussion
This algorithm for the detection of repetitive structures found on a building footprint has been developed into a clustering process which searches intersected polygons with similar shapes and sizes. For this purpose, area, rectangularity and the length of the edge intersected with the x-axis are used to describe the shape and size of an intersected polygon. For general polygons with various angles and orientations, these parameters may not be enough or may lead to errors in matching. However, they are sufficient for describing the shape and size of the intersected polygons because these kinds of polygons contain only rectangles and there is no orientation issue to be considered.
As demonstrated in the previous section, thresholds are used to evaluate the similarity of the intersected polygons. In the work presented, the thresholds are evaluated empirically based on experimentation. It should be pointed out that the thresholds should be set in accordance with the data which is to be used. In the first example, the repetitive structures are detected with very high accuracy because the positional and geometric accuracy of the Ordnance Survey data is high. However, the 23 regular extrusions numbered in green and orange on (a) are clustered in two groups because these extrusions were digitized as having different sizes and with slightly different angles on OSM. Due to the heterogeneity of positional and geometric accuracy in building footprints on OSM, a set of global thresholds seems to be impossible to determine. However, additional information (such as the type of building) may help to suggest the possible characteristics of symmetry or repetitive structure of a building footprint. Subsequently, the threshold can be determined for the particular footprint by using an iterative process.
Compared with the string-matching-based method, the proposed approach is robust against noise and distortion. In reference to , the two corner structures depicted are exactly the same in the physical world but are represented with different numbers of line segments, and the angles among these line segments are also different. In this case, the string-matching-based method would fail. However, the proposed method can detect these as similarly structured components. So far, the extrusion/intrusion geometries of specific objects such as entrances have not been considered. This issue has to be addressed before an attempt is made to apply the next process (i.e. 3D modeling). For example, the intrusions 10 and 11 on (a) are regarded as similar to the other 12 intrusions (numbered in red) because they are similar in shape and size. However, the facades corresponding to these two intrusions may very likely be different to those corresponding to the others because these two intrusions are on the side of the entrance to the building.
There may be more complicated structures to be found on building footprints. For example, the whole structure shown by (a) could be regarded as an extrusion and there might be several such structures on a building footprint. In this case, a hierarchy of extrusions/intrusions could be generated by using the aggregation operator. Then repetitive structures could be detected by comparing the intersected polygons at the corresponding levels in the hierarchy. Furthermore, at each level of the hierarchy, symmetrical relations could also be detected by comparing topologies between the aggregated structures.
6. Conclusion
In this paper, a novel approach to detecting repetitive structures found on building footprints is presented. Since it is usually difficult to detect and compare structures directly from the polygon of a building footprint, the polygon is converted into a bend angle function in the proposed approach. Thus, the polygon can be easily decomposed into intrusions and extrusions, appearing in turn. In this method an intrusion is defined as a set of immediately neighboring bend angles with negative values while an extrusion is defined as a set of immediately neighboring bend angles with positive values. In the domain of the bend angle function, an intrusion can easily be distinguished from an extrusion because an intrusion is represented as a closed polygon (called an intersected polygon) below the x-axis and intersecting the bend angle function curve with the x-axis, while an extrusion is represented as a closed polygon above the x-axis. In the case that an extrusion/intrusion is similar to another one in shape and size, their intersected polygons in the bend angle function space are similar as well.
The proposed approach has been tested using building footprints with different levels of complexity. The experiments showed that the proposed approach can detect repetitive structures with a high degree of accuracy. First, because the bend angles at the beginning (way-in) vertex and ending (way-out) vertex of an intrusion/extrusion have different signs to the bend angles in-between, the shape of the intersected polygon in the bend angle function space is independent of the way-in-angle and way-out-angle. For instance, the extrusions numbered 1–6 (in green) in have different way-in-angles and way-out-angles to the extrusions numbered 7–12 (in green) in . Nevertheless, they are detected and clustered as similar extrusions. Secondly, very small intrusions and extrusions can be detected and clustered. This means that the proposed approach is robust in relation to size. Thirdly, non-rectangle-shaped structures can also be detected and clustered, as shown in the third example in Section 4.
As mentioned in the introduction, repetitive structures found on a building footprint indicate that the corresponding 3D structures should be formed repetitively as well. The proposed approach can be integrated within the process of 3D modeling and reconstruction as follows: First, the 2D building footprint will be decomposed into intrusions and extrusions. Then the intrusions and extrusions will be clustered by using the proposed approach of detecting repetitive structures. In the third step, only one of the intrusions/extrusions needs to be modeled in 3D depending upon the data available. Then the other intrusions/extrusions can be simply inferred with the same 3D geometries while taking into account considerations of orientation (for instance, by using the CityGML XLink concept (Gröger et al. Citation2008)).
Acknowledgements
The authors are grateful for the valuable discussions and comments of our colleagues at the Chair of GIScience, Heidelberg University.
Disclosure statement
No potential conflict of interest was reported by the authors.
Additional information
Funding
References
- Arkin, E. M., L. P. Chew, D. P. Huttenlocher, K. Kedem, and J. S. B. Mitchell. 1991. “An Efficiently Computable Metric for Comparing Polygonal Shapes.” In IEEE Transaction on Pattern Analysis and Machine Intelligence. Vol. 13 (3), March.
- Becker, S. 2009. “Generation and Application of Rules for Quality Dependent Facade Reconstruction.” ISPRS Journal of Photogrammetry and Remote Sensing 64: 640–653. doi: 10.1016/j.isprsjprs.2009.06.002
- Bellon, O. R. P., and L. Silva. 2002. “New Improvements to Range Image Segmentation by Edge Detection.” IEEE Signal Processing Letters 9 (2): 43–45. doi: 10.1109/97.991134
- Chao, C., and I. Stamos. 2007. “Range Image Segmentation for Modeling and Object Detection in Urban Scenes.” In The 6th International Conference on 3-D Digital Imaging and Modeling, Montreal, Canada.
- Fan, H., and L. Meng. 2010. “A Generic Approach for Simplification of Building Ground Plan.” 13th ICA Workshop on Generalisation and Multiple Representation, Zurich, September 12–13.
- Fan, H., A. Zipf, Q. Fu, and P. Neis. 2014. “Quality Assessment for Building Footprints Data on Open-StreetMap.” International Journal of Geographical Information Science 28 (4): 700–719. doi: 10.1080/13658816.2013.867495
- Frank, R., and M. Ester. 2006. “A Quantitative Similarity Measure for Maps.” In Proceedings of the 12th International Symposium on Spatial Data Handling, edited by Andreas Riedl, Wolfgang Kainz, and Gregory A. Elmes, 435–450. Vienna, Austria: Springer.
- Gröger, G., T. H. Kolbe, A. Czerwinski, and C. Nagel. 2008. “ OpenGIS® City Geography Markup Language (CityGML) Implementation Specification.” http://www.opengeospatial.org/legal/.
- Haunert, J. H. 2011. “Detecting Symmetries in Building Footprints by String Matching.” In Advancing Geoinformation Science for a Changing World, 319–336. Springer, Berlin, Heidelberg.
- Haunert, J. H. 2012. “A Symmetry Detector for Map Generalization and Urban-space Analysis.” ISPRS Journal of Photogrammetry and Remote Sensing 74: 66–77. doi: 10.1016/j.isprsjprs.2012.08.004
- Leung, T., and J. Malik. 1996. “Detecting, Localizing and Grouping Repeated Scene Elements from an Image. 1996.” In B. F. Buxton, and R. Cipolla. ECCV 1996. LNCS, 1064, 546–555. Springer, Heidelberg.
- Loy, G., and J. O. Eklundh. 2006. “Detecting Symmetry and Symmetric Constellations of Features. 2006.” In A. Leonardis, H. Bischof, and A. Pinz. ECCV 2006. LNCS, 3953, 213–225. Springer, Heidelberg.
- Marshall, D., G. Lukacs, and R. Martin. 2001. “Robust Segmentation of Primitives from Range Data in the Presence of Geometric Degeneracy.” IEEE Transactions on Pattern Analysis and Machine Intelligence 23 (3): 304–314. doi: 10.1109/34.910883
- Park, M., R. Collins, and Y. Liu. 2008. “Deformed Lattice Discovery via Efficient Mean-shift Belief Propagation.” In D. Forsyth, P. Torr, and A. Zisserman. ECCV 2008, Part II. LNCS, 5303, 474–485. Springer, Heidelberg.
- Sam, F., and I. Stamos. 2012. “Online Detection of Repeated Structures in Point Clouds of Urban Scenes for Compression and Registration.” International Journal of Computer Vision. doi:10.1007/s11263-012-0575-y.
- Schaffalitzky, F., and A. Zisserman. 1999. “Geometric Grouping of Repeated Elements within Images.” In BMVC 1999.
- Schindler, G., P. Krishnamurthy, R. Lublinerman, Y. Liu, and F. Dellaert. 2008. “Detecting and Matching Repeated Patterns for Automatic Geo-tagging in Urban Environments.” In CVPR. Los Alamitos: IEEE Computer Society Press.
- Van Kreveld, M. 2001. “Smooth Generalization for Continuous Zooming.” In Proceedings of ICC, Beijing, China. August.
- Wenzel, S., M. Drauschke, and W. Förstner. 2008. “Detection of Repeated Structures in Facade Images.” Pattern Recognition and Image Analysis 18: 406–411. doi: 10.1134/S1054661808030073
- Wolter, J. D., T. C. Woo, and R. A. Volz. 1985. “Optimal Algorithms for Symmetry Detection in Two and Three Dimensions.” The Visual Computer 1 (1): 37–48. doi: 10.1007/BF01901268
- Wu, C., J. M. Frahm, and M. Pollefeys. 2010. “Detecting Large Repetitive Structures with Salient Boundaries.” In Computer Vision–ECCV 2010, 142–155. Springer, Berlin, Heidelberg.