
ABSTRACT
The development of spaceborne Synthetic Aperture Radar (SAR) technology declares that the golden era of SAR remote sensing in archeology is approaching; however, nowadays its methodology framework is still lacking due to the inadequate case studies validated by ground-truths. In this study, we investigated the crop marks using multi-temporal Cosmo-SkyMed data acquired in 2013 by applying a two-step decision-tree classifier in conjunction with a spatial analysis in an area of archeological interest nearby the archeological site of Han-Wei capital city (1900–1500 BP), in Luoyang, China. The time-series backscattering anomalies related to the wheat growth cycle were identified and then further validated in two zones by geophysical investigations (Ground Penetration Radar and electrical measurements) and in a third zone by archeological excavations made after the SAR data acquisition. This study provides a new approach for the relic detection, shallowly buried and covered by the crop vegetation, by temporal crop marks on spaceborne SAR images. We also emphasize the necessity to establish a satellite-to-ground methodology framework for the promotion of remote-sensing technology in archeology.
1. Introduction
In the past, satellite remote sensing for archeology was strongly constrained by the low–moderate spatial resolution of data. Since the beginning of this century, remote sensing has been increasingly used in archeological applications taking advantage of the capabilities of synoptic observation, large spectral range, high-spatial and temporal resolution, penetration (for radar sensor) as well as non-invasive detection. After the common efforts of remote-sensing scientists and archeologists, several well-known archeological marks (e.g. crop, soil and shadow signs) have been established through case studies using not only optical (Crawford Citation1929; Masini and Lasaponara Citation2007; Parcak Citation2009) but also Synthetic Aperture Radar (SAR) (Adams Citation1980; Citation1982; Chen, Masini, et al., Citation2015; Chen, Lasaponara, and Masini Citation2015; Holcomb Citation1992; McCauley et al. Citation1983) data.
Archeological remains are the witness of past activities and the civilization. Generally, the occurrence of relics alters the physical properties of local scale surface as well as its surrounding landscapes, leaving us archeological traces that, although quite subtle, can be detected or recognized from remote-sensing technology (including geophysical investigations) even after centuries, in particular those have not been disturbed by anthropogenic activities.
Compared with optical remote sensing, SAR is characterized by all-day, all-weather data acquisition, sensitivity to the micro-topography and soil surface anomalies, and additional investigation capability based on polarimetry and interferometry. Those merits mentioned above hasten a new sub-discipline named ‘SAR remote sensing for archeology’ (Chen, Lasaponara, and Masini Citation2015). First attempts to use SAR data in archeological applications were made a few years afterwards the launch of the first SAR satellite; that is, ancient irrigation channels and cultivated wetlands of the Mayas on the Yucatan peninsula were detected in SEASAT data (Adams Citation1980, Citation1982). Simultaneously, pilot SAR studies were accomplished in the arid regions of the Earth; for instance, a 2-m-deep Pleistocene drainage system in the Sahara (McCauley et al. Citation1983) as well as an ancient river system buried under the desert (Holcomb Citation1992) were detected by SIR-A radar images. Limited by moderate spatial resolution, the lost town of Ubar was identified by the convergence of ancient roads instead of the observed building relics directly (Blom and Hedges Citation1997). More recently, the golden era of SAR remote sensing for archeology is approaching, represented by successful results gained in Europe (Lasaponara and Masini Citation2013), Iraq and Sudan (Patruno et al. Citation2012), South America (Cigna et al. Citation2013; Tapete et al. Citation2013) and China (Chen, Masini, et al., Citation2015; Chen et al., Citation2016), owing to the technology development in aspects of high-resolution, multi-temporal, multi-polarization and multi-frequency. However, applications still face challenges jointly caused by the complexity of data processing and the lack of systematic methodologies for acquiring and interpreting data. For example, the potentiality of the in-orbit X-band Cosmo-SkyMed and TerraSAR/TanDEM-X data for archeological prospection (Chen, Masini, et al., Citation2015; Linck et al. Citation2013) is not fully understood and needs further exploitations.
In this study, taking Han-Wei capital city as the experimental site, we firstly selected two sample categories, including a priori known (i) non-heritage and (ii) heritage marks based on the knowledge related to occurrence of archeological relics (Qian Citation1998; Citation2003). Then, we analyzed the difference of radar backscatter covering the entire growth cycle of the wheat in the site for the feature extraction and classification rule training. After that, the spatial distribution of initial hot-spots with archeological anomalies was detected by a two-step decision-tree classifier. Finally, the regions with regular topologies (e.g. linear and/or rectangular shapes) and point-clustering linked to buried archeological remains were identified, and further validated by geophysical investigations and the field campaign conducted in 2015.
2. Archeological site and SAR data
2.1. Study site
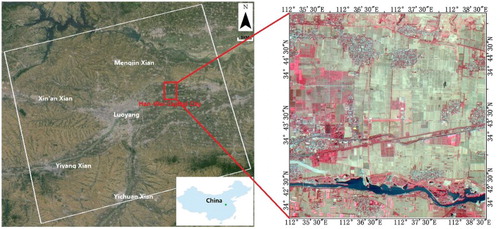
As one of the ancient imperial capitals in Central China, running along the Silk Road’s Chang'an-Tianshan Corridor (nominated a World Heritage site in June 2014), ancient Luoyang city has a long history dated back to Western Zhou (cal. 3000 BP). It was ever the capital cities in Eastern-Zhou, Eastern-Han, Cao-Wei, Northern Wei and Sui-Tang Dynasties. Luoyang is prevalent by a temperate monsoonal climate characterized by hot-humid summers and cold-dry winters. Silt and clay are well developed in the fluvial plain. In this study, we focused on the site of Han-Wei capital city (cal. 1900–1500 BP) locating in east of the modern Luoyang city with a distance of approximately 15 km, as highlighted by the red rectangle in . In the period of 2013, the whole site was occupied by the unique farmland of wheat. The ancient city was firstly declared as the capital of the Eastern Han Dynasty by Emperor Guangwu of Han in 25 AD; then the Northern Wei Dynasty moved its capital from Datong to Luoyang and started the construction of the rock-cut Longmen Grottoes in 493 AD after the collapse of Han Dynasty as well as the following chaos of civil war. Preliminary investigation made by local archeologists (Qian Citation1998, Citation2003) identified the layout of buried relics in this site with a depth of 0.5–2 m generally. Nonetheless, detailed layout of relics in this site is still poorly understood and needs further exploitation.
Figure 1. Location of Han-Wei capital city in Luoyang, China as highlighted by the red rectangle on the left (courtesy of Google Earth) and illustrated by the Chinese GF-1 false color image on the right. GF-1 image was provided by China Centre For Resources Satellite Data and Application.
2.2. Cosmo-SkyMed SAR data
Cosmo-SkyMed, an Earth observation satellite constellation comprised by four X-band SAR sensors, is developed in cooperation between Italian Space Agency and the Italian Ministry of Defense. In this study, 20 scenes of Stripmap Cosmo-SkyMed SAR data (HIMAGE mode) covering Luoyang city, Henan province, China (highlighted by the white rectangle in ) were used for the archeological prospection in Han-Wei capital city. Those scenes of SAR data were acquired in ascending orbit with HH polarization in the observation period from 27 February to 19 June 2013 (see ). The image pixel spacing is 2.264 m and 0.769 m in azimuth and range direction, respectively. Taking into account the 19.95° incidence angle, the calculated ground spatial resolution of SAR images is approximately 3 m. Note that the intense revisit cycle of SAR data (with an interval of 4, 8 and/or 16 days) covers not only the entire growth cycle but also critical growth stages (e.g. reviving, elongation, booting, heading, milky ripeness and maturity) of wheat planted on the site in 2013.
Table 1. Revisit-cycle of Cosmo-SkyMed data acquired in the ascending orbit with HH polarization and an incidence angle of 19.95°.
3. Methodology development and application
The presence of archeological features produces local variations in moisture and nutrient content, resulting in the growth anomaly of overlaid crop, which is identifiable by spectral response of optical images as well as by backscattering echoes of SAR data. Crop marks of wheat are prevailing as proved by past case studies (Agapiou et al. Citation2013; Gojda and Hejcman Citation2012), in particular when archeological remains are shallowly buried (e.g. approximately 1 m depth) by the soil indicating different physical properties (e.g. nutrients and moisture) compared to its surroundings.
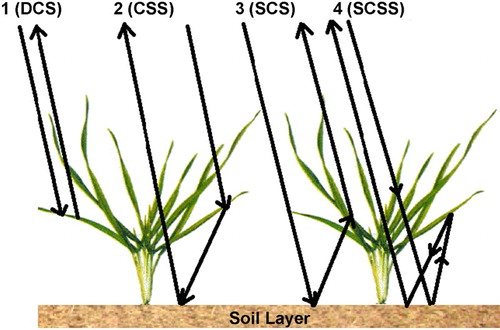
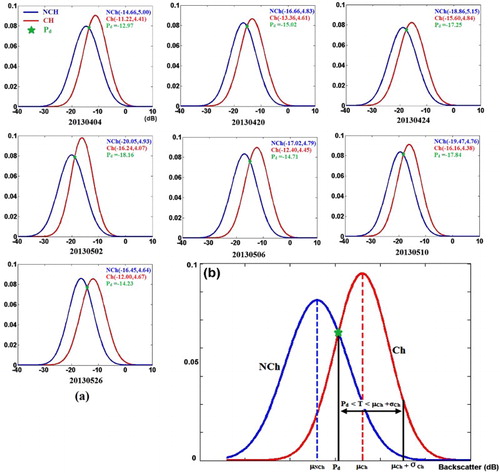
Generally, the amplitude of SAR imagery records the combination echoes of surface features observed with different backscatter mechanisms. In this study, a backscattering model comprised of four primary components was applied (Alassane et al. Citation1994; Brown et al. Citation2003; Fawwaz et al. Citation1990; Jouni, Lauri, and Martti Citation1999; Mostafa et al. Citation1992) () for understanding the backscatter mechanism of wheat crop marks in SAR images: (i) the echoes directly backscattered from the canopy, which is called Direct Canopy Scattering, (ii) the canopy-penetrated signal was reflected by the surface and then received by the sensor after a second penetration of canopy, which is called Canopy-Soil Scattering (CSS), (iii) radar signal was reflected by the surface and then received by the sensor after the penetration of canopy, which is called Soil-Canopy Scattering (SCS), (iv) the canopy-penetrated signal was firstly reflected by the surface, then the multi-routine backscattering among the surface and canopy, afterwards the echo was received by the sensor penetrating through the canopy, which is called Soil-Canopy-Soil Scattering (SCSS).
Figure 2. Scattering mechanism of the wheat.
The well-known crop marks (Crawford Citation1929; Masini and Lasaponara Citation2007) are archeological proxy indicators detectable using an optimized single-date acquisition of remote-sensing imagery (Bassani et al. Citation2009; Noviello, Ciminale, and Pasquale Citation2013). Although useful, the single-date acquisition obviously does not provide a comprehensive overview of the archeological anomalies linked to the entire growth cycle of crops. The added value of multi-temporal observation may be crucial even if up to now a few results are available from pioneering investigations (Chen, Masini, et al., Citation2015; Sabia, Masini, and Lasaponara Citation2013).
In order to identify archeological features underneath Han-Wei capital city, we proposed a methodological framework to sharpen the time-series crop marks of wheat. To this aim, a two-step supervised classification approach has been adopted. The preliminary selection of already known Cultural (Ch) and Non-Cultural (NCh) heritage Region of Interest (ROI) is made by using optical data (see ) in conjunction with the prior knowledge (Qian Citation1998; Citation2003). The first step is the identification of the optimal backscattering difference observed between Ch and NCh ROIs used as criteria to select the SAR scenes which exhibit the highest discrimination capability; the second step is the identification of the contextual thresholds for the supervised classification (for a detailed description of methodology, see Sections 3.1–3.2).
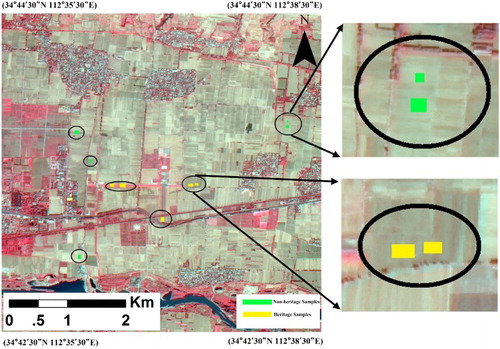
Figure 3. Satellite GF-1 false color image with a spatial resolution of 8 m acquired on 28 September, 2013. The circles and elliptical shapes include Ch and NCh ROIs, yellow and green colored, respectively. GF-1 image was provided by China Centre For Resources Satellite Data and Application.
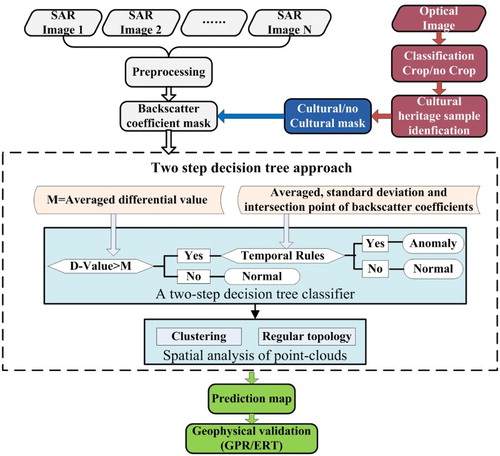
The entire data processing and validation of temporal SAR data for the archeological prospection () can be summarized as follows: first, multi-temporal Cosmo-SkyMed SAR images (see ) were co-registered (the acquisition of 20 April 2013 is the reference) using the module of Interferometric SAR Processor of GAMMA suite (http://www.gamma-rs.ch). Sub-pixel accuracy could be derived, for example, up to 0.125 pixels in this case. Then, the SAR data set was speckle suppressed using the Lee filter (Lee Citation1980), geocoded and radiometric calibrated to derive the multi-temporal maps of SAR backscatter coefficients using the modules of Land Application Tools and Differential Interferometry and Geocoding Software of GAMMA suite (http://www.gamma-rs.ch), sequentially. The GaoFen-1 (GF-1) imagery of 2014 was co-registered into the geocoded SAR data set using a second-order polynomial function (with an accuracy up to sub-pixel) estimated by tie-points manually selected. A binary map with two land covers (i: wheat farmland, and ii: others) was derived by a Maximum Likelihood supervised classification using the optical imagery. It was used for the mask generation to filter out impacts from non-crop land. After that, a prediction map of Ch remains was derived by a two-step decision-tree approach. Finally, the archeological prospection of multi-temporal SAR data was validated by geophysical investigations including ground penetrating radar (GPR) and electric resistivity tomography (ERT).
Figure 4. Flow chart of methodological approach.
3.1. Prediction mapping of archeological remains using a two-step decision-tree approach
3.1.1. Step 1: characterization of the temporal behavior observed for Ch and NCh ROIs for selection of optimal SAR scenes
A statistical analysis was conducted to process SAR backscattering of class samples mentioned above, resulting in a set of typical features extracted: (i) the temporal-averaged differential (TAD) backscattering coefficients of Ch and NCh classes and (ii) time series of averaged, standard deviation and intersection point of backscattering coefficients of Ch and NCh classes.
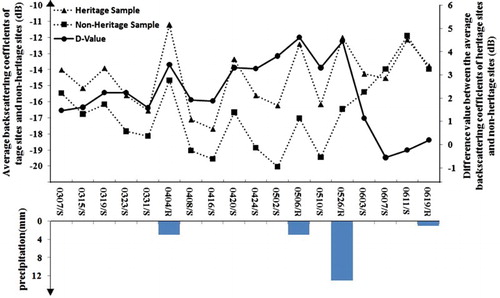
Based on the archeological map (Qian Citation1998; Citation2003) and the locations of newly excavation in the period of 2014–2015, two categories of pixel samples were selected manually on Satellite GF-1 false color image (see ), including (i) NCh with natural wheat cover and (ii) Ch with crop marks of wheat. The pixel amounts of two different samples (depicted with yellow and green mask, for Ch and NCh ROIs, in ) were basically consistent and equal to 1000. Then the averaged SAR backscatter coefficients and corresponding differential values of two samples (Ch and NCh) were calculated and analyzed on the multi-temporal Cosmo-SkyMed data set, as illustrated in . Except for the impact of weather (rainy or sunny), it is clear that the temporal variation of backscatter of two samples have similar tendencies; that is, the values of SAR backscattering firstly decrease as the wheat grows coincidently with a denser crop canopy (i.e. from the periods of reviving, elongation to booting; 7 March to 2 May, 2013), after that a reverse trend was observed in the period spanning from heading to maturity (6 May to 19 June 2013) when the density of wheat leaves shift from maximum to declining. Those phenomena implied that the amplitude SAR backscattering of wheat-land in this study was dominated by echoes from the surface and/or the interaction between the crop and the surface, including CSS, SCS and SCSS shown in . We also found that the backscatter coefficients of Ch samples were higher than non-heritages in the period from 7 March to 3 June 2013, except for the maturity period (from 7 June to 19 June 2013). Furthermore, we observed an increasing trend of the differential values particularly in the period of reviving-booting (7 March to 6 May 2013), and vice versa, we observed a significant decline of differential values in the following heading-maturity period (i.e. from 26 May to 7 June 2013).
Figure 5. Backscatter coefficients of Ch (highlighted by the dotted line with triangle nodes) and NCh (highlighted by the dotted line with square nodes) samples, and their corresponding differential values (highlighted by the solid line with circle nodes). R&S (R: Raining, S: Sunny) indicate the weather condition of SAR data acquisitions with precipitations marked by blue bars.
Archeological remains change the physical properties (e.g. nutrition and moisture content) of the upper-layer soil (Agapiou and Lysandrou Citation2015; Chen, Lasaponara, and Masini Citation2015), which results in the backscattering difference linked to anomalies of the crop growth. For instance, the porosity and nutrition of the soil is poorer with the occurrence of the archeological remains (e.g. ancient walls and road pavement), indicating a suppressed growth of the wheat represented by a higher backscattering dominated by the echoes from the surface compared to its natural surroundings ().
We also observed that the backscatter coefficients of two samples were impacted by the weather condition of SAR acquisitions; that is, a higher coefficient values in rainy days caused by a rising soil moisture and dielectric constant of the surface, such as enlarged values in the acquisitions of 4 April, 20 April, 25 May and 7 June 2013 with precipitation values of 3, 3, 13 and 1 mm, respectively (). Moreover, the amplified intensity of backscattering coefficients between Ch and NCh samples was different; that is, the former indicates a more amplified value due to a higher soil moisture because of the suppressed drainage capability on the locations with ancient walls and road pavements underlying the surface. However, whether there is a positive correlation between the amplified trend and the precipitation remains unclear limited by the insufficient observations of precipitations (e.g. in total four rainy observations in this case).
As a result of step 1, we calculated the TAD value of Ch and NCh samples, equaling to 2.3052 dB, to identify the optimum temporal windows (Agapiou et al. Citation2013) in detection crop-marks. As a consequence the scenes which on average show values greater than TAD are considered optimal and then selected for the following classification. In particular, there are seven scenes from 4 April to 26 May 2013.
3.2.2. Step 2: threshold identification for the archeological feature extraction
The result of step 1 put in evidence that the archeological anomaly related to crop marks is significant in spring season, as expected (Bassani et al. Citation2009). In order to maximize the anomaly phenomenon, the acquisition selection of data could be the first issue to suppress noise from unfavorable observations. The extracted feature (i) can be applied as the first-branch of the decision tree for the acquisition optimization of SAR data. Then, the temporal features (ii) can be applied as the second-branch of the decision tree considering the backscattering discrimination of Ch and NCh.
A decision-tree classification approach can be derived for the generation of archeological prediction maps taking advantage of branch rules established. As conventional tools in machine learning, the algorithms of decision tree use predictive models to map observations of items into target values (Rokach and Maimon Citation2008). The decision tree is constructed by leaves representing class labels as well as branches representing features that lead to class labels. Extraction of features (i.e. items for the discrimination of classes) is a prior step once the samples of classes have been selected (e.g. non-heritage and heritage with crop marks in this case).
The decision-tree classifier was applied for the generation of initial archeological maps using multi-temporal Cosmo-SkyMed SAR data (). (i) We found that the differential value of two samples in the spring season was significant (see ) based on the time-series analysis of SAR backscattering. We calculated the TAD value (equals 2.3052 dB) spanning the entire observation period and then applied this threshold (TAD > 2.3052 dB) for the optimal selection of observation acquisitions (see details in Section 3.1.1). The consequent selected period was from 4 April to 26 May 2013. (ii) We plotted the histograms of Ch and NCh samples in the seven optimally selected acquisitions with the notations of statistical indexes, including averaged, standard deviation and intersection point of backscatter coefficients, as illustrated in (a). First, a decrease trend of the averaged value in conjunction with a rise trend of the standard deviation of backscatter coefficients can be observed comparing NCh with Ch samples. The corresponding temporal-averaged values calculated for the decrease and rise are −3.74 dB and 0.38 dB, respectively. Second, regulations for the Ch classification can be obtained using the formula of backscatter coefficients the optimally selected acquisitions); that is,
((b)), where
(−12.97, −15.02, −17.25, −18.16, −14.71, −17.84 and −14.23 dB) are the intersection point of backscatter coefficients of Ch and NCh samples,
(−11.2157, −13.3569, −15.5997, −16.2369, −12.4036, −16.1644 and −12.0035 dB) and
(4.4100, 4.6068, 4.8430, 4.0729, 4.4529, 4.3776 and 4.6672 dB) are respectively average and standard deviation of backscatter coefficients of Ch samples ((a)).
Figure 6. (a) Histograms of Ch and NCh samples in seven optimally selected acquisitions with notations of averaged, standard deviation and intersection point of backscatter coefficients. (b) Diagram for the Ch classification.
3.2. Fine mapping by the spatial analysis
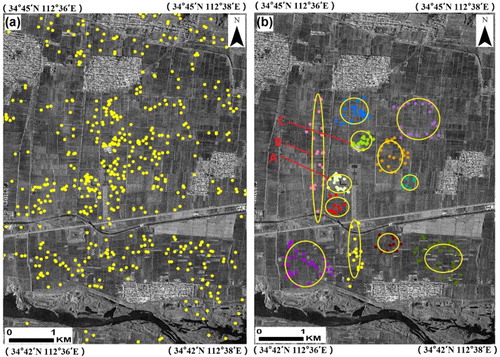
We derived the initial prediction map of archeological remains ((a)) by applying the decision-tree classifier with the two-step regulations obtained in Section 3.1. As described in Chen, Lasaponara, and Masini (Citation2015), regular geometric shape on the texture of SAR images is another informative sign for the occurrence of archeological features. For the mitigation of false alarms in conjunction with the enhancement of detection probability, two criteria (including the clustering and regular topology of point-clouds) were further applied to refine the initial classification map. In this study, regions with dense point-clouds (correspond to residential blocks) and/or the spatial distribution of points indicating regular topologies (e.g. linear features correspond to city walls or roads, and rectangular features correspond to palace foundations) were further extracted manually to enhance the detection probability of heritage remains underneath, as illustrated in (b). Note that, the spatial layout of archeological remains already-known, such as archeological maps obtained in (Qian Citation1998, Citation2003), can be complementary archives for the spatial analysis.
Figure 7. Prediction of archeological maps overlapped on the Cosmo-SkyMed SAR image, (a) initial result by applying the two-step decision-tree approach, (b) fine mapping considering the spatial distribution and topology of point-clouds extracted. Cosmo-SkyMed data were provided by the Italian Space Agency, under license agreement from Archeocosmo.
4. In situ validation using geophysical investigation and field campaigns
4.1. Geophysical techniques
Geophysical techniques are widely applied to solve archeological issues. They are capable of identifying variations of physical behavior from the subsoil related to the likely presence of remains and buried objects due to the soil electric and electromagnetic contrasts with respect to the surrounding environment (Annan Citation2009; Gaffney et al. Citation2004; Moscatelli et al. Citation2014; Neubauer et al. Citation2002; Novo et al. Citation2009; Papadopoulos et al. Citation2010; Rizzo et al. Citation2010; Zhao et al. Citation2015). To this aim, particularly useful are the GPR and ERT (Binley and Kemna Citation2015; Davis and Annan Citation1989).
GPR method is based on the reading of the electromagnetic reflected echoes occurred into the subsoil due to the presence of variations of electromagnetic impedance of the media encountered from the signal caused by variations of physical properties of the investigated medium as dielectric permittivity (ε, F/m), electrical conductivity (σ, S/m) and magnetic permeability (μ, H/m). Generally, the e-m signal is generated by an antenna or an array of antennas dragged along line to obtain a vertical section called radargram, where the x-axis corresponds on the distance covered by the antenna, while the z-axis the Two Way Time that is the windows-time within the events are recorded. Through an estimation of the velocity of propagation of the EM waves, function of ε, σ and μ of the investigated site, it is possible to quantify the dielectric permittivity of the ground and convert the data from the time domain to the spatial domain (time–depth conversion).
ERT method is based on the injection in the subsoil of a known current ‘I’, which is introduced into the ground through a couple of metallic sticks (electrodes), and by mapping the potentials ‘V’ at other electrodes in the vicinity of the current flow. Knowing ‘I and V’ by varying the position of the current and voltage electrodes, it is possible to image the distribution of the electrical properties within the subsoil.
The key of success of ERT and GPR for archeological issues is hence based on the detection of the anomalies in the electric and electromagnetic properties within the subsoil possibly connected with the presence of buried archeological remains.
However, great efforts are often required to interpret the complexity of the geophysical response due to the attenuation of signal into the soil, the limited depth of investigation and the low resolution of the adopted technique. This is especially the case of the GPR applied in very conductive soil or characterized by high content of clay (Daniels Citation2004; Davis and Annan Citation1989; Doolittle and Collins Citation1995). However, integration with ERT methods could be a good compromise to overcome GPR’s limitations in humid and conductive soils despite the latter is time-consuming and limited by the resolution. To increase the probability of a successful application of geophysical prospection, multi-methodological approaches must be adopted, according to the logic of the information complementarities and of global convergence toward a high-quality multi-parametric imaging of buried structures (Goodman and Piro Citation2013).
4.2. Geophysical prospecting results
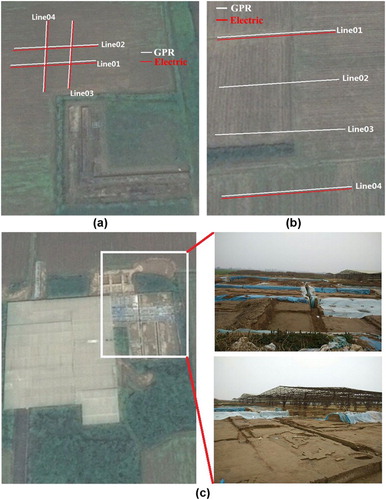
In this study, several geophysical investigations were carried out to support the interpretation of SAR data in two typical sub-regions (marked as ‘A and B’ in (b)). In sub-region ‘A’, GPR and ERT were conducted along four profiles (named lines 1–4 in (a) with a length of 76 m); and in sub-regions ‘B’, GPR prospecting on four 76 m profiles (named lines 1–4) and ERT on two profiles (named lines 1 and 4) were conducted, as illustrated in (b). High-frequency EM data were acquired by RIS MF Hi-Mod GPR (IDS-Instruments) coupled with a 100 MHz antenna and survey wheel. The acquisitions are also supported by marker located every 5 m along each profile. ERT acquisitions were made using SuperSting R8 (AGI Instruments) and multielectrodes cable of 76 channels with an interelectrodic spacing of 1 m.
Figure 8. Validation of the temporal crop marks on SAR images. In (a) lines 1–4 indicate GPR and electrical measurements conducted in sub-region A; (b) refers to sub-region B, where two electrical (1 and 4) and four GPR (1–4) profiles have been performed, (c) refers to sub-area C, where ongoing excavation surveyed during the field campaign in 2015 revealed the presence of ancient relics, thus confirming the archeological interest of this area and validating the SAR data-processing approach.
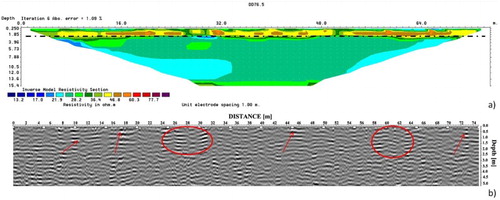
A good fit between GPR and ERT data was found, as shown in (sub-region ‘A’) and (sub-region ‘B’). In the investigations performed in sub-region ‘A’, ERTs highlight the existence of an anthropic layer extending from the surface down to ∼2 m, whose presence is also confirmed by GPR (strong localized reflections due to the possible presence of archeological structures detectable at a distance of ∼30 m from the acquisition starting point, (b)). Geophysical results in sub-region ‘B’ are comparable to those related to sub-region ‘A’, as shown in , the anthropic layers extending up to a depth of 2 m. Localized GPR reflections and high-EM reflective areas, possibly linked to archeological buried remains, are also visible.
Figure 9. ERT (upper panel) and GPR (lower panel) measurements on profile line 4, sub-zone ‘A’. ERT data were acquired in Dipole–Dipole configuration and inverted with RES2Dinv (Loke Citation2001). GPR data were processed with REFLEX-W (Sandmeier Citation2006). The black dashed line in panel (a) indicates the anthropic layer. Red arrows in panel (b) point to the localized high-amplitude EM reflection possibly linked to archeological buried remains.
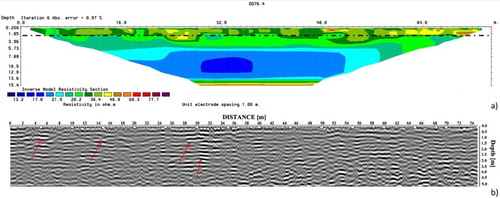
Figure 10. ERT (upper panel) and GPR (lower panel) measurements on profile line 4, sub-zone ‘B’. ERT data were acquired in Dipole–Dipole configuration and inverted with RES2Dinv (Loke Citation2001). GPR data were processed with REFLEX-W (Sandmeier Citation2006). The black dashed line in panel (a) indicates the anthropic layer. Red arrows and circles in panel (b) highlight areas with high-amplitude EM reflection possibly linked to archeological buried remains.
4.3. Direct validation by archeological excavations
Working in an area of archeological interest has many advantages, of which one is to compare results obtained by remote sensing with the archeological findings. This is the case of sub-region ‘C’ ((b)), where archeological excavations unearthed several foundations, walls and pavement in rammed earth at a depth ranging from 0.5 to 1.5 m, probably referable to Han–Wei Dynasties (see (c)) documented during a field campaign conducted on November 2015. The archeological findings confirm the archeological interest of sub-area C obtained by the multi-temporal SAR data.
5. Discussion
Satellite SAR provides data and information at a synoptic scale of observed scenarios, and thus it is an irreplaceable tool in archeological site detection, monitoring, surveying and mapping. For instance, regions with archeological remains were identified using temporal crop marks on Cosmo-SkyMed SAR data, although we lacked the prior knowledge related to the spatial distributions of those ancient remains in the Han-Wei capital city. Nonetheless, the extraction of archeological features from satellite SAR data is still a challenging task caused by the combination of two following factors: (i) SAR backscattering includes interlinked information on surface properties (e.g. soil moisture, surface roughness, target geometry and material); isolation of these diverse contributions from the overall scattering is challenging. (ii) Archeological traces on SAR data are generally too faint to detection, particularly negatively impacted by modern anthropogenic activities as well as the low signal-to-noise of SAR images (e.g. the occurrence of coherent speckle noise). Consequently, ground-based measurements such as geophysical investigations were essentially required for the validation of satellite SAR remote sensing in archeology. For instance, two geophysical prospecting approaches including GPR and the electrical methods were applied. Signals from geoarcheology confirm the detection of archeological remains buried (e.g. the foundations of ancient palace buildings) by multi-temporal Cosmo-SkyMed SAR data.
We recommended that it is time to integrate the merits of satellite (e.g. large-scale synoptic observation) and ground-based (site-focused prospection) sensors to promote the technology applications of remote sensing in archeology, as described by the analysis above. The investigation of an application-oriented methodology framework could be a pilot work in near future through a variety of archeological sites with ground-truths. For the Han-Wei capital city, automatic and/or semi-automatic detection of archeological relics on multi-temporal SAR images will be further exploited synergistically by using backscattering and interferometric coherence. Moreover, a sophisticated geoarcheological campaign (e.g. the combination of GPR, ERT and electromagnetic prospection) will be arranged for the subsurface 3D tomography in detecting more archeological features buried.
6. Conclusion
In this study, the multi-temporal X-band Cosmo-SkyMed SAR data with HIMAGE mode (3 m ground resolution) was applied for the archeological prospection in Han-Wei capital city (dated back to 1900∼1500 BP). The observation period of SAR data covers the entire growth cycle of wheat in 2013. Significant differential backscatter coefficients between natural wheat-land and wheat-land with archeological remains were firstly detected by the time-series analysis. The anomaly was defined as a new archeological sign called temporal crop marks on SAR images. Then, a two-step decision-tree approach was applied for the prediction of an archeological map in the whole site of Han-Wei capital city, identifying suspected sub-regions. The initial map was further refined by considering the spatial distribution and topology of point-clouds extracted. The SAR-derived results were further validated by the GPR, electric measurements as well as the ongoing excavation on-site. This study implies the potential of in-orbit multi-temporal SAR remote sensing in archeology. We also emphasize the significance to develop a methodology framework by integrating the merits of spaceborne and ground-based remote sensing for the technology promotion in archeological applications.
Acknowledgments
The authors wish to acknowledge the anonymous reviewers for providing helpful suggestions that greatly improved the manuscript.
Disclosure statement
No potential conflict of interest was reported by the authors.
Additional information
Funding
References
- Adams, R. E. W. 1980. “Swamps, Canals the Location of Ancient Maya Cities.” Antiquity 54 (212): 206–214. doi: 10.1017/S0003598X00043386
- Adams, R. E. W. 1982. “Ancient Maya Canals – Grids and Lattices in the Maya Jungle.” Archaeology 35: 28–35.
- Agapiou, A., D. G. Hadjimitsis, A. Sarris, A. Georgopoulos, and D. D. Alexakis. 2013. “Optimum Temporal and Spectral Window for Monitoring Crop Marks over Archaeological Remains in the Mediterranean Region.” Journal of Archaeological Science 40 (3): 1479–1492. doi: 10.1016/j.jas.2012.10.036
- Agapiou, A., and V. Lysandrou. 2015. “Remote Sensing Archaeology: Tracking and Mapping Evolution in European Scientific Literature from 1999 to 2015.” Journal of Archaeological Science: Reports 4: 192–200. doi: 10.1016/j.jasrep.2015.09.010
- Alassane, T., P. B. T. Keith, E. Geoffrey, J. B. Ron, and G. B. Brian. 1994. “Adaptation of the MIMICS Backscattering Model to the Agricultural Context-Wheat and Canola at L and C bands.” IEEE Transactions on Geoscience and Remote Sensing 32 (1): 47–61. doi: 10.1109/36.285188
- Annan, P. 2009. “Electromagnetic Principles of Ground Penetrating Radar.” In Ground Penetrating Radar: Theory and Applications, edited by H. M. Jol, 1–40. Amsterdam: Elsevier.
- Bassani, C., R. M. Cavalli, R. Goffredo, A. Palombo, S. Pascucci, and S. Pignatti. 2009. “Specific Spectral Bands for Different Land Cover Contexts to Improve the Efficiency of Remote Sensing Archaeological Prospection: The Arpi Case Study.” Journal Cultural Heritage. 10 (Supplement 1): e41–e48. doi: 10.1016/j.culher.2009.09.002
- Binley, A. M., and A. Kemna. 2015. DC Resistivity and Induced Polarization Methods. In Hydrogeophysics Volume 50 of the Series Water Science and Technology Library, edited by Y. Rubin and S. S. Hubbard, 129–156. New York: Springer.
- Blom, R., and G. R. Hedges. 1997. “Space Technology and the Discovery of the Lost City of Ubar.” In IEEE Aerospace Conference Proceedings, 19–28, Colorado, February 1–8.
- Brown, S. C. M., S. Quegan, K. Morrison, J. C. Bennett, and G. Coolmartin. 2003. “High-Resolution Measurements of Scattering in Wheat Canopies – Implications for Crop Parameter Retrieval.” IEEE Transactions on Geoscience and Remote Sensing 41 (7): 1602–1610. doi: 10.1109/TGRS.2003.814132
- Chen, F., R. Lasaponara, and N. Masini. 2015. “An Overview of Satellite Synthetic Aperture Radar Remote Sensing in Archaeology: From Site Detection to Monitoring.” Journal of Cultural Heritage. doi:10.1016/j.culher.2015.05.003.
- Chen, F., N. Masini, J. Liu, J. You, and R. Lasaponara. 2016. “Multi-Frequency Satellite Radar Imaging of Cultural Heritage: The Case Studies of the Yumen Frontier Pass and Niya Ruins in the Western Regions of the Silk Road Corridor.” International Journal of Digital Earth. doi:10.1080/17538947.2016.1181213.
- Chen, F., N. Masini, R. Yang, P. Milillo, D. Feng, and R. Lasaponara. 2015. “A Space View of Radar Archaeological Marks: First Applications of COSMO-SkyMed X-band data.” Remote Sensing 7 (1): 24–50. doi: 10.3390/rs70100024
- Cigna, F., D. Tapete, R. Lasaponara, and N. Masini. 2013. “Amplitude Change Detection with ENVISAT ASAR to Image the Cultural Landscape of the Nasca Region, Peru.” Archaeological Prospection 20 (2): 117–131. doi: 10.1002/arp.1451
- Crawford, O. G. S. 1929. “Air Photography for Archaeologists.” Ordnance Survey Professional Papers, new series, 12, HMSO, Southampton.
- Daniels, D. J. 2004. Ground Penetrating Radar. 2nd ed. London: The Institute of Electrical Engineers.
- Davis, J. L., and A. P. Annan. 1989. “Ground Penetrating Radar for High-Resolution Mapping of Soil and Rock Stratigraphy.” Geophysical Prospecting 37 (5): 531–551. doi: 10.1111/j.1365-2478.1989.tb02221.x
- Doolittle, J. A., and M. E. Collins. 1995. “Use of Soil Information to Determine Application of Ground-Penetrating Radar.” Journal of Applied Geophysics 33 (1–3): 101–108. doi: 10.1016/0926-9851(95)90033-0
- Fawwaz, T. U., S. Kamal, M. Kyle, and W. Michael. 1990. “Michigan Microware Canopy Scattering Mode.” International Journal of Remote Sensing 11 (7): 1223–1253.
- Gaffney, V., H. Patterson, S. Piro, D. Goodman, and Y. Nishimura. 2004. “Multimethodological Approach to Study and Characterise Forum Novum (Vescovio, Central Italy).” Archaeological Prospection 11 (4): 201–212. doi: 10.1002/arp.235
- Gojda, M., and M. Hejcman. 2012. “Cropmarks in Main Field Crops Enable the Identification of a Wide Spectrum of Buried Features on Archaeological Sites in Central Europe.” Journal of Archaeological Science 39 (6): 1655–1664. doi: 10.1016/j.jas.2012.01.023
- Goodman, D., and S. Piro. 2013. GPR Remote Sensing in Archaeology. London: Springer.
- Holcomb, D. W. 1992. “Shuttle Imaging Radar and Archaeological Survey in China’s Taklamakan Desert.” Journal of Field Archaeology 19 (1): 129–138.
- Jouni, T. P., K. Lauri, and T. H. Martti. 1999. “Multitemporal Behavior of L- and C-band SAR Observations of Boreal Forest.” IEEE Transactions on Geoscience and Remote Sensing 37 (2): 927–937. doi: 10.1109/36.752211
- Lasaponara, R., and N. Masini. 2013. “Satellite Synthetic Aperture Radar in Archaeology and Cultural Landscape: An Overview.” Archaeological Prospection 20 (1): 71–78. doi: 10.1002/arp.1452
- Lee, J. S. 1980. “Digital Image Enhancement and Noise Filtering by Use of Local Statistics.” IEEE Transactions on Geoscience and Remote Sensing 2 (2): 165–168.
- Linck, R., T. Busche, S. Buckreuss, J. W. E. Fassbinder, and S. Seren. 2013. “Possibilities of Archaeological Prospection by High-Resolution X-Band Satellite Radar – A Case Study from Syria.” Archaeological Prospection 20 (2): 97–108. doi: 10.1002/arp.1444
- Loke, M. H. 2001. “Tutorial: 2-D and 3-D Electrical Imaging Surveys.” In Course notes for USGS Workshop 2-D and 3-D Inversion and Modeling of Surface and Borehole Resistivity Data, Storrs, CT, March 13–16.
- Masini, N., and R. Lasaponara. 2007. “Investigating the Spectral Capability of QuickBird Data to Detect Archaeological Remains Buried Under Vegetated and Not Vegetated Areas.” Journal of Cultural Heritage 8 (1): 53–60. doi: 10.1016/j.culher.2006.06.006
- McCauley, J. F., G. G. Schaber, C. S. Breed, M. J. Grolier, C. V. Haynes, B. Issawi, C. Elachi, and R. Blom. 1983. “Subsurface Valleys and Geoarchaeology of the Eastern Sahara Revealed by Shuttle Radar.” Science 218 (4576): 1004–1020. doi: 10.1126/science.218.4576.1004
- Moscatelli, M., S. Piscitelli, S. Piro, F. Stigliano, A. Giocoli, D. Zamuner, and F. Marconi. 2014. “Integrated Geological and Geophysical Investigations to Characterize the Anthropic Layer of the Palatine Hill and Roman Forum (Rome, Italy).” Bulletin Earthquake Engineering 12 (3): 1319–1338. doi: 10.1007/s10518-013-9460-5
- Mostafa, A. K., K. F. Adrian, H. L. Roger, and S. C. Narinder. 1992. “A Microwave Scattering Model for Layered Vegetation.” IEEE Transactions on Geoscience and Remote Sensing 30 (4): 767–784. doi: 10.1109/36.158872
- Neubauer, W., A. Eder-Hinterleitner, S. Seren, and P. Melichar. 2002. “Georadar in the Roman civil town Carnuntum, Austria: An Approach for Archaeological Interpretation of GPR Data.” Archaeological Prospection 9 (3): 135–156. doi: 10.1002/arp.183
- Noviello, M., M. Ciminale, and V. D. Pasquale. 2013. “Combined Application of Pansharpening and Enhancement Methods to Improve Archaeological Cropmark Visibility and Identification in QuickBird Imagery: Two Case Studies from Apulia, Southern Italy.” Journal of Archaeological Science 40 (10): 3604–3613. doi: 10.1016/j.jas.2013.04.013
- Novo, A., R. Sala, E. Garcìa, R. Tamba, F. Muñoz, M. Solla, and H. Lorenzo. 2009. “From Celtiberians to Romans: Combined Geophysical (3D GPR and Fluxgate Gradiometer) Prospection for the Archaeological Characterization of Castro de la Magdalena (Leon, Spain).” ArchaeoSciences 33(33(suppl.)): 121–124. doi: 10.4000/archeosciences.1409
- Papadopoulos, N. G., M. J. Yi, J. H. Kim, P. Tsourlos, and G. N. Tsokas. 2010. “Geophysical Investigation of Tumuli by Means of Surface 3D Electrical Resistivity Tomography.” Journal of Applied Geophysics 70: 192–120. doi: 10.1016/j.jappgeo.2009.12.001
- Parcak, S. H. 2009. Satellite Remote Sensing for Archaeology. Abingdon: Routledge.
- Patruno, J., N. Dore, E. Pottier, and F. Sarti. 2012. “Comparison of Polarimetric SAR Sensors for Archaeological Purposes.” In Proceedings of the 3rd EARSeL Workshop ‘Advances in Remote Sensing for Archaeology and Cultural Heritage Management’, Ghent, Belgium, September 19–22.
- Qian, G. 1998. “Check and Interpretation on the Palace Name of Rounded Architectural Site in Han-Wei Luoyang City.” Cultural Relics Central China 1: 83–90 (in Chinese).
- Qian, G. 2003. “On the Layout of the Palace-City of the Han–Wei Luoyang City in the Light of the Changhemen Gate.” Archaeology 4: 165–169 (in Chinese).
- Rizzo E., N. Masini, R. Lasaponara, and G. Orefici. 2010. “Archaeo-Geophysical Methods in the Templo del Escalonado (Cahuachi, Nasca, Perù).” Near Surface Geophysics 8 (5): 433–439.
- Rokach, L., and O. Maimon. 2008. Data Mining with Decision Trees: Theory and Applications. New Jersey: World Scientific.
- Sabia, C., N. Masini, and R. Lasaponara. 2013. “On the Visibility of Crop Marks Through Seasons Preliminary Results from Multi-Date Google Earth Pictures and Ground Truth.” In Proceedings of the 4th EARSeL Workshop on “Remote Sensing for Cultural Heritage”, 377–388, Matera, Italy, June 6–7.
- Sandmeier, K. J. 2006. “REFLEXW: Version 4.0 Instruction Manual.” Karlsruhe. Accessed http://www.sandmeier-geo.de.
- Tapete, D., F. Cigna, N. Masini, and R. Lasaponara. 2013. “Prospection and Monitoring of the Archaeological Heritage of Nasca, Peru, with ENVISAT ASAR.” Archaeological Prospection 20 (2): 133–147. doi: 10.1002/arp.1449
- Zhao, W., G. Tian, E. Forte, M. Pipan, Y. Wang, X. Li, Z. Shi, and H. Liu. 2015. “Advances in GPR Data Acquisition and Analysis for Archaeology.” Geophysical Journal International 202 (1): 62–71. doi: 10.1093/gji/ggv121