
ABSTRACT
Data availability is a persistent constraint in social policy analysis. Web 2.0 technologies could provide valuable new data sources, but first, their potentials and limitations need to be investigated. This paper reports on a method using Twitter data for deriving indications of active citizenship, taken as an example of social indicators. Active citizenship is a dimension of social capital, empowering communities and reducing possibilities of social exclusion. However, classical measurements of active citizenship are generally costly and time-consuming. This paper looks at one of such classic indicators, namely, responses to the survey question ‘contacts to politicians’. It compares official survey results in Spain with findings from an analysis of Twitter data. Each method presents its own strengths and weakness, thus best results may be achieved by the combination of both. Official surveys have the clear advantage of being statistically robust and representative of a total population. Instead, Twitter data offer more timely and less costly information, with higher spatial and temporal resolution. This paper presents our full methodological workflow for analysing and comparing these two data sources. The research results advance the debate on how social media data could be mined for policy analysis.
1. Introduction
The case for revising Al Gore’s (Citation1999) vision of Digital Earth (DE) after 20 years (Goodchild et al. Citation2012) was the recognition of how much the technological, but above all, the data landscape had changed during that period. New satellites, sensors, and Internet-enabled mobile phones have had, amongst other, vast effects on the amount of data available and the mix of actors responsible for data collection, integration, and use. They now include not only the public sector but also a multitude of private sector companies, and the general public. This creates many opportunities but also challenges, including issues of data access, interoperability, ethics, privacy, and governance, as well as methodological issues to make sure that we can make sense of all these data in a meaningful way (Craglia et al. Citation2012). Given the variety of data sources now available, developing and testing analytical methods requires a patient experimental work with different sources for different purposes and in different settings to assess validity, comparability, and scalability. In a previous paper (Craglia, Ostermann, and Spinsanti Citation2012), we assessed the fitness for the purpose of data from Twitter and Flickr compared to official data in the context of forest fires. In this paper, we extend that work in the social domain, by assessing the use of data from Twitter to measure the number of people who have contacted a politician, which is one of the indicators contributing to measure the quality-of-life.
The paper is organized as follows: Section 2 provides the research context, Section 3 reviews the relevant literature, Section 4 presents the methodology, and Section 5 provides the results of the data collection and analysis. Section 6 discusses the results obtained and their comparison with official data sources, and Section 7 concludes.
2. Research context
2.1. The evolving data landscape: opportunities and challenges
‘What happens in an Internet minute’ (Desjardin Citation2016) provides a glimpse of the volume and range of different sources in todays’ Internet world. For example, every minute, there are 2.4 million Google searches, 20 million WhatsApp messages, 150 million emails sent, 700,000 Facebook logins, 350,000 tweets, and almost 3 million views on YouTube. Most of these data are generated by users themselves, who have become both data producers and users or ‘prosumers’ (Coleman, Georgiadou, and Labonte Citation2009).
Recent applications of user-generated content (UGC) range from the integration of real-time, spatially distributed data from citizens to improve the management of crisis situations (Goodchild and Glennon Citation2010; Roche, Propeck-Zimmermann, and Mericskay Citation2011), to the usage of Twitter data for improving fire detection systems (Spinsanti and Ostermann Citation2013), public health monitoring (Culotta Citation2014), or the analysis of Web photo-sharing and mobile telephony trends to track tourist flows (Girardin et al. Citation2008). The combination of UGC, official data from the public sector, and other data streams from the private sector including mobile phone data, scanning data from supermarket chains, credit card companies, and so on, is often referred to as Big Data (Laney Citation2001).
Official statisticians are making an organized international effort to evaluate how Big Data can complement official statistics (Struijs, Braaksma, and Daas Citation2014). Classically based on survey data obtained through robust statistical methods (Moser and Kalton Citation1971), official statistics might find complementary data sources on Big Data. Examples of initiatives promoting such research include the United Nations Global Working Group on Big Data for official statistics (UNStats Citation2016), the High-Level Group for the Modernization of Statistical Production and Services, from UNECE (UNECE Statistics Citation2016), and the Scheveningen Memorandum (DGINS Citation2013) adopted by the European Statistical System Committee.
2.2. New data sources for new indicators
New data sources might benefit the generation of indicators for policy-making issues that had been traditionally hampered due to data availability constraints. The measurement of quality-of-life is an excellent example in this regard. For decades its measurement has been approached by using the macroeconomic indicator Gross Domestic Product (GDP), under the premise that the wealthier a country, the higher the quality-of-life of its citizens. This GDP approach has the advantage of providing a single high-level indicator that is comparable across countries and is based on regularly collected data worldwide. On the other hand, GDP was generated as an economic indicator, and leaves aside other important dimensions of the quality-of-life (Costanza et al. Citation2009).
Aware of these limitations, the Beyond-GDP initiative (OECD Citation2013; Stiglitz, Sen, and Fitoussi Citation2009) proposes a wider set of dimensions to measure the quality-of-life, including environmental and social concerns (European Statistical System Committee Citation2011). The multidimensionality of quality-of-life poses challenges in finding sufficient comparable data to assess each dimension. Here is where new data sources could offer opportunities but, as indicated by the UN Statistics Division (United Nations Citation2014), major challenges in using these new (Big) data sources relate to data quality, representativeness, volatility, and dimensionality, as well as new methods for data processing and analysis.
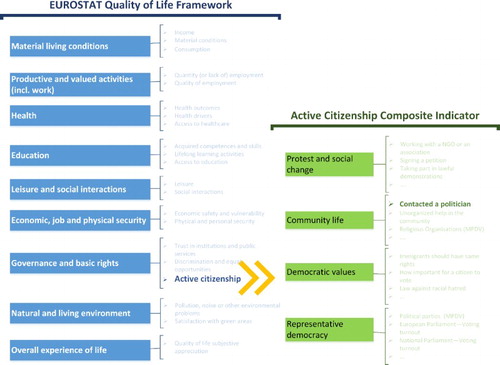
Within this context, our work aims at contributing to the research in this field focusing on active citizenship, one of the dimensions of the quality-of-life, as case study. shows the dimensions of quality-of-life according to the framework developed by Eurostat (Citation2016). Active citizenship is one of the indicators of Governance and Basic Rights, and is defined by Hoskins et al. (Citation2006) as: ‘participation in civil society, community and/or political life, characterized by mutual respect and non-violence and in accordance with human rights and democracy’. Based on their definition, Hoskins and Mascherini (Citation2009) developed an Active Citizenship Composite Indicator (ACCI), which include four dimensions: participation in political life, protest and social change, community life, democratic values, and representative democracy. One of the indicators proposed by ACCI to measure participation in community life is ‘contacting a politician’. This is traditionally measured through surveys with a question like: ‘How often have you contacted a politician during the last 12 months’. In this paper, we discuss a method to measure ‘contacting a politician’ using data from Twitter in three Spanish cities, and compare the results with official data from the Spanish Centre for Sociological Research.
Figure 1. Active citizenship as a variable included in the quality-of-life framework suggested by Eurostat (Citation2016) and the dimensions and variables of the Active Citizenship Composite Indicator (ACCI) suggested by Hoskins and Mascherini (Citation2009).
According to the most recent Eurobarometer on Media Use (DG COMM Citation2014), the number of social network users in Europe keeps growing. A third of Europeans uses them daily or almost daily, equally distributed among men and women, with young educated citizens as the most frequent users. The Eurobarometer report indicates also that the majority of people in all EU member states consider social networks as a way to get people interested in political affairs and ‘have your say’.
The Twitter platform, in particular, facilitates a new online political sphere where users can publicly discuss on political issues, attracting politicians, journalists, political strategists, and citizens (Ausserhofer and Maireder Citation2013). This social networking service allows instant communication by means of short messages with maximum length of 140 characters. These messages, known as ‘tweets’, enable linking messages to users (@-mentions), with internet content (URL links) and topics (#hashtags). Since the service was launched in 2006, the speed of adoption of Twitter has been impressive, reaching 316 million active users who produce around 500 million tweets per day (Twitter Citation2016). The relevant role of Twitter in political debates, in recent uprisings, such as the Arab Spring, or mass movements as the ‘indignados’ in Spain, suggests that Twitter activity may be a particularly useful way to measure ‘contacting a politician’ as a test case. Just to be clear, we are not claiming that measuring ‘contacting a politician’ via Twitter is representative of active citizenship, or quality-of-life as a whole. We are arguing instead that by testing different new data sources to measure individual indicators, and comparing the results with official sources, we can contribute to the debate about the opportunity and limitation of using such new data sources.
3. Literature review
Our review of the literature that may be relevant to our quest to use social media data (Twitter specifically) to measure one of the indicators of active citizenship has identified several studies in related subjects but only one specific to our research: Soria Ibáñez (Citation2015) addressed the degree of active citizenship by considering Twitter users’ interactions and the tone of the tweets regarding political news published by daily newspapers in Spain. Her findings support the role of Twitter as a leading alternative to traditional forms of activism. The research method proposed by Soria Ibáñez (Citation2015) is not designed to produce a quantitative indicator, and thus yields only a qualitative measure of active citizenship. In this sense, our approach tries to go further in providing a quantitative measure.
Other relevant studies found in the literature include those of Ausserhofer and Maireder (Citation2013) and of Verweij (Citation2012) who analysed a Twitter network of selected politicians and journalists in Austria and the Netherlands, respectively. Their studies show the extent to which politicians and journalist form a dense network for political debate, being mutually dependent within the network (reciprocal followers of each other), as spreading news is the main motive of both parties (also found in Larsson and Moe [Citation2012]). The self-reinforcing networking among politicians and media has led us to develop a method that tries to filter these influences out when trying to measure the contacts between citizens and politicians as discussed in Section 6.
Other studies have analysed specific political events, especially related to election periods. Bruns and Burgess (Citation2011) developed a hashtag-centred study to analyse the public Twitter behaviour in relation to the electoral campaigns during the 2012 Austrian elections. These authors considered the hashtag a key means for the public to engage with the Austrian political establishment, showing the level of activity related to the political events and media broadcasts along the electoral campaign. The disadvantage of this approach is that hashtags are highly volatile and this makes it more difficult to undertake longitudinal analysis.
A major research topic in the literature focuses on Twitter data to predict election results. However, as shown in Huberty (Citation2015), Barbera and Rivero (Citation2014), and Gayo-Avello (Citation2012), the use of Twitter for this purpose is problematic because the data are not representative of the total population, and sentiment analysis is far from robust. Cognisant of these problems, we suggest a methodology that does not require sentiment analysis as discussed in Section 6.
Regarding the Internet’s impact on citizen participation, studies, such as Ognyanova et al. (Citation2013) and Ward and Gibson (Citation2008) that examined online communities, found that online participation through social media enhances citizen engagement, generating virtual spaces for social dialogue which facilitates communication and community organization. However, the level of participation was found to increase mainly among citizens who are already engaged, while residents who were less integrated into their communities often remain disconnected from the online networks. Bekafigo and McBride (Citation2013) and Larsson (Citation2014) found similar results, but also evidences of engagement in political conversation from less conventional voices, in the later, and racial minorities, in the former, revealing Twitter as potential tool for engagement.
Finally, the review by Schober et al. (Citation2016) on social media as data source shows that the diversity of studies makes it difficult to assess the potential of new data sources to measure socio-economic phenomena. According to their findings, studies will need to present results consistently aligned with the survey data when replicating the selected method over time.
4. Methodology
To analyse the potential of Twitter data for measuring ‘contacts to politicians’, our research takes into account the number of messages that politicians receive from citizens via Twitter. Tweets containing the username of a Twitter user are notified to the target user. Thus, our research considers those tweets containing username of politicians as contacts with those politicians. We analyse the spatio-temporal distribution of the tweets containing username of politicians or government representatives, and then compare the results obtained with those of national surveys on active citizenship.
We carried out our case study in Spain. Three cities of different sizes were selected, to explore the effect of city size in the analysis: Cádiz (121,739 inhabitants), Seville (696,676 inhabitants), and Madrid (3,165,235 inhabitants) (INE Citation2014).
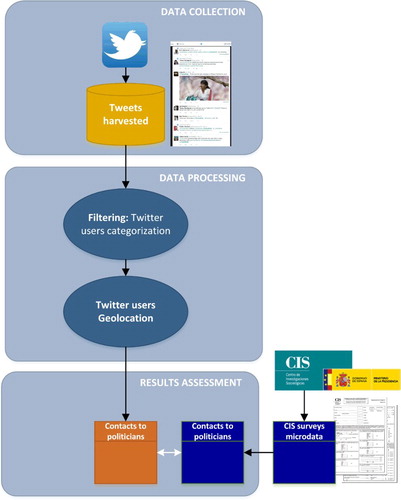
summarizes our research method from data collection to data cleaning and analysis.
Figure 2. Research method for analysing the potential of Twitter data as a source for the survey indicator ‘contacted a politician to express an opinion’.
4.1. Data specifications: Twitter data and survey data
Twitter data
Twitter users can post messages to specific users by including ‘mentions’ in their tweets. These are the combination of the ‘@’ sign with the Twitter username of the targeted user (@username). Therefore, a tweet including a mention presents ‘addressivity’, indicating an intended specific Twitter user (Honeycutt and Herring Citation2009). A user mentioned in a tweet is notified, and the tweet is publicly available through the Twitter search. As such, tweets with mention(s) can be considered direct communications, which are not private, like e-mails, but rather are messages conveyed in public view.
Accordingly, we can obtain a direct measurement of the indicator ‘contacted a politician’ by counting the number of citizens who send tweets in a certain region containing mentions of politicians and municipal representatives in that region. Our measurement method considers:
Tweets containing mentions of politicians or municipal representatives. We assume that citizens using Twitter to contact a politician or municipal representative to express their opinion would send a tweet including a mention of (i) local government representatives (those professional Twitter accounts from individuals), (ii) Twitter official accounts from municipalities to facilitate interactions with citizens (usually advertised on municipal websites), (iii) candidates for upcoming municipal and regional elections (those professional Twitter accounts from individuals), or (iv) regional and local groups of political parties participating in a recent government or candidates in upcoming elections.
Tweets from citizens. The method includes a filtering process to select only those tweets generated by Twitter user profiles categorized as individual citizens. Accordingly, messages generated by the Twitter accounts of other politicians, political parties, media, brands, or corporations are excluded.
Tweets from citizens at a specific location. With this measure, we aimed to indicate the level of citizen engagement at a specific location, in our case, the cities of Cádiz, Seville, and Madrid.
Survey data
The official data source used in this research is the periodic public opinion ‘barometers’ of the Centre for Sociological Research (in Spanish, Centro de Investigaciones Sociológicas or CIS). These are Spain’s most comprehensive data source on indicators of citizen engagement.
CIS is an autonomous organization under the Ministry of the Presidency that aims at conducting social research, usually through periodic surveys. CIS publishes monthly surveys on public opinion, called barometers, which are composed of a number of fixed questions and variable questions on specific topics. About once a year, CIS barometers include questions on citizen participation, and the responses obtained are the official data considered in this research. We are interested in the question on ‘overall participation’, asking whether the interviewee had participated during the past 12 months in various types of social or political action. ‘Contacting a politician to express an opinion’ is one of the options.
CIS barometers are designed to be statistically representative of Spanish society. Sample sizes are around 2500 citizens. Sampling is done via a multi-staged, stratified cluster procedure with proportional random selection of primary sampling units (municipalities) and secondary units (census districts). The ultimate units are the individuals selected by random routes and sex and age quotas. The stratum is representative of Spain’s 17 autonomous regions, divided into 7 categories according to their numbers of inhabitants.
Even when CIS barometers are not designed to obtain indications at a local level, being the most comprehensive data source on citizen engagement in Spain, we used it to get an idea of what could be the results from traditional survey data in the selected cities of our case study.
To obtain values of the indicator on a local level, we extract the data from the anonymized microdata, which are freely available from the CIS website (www.analisis.cis.es/cisdb.jsp). The microdata are available in ASCII format or compressed in the proprietary SPSS statistical software format, which can be exported to different formats, such as a tab-delimited text file, to manipulate the data with other non-proprietary software. For our analysis, we extracted data from barometers 2885, 2941, 2984, 3021, and 3080 (CIS Citation2011, Citation2012, Citation2013, Citation2014, Citation2015) for the cities of Cádiz, Seville, and Madrid. Thus, for each city we calculate changes over time in the percentage of respondents who indicated having contacted a politician as follows:(1)
4.2. Applied methodology to Twitter data
Harvesting relevant tweets
To collect the largest possible number of relevant tweets, and considering the restrictions of the public Twitter APIs, we use the streaming Twitter API to retrieve real-time tweets and the Twitter search API to retrieve tweets from the past.
The query for tweets acquisition is limited to retrieve only those tweets containing mentions of one or more politicians or municipal representatives from the selected cities. Annex 1 provides the full list of politicians and municipal representatives considered. We use the search engine www.google.com and the Twitter website search engine to find Twitter profiles from the list of politicians and municipal representatives. We search for the Twitter profiles of interest using keywords including the full names of municipal representatives and politicians and the political parties they belong to. Thus, our search considers the different possible combinations of the following keywords, related to each of the selected politicians or municipal representatives: name-1, name-2 (in the case of a compound given name), surname-1, surname-2 (Spanish names are composed of two family names), political party, and municipality.
Then, we qualitatively validated the Twitter profiles thus identified by considering the following aspects of the users’ Twitter home pages:
Twitter user description containing references to a relevant job position (mayor, councillor, member of the city plenary, member of the governing body or similar) or to the political party of membership;
images in the profile picture and header photo showing any symbol related to a government or political party role;
content of tweets related to political issues;
user location; and
membership in Twitter lists related to the political party or municipality.
Processing the harvested tweets
Only those tweets that mention a politician or municipal representative are collected. The next step of the method filters the tweets keeping only those generated by individual citizens from the selected cities. With that aim, the method includes two steps: Twitter users’ categorization and their geographic location.
To categorize the tweets collected, we investigate tweets metadata to identify Twitter profiles not corresponding to individual citizens (hereinafter, non-common citizens). We exclude tweets from Twitter users representing an organization, brand, political party, institution, special interest group, other politician, media, or journalist. Our categorization method evaluates particularly the presence of specific keywords in the user description on the Twitter profiles. Two types of keywords are applied. First, we analyse the words most frequently used to describe the most popular Twitter users (number of followers greater than the 99th percentile, equivalent to more than 12,500 followers). We consider that a high number of followers could indicate non-common citizens. From the qualitative analysis of the 100 most frequently encountered words, we select a group of significant keywords closely related to non-common citizens, like ‘official account’, ‘deputy’, ‘journalist’, ‘newspaper’, and ‘information’ (in reality, their Spanish equivalents). The second type of keywords are related to the political parties, politicians, and municipal representatives targeted by our study. We assume that accounts showing those particular names in their user description would have a special association with them. Thus, they are also considered non-common citizens. The selection of keywords is iteratively assessed and adapted until an accuracy higher than 95% is obtained. Annex 2 offers detailed information regarding this categorization process.
Geolocation is determined as well. Twitter users can elect to make their geolocation public. Generally, only 1% of tweets are geolocated, offering latitude and longitude data which can be highly accurate when using Twitter from a device equipped with a global positioning system (GPS). However, the geolocation of tweets can also be determined by analysing the information about location contained in other metadata attributes, that is, the user location or placename. To do so, this research uses the geocoder library (http://geocoder.readthedocs.org/), which allows different online geocoding services to be exploited, such as Google, Bing, OpenStreetMap, and Geonames, among others. These geocoding services parse the textual words and phrases in the tweets’ attributes and assign to them geographic identifiers, that is, latitude and longitude information.
The results from the data processing allow us to investigate the spatio-temporal distribution of the tweets. In addition, complementary content analysis may also offer interesting insights of the data. Although out of the scope of our research, content analysis would allow us to investigate particular topics associated with specific politicians, particular topics associated with different kinds of senders (citizens, other politicians, and media), or changes in trending topics over time.
Indicator assessment
The results from the data analysis allow us to assess the potential of Twitter data to provide an indicator of contacting a politician. We evaluate this potential considering the following assessment criteria, adapted from the Australian Bureau of Statistics Data Quality Framework (ABS Citation2016)
accuracy (assessed in terms of the major sources of error that lead to inaccuracies);
scope and coverage (identification of the target population, representativeness of the data, biases);
spatial dimension (spatial coverage and granularity);
temporal dimension (period of data collection, exceptions during the collection and granularity);
timeliness (any delay between data collection and data availability and frequency of data collection);
coherence (data comparability with other sources of information and consistency over time);
cost and effort (amount of work and time required to define, develop, apply, and reproduce the method);
flexibility (broad and applicable over a variety of situations);
method feasibility (limitations to the method applicability).
5. Results
The method designed to measure contacts with politicians by using Twitter data yields interesting intermediate results (see ).
Figure 3. Workflow of Twitter data processing to obtain the measurement of contacts with politicians for the selected cities.
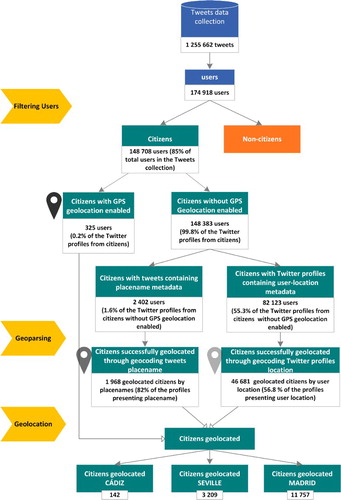
During the data collection period of 42 days, the Twitter public Streaming and Search APIs produced 1,255,662 tweets mentioning the 84 Twitter profiles related to politicians or municipal representatives from Cádiz, Seville, or Madrid (the whole list is available at Annex 1). The tweets collected were generated by 174,918 unique users. The filtering method we developed excluded 15% of those Twitter profiles as being associated with a politician, journalist, political party, or media outlet. Considering only those Twitter profiles identified as individual citizens, just 0.2% offered information on their geolocation in coordinates (with GPS geolocation enabled).
To associate the tweets with the cities focus of the case study, that is, Cádiz, Seville, and Madrid, we need to geolocate the Twitter profiles. Because few Twitter users offered precise location data (from their devices’ GPS), our method includes the geocoding of information related to the placename or user location given in the tweets metadata. This allows us to increase the number of Twitter profiles that could be considered in the analysis. The placename field found in the tweet metadata is usually the name of a neighbourhood, city, or region, automatically generated when the Twitter user activates the option to display the placename. These toponyms follow standard formats, easing the geocoding process. In contrast, the user location attribute is an open field in which information is not necessarily a location or parseable, making for more difficult interpretation by geocoding services. For that reason, placename information is preferred to user location when both fields are available for a single tweet. Experimenting with the different geocoding providers, OpenStreetMap offered the best results for this research, geocoding 82% of the tweets presenting a placename and 57% of the ones with user location data.
The metadata associated with the tweets includes precise temporal information, giving the time that the tweet is generated to a precision of seconds. presents the temporal evolution of the tweets in which citizens contacted a politician or municipal representative of Cádiz, Seville, and Madrid during the pre-election period. Not surprisingly, the number of contacts in the three cities increased during the lead-up to the elections, reaching a maximum on 25 May, which was the day of the municipal elections.
Figure 4. Temporal evolution of the data collected: Tweets from citizens mentioning a politician or municipal representative of Madrid, Seville, and Cádiz.
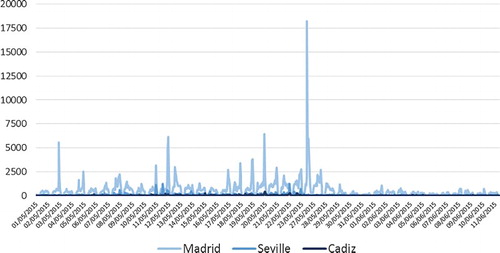
Trends in citizens contacting a politician seem closely related to the political calendar. Thus, the temporal analysis of the indicator built using Twitter data might prove useful for detecting special events. shows a peak on 11 May. Analysing the content of the tweets generated that day, we found the most frequently words used to be related to an electoral debate broadcast by Madrid’s autonomous public television station, Telemadrid, in which the main regional government candidates participated. The hashtag #DebateTM, linked to the event, was the trending topic that day.
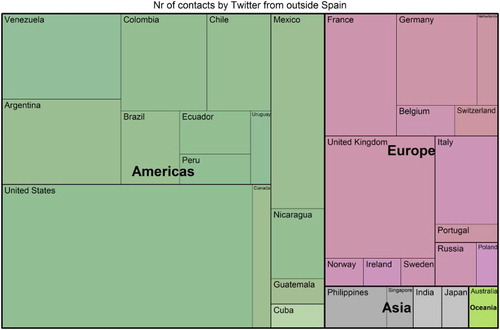
Additional information was also obtained in the spatial domain. Our methodology can thus offer insight into the extent that people elsewhere in the world contacted those politicians. In our study, less than 25% of the contacts (15,108 out of 64,082) were originated from citizens located in Cádiz, Seville, or Madrid. The rest were from people located elsewhere in Spain, in a different country in Europe or from another continents, mainly Spanish-speaking countries, and the United States (), coinciding with countries hosting the largest numbers of Spanish migrants according to the Register of Spaniards resident abroad provided by the National Statistics Institute (INE Citation2014). In any case, this suggests that the geolocation process is a crucial part of the method to produce city-level indicators.
Figure 5. Spatial distribution of the individuals who contacted a politician or municipal representative of Cádiz, Seville, and Madrid via Twitter during the data collection period (excluding the contacts from Spain).
Additionally, the content of the tweets collected constitutes an interesting field of research. Although tweet content was not relevant to our question on the frequency of contact with politicians, it shows extra potentialities and might offer useful information for other study objectives. Tools for text mining and word cloud generators help to analyse texts and facilitate the exploration and comparison of the main issues that citizens commented upon to their municipal politicians or representatives. Words such as ‘campaign’, ‘mayor’, ‘municipality’, ‘now’, ‘programme’, and ‘change’, to cite just a few, appear relatively frequently in the tweets targeting the politicians from Cádiz, Seville, and Madrid.
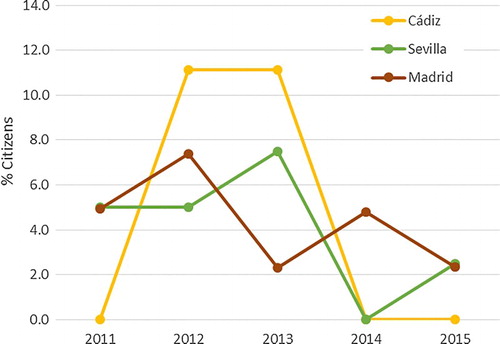
Besides the results from Twitter data, CIS barometers exemplify the values of the indicator ‘contacted a politician’ obtained from official data sources. The microdata from the CIS surveys for Cádiz, Seville, and Madrid relative to the indicator for the more recent years (from 2011 to 2015) are displayed in . The values show no particular trend or tendency for any of the cities, nor do they suggest any relationship between the three over time. Extraction of significant information is particularly difficult for the small city, as the sample size is too small to obtain a realistic indicator at the local level. Particularly for the selected cities, the sample sizes are 9 interviewees in Cádiz, 40 in Seville, and 167 in Madrid. Representativeness cannot be expected for these data, as the CIS survey is designed to statistically represent the Spanish population, and not communities at the municipal level. We nonetheless use this dataset as it is the most complete official data available.
Figure 6. Temporal evolution of the indicator ‘contacted a politician’ from 2011 to 2015 in Cádiz, Seville, and Madrid, using the CIS surveys as data source.
presents the values of the indicator ‘contacted a politician’ obtained from Twitter data and from CIS barometer for the year 2015 in Cádiz, Seville, and Madrid. The survey data results refer to one-year period, thus, to obtain a comparable measure for the indicator using Twitter data we extrapolate the results of our data analysis, that is, 42 days during April and May 2015, to the one-year period. This extrapolation is a coarse approximation and potentially overestimates the results because this was a period of municipal elections. It should be noted, however, that there were two national elections since then, indicating that ‘election fever’ may becoming the norm in Spain. Comparing the Twitter results with the 2015 CIS survey results, Twitter data indicate a larger number of contacts for the three cities studied: Cádiz, Seville, and Madrid. However, the values are similar in magnitude to those obtained from the official data source. The largest differences are found for the city of Cádiz where the data from the CIS surveys are less representative due to the small number of observations, as mentioned above.
Table 1. Indicator ‘contacted a politician to express an opinion’ in Cádiz, Seville, and Madrid. Values from the 2015 CIS survey, and values obtained using Twitter data for a 42-day period of analysis extrapolated to one year.
6. Discussion
presents the assessment of the results obtained by the two methods according to the criteria established.
Table 2. Comparison of the methods to obtain the citizen engagement indicator: based on Twitter data and based on traditional data from official surveys.
As the table shows the major strengths and weakness of using Twitter data compared to official survey data are that Twitter data are cheaper, faster to produce, can be analysed any time during the year, and provide comparable results also at small geographical scales. On the negative side, Twitter is not the only channel used for contacting politicians, a more reliable comparison with survey data would require a one-year data collection and geolocation is based on data of unknown truthfulness.
With respect to the methodology developed in this study, we advance the field by providing quantitative measure of contacting a politician, compared to Soria Ibáñez (Citation2015), the user-centred approach is less volatile than using hashtags as suggested by Ausserhofer and Maireder (Citation2013), we have successfully minimised the self-reinforcing influence of the media by filtering out non-common citizens from the data reference, and the method does not require sentiment analysis even though information of interest could be obtained through it. Easy replication of the method is another advantage comparing with the method proposed by Ausserhofer and Maireder (Citation2013), in which manual categorization of the tweets collected according to political topics requires greater time investment.
These findings suggest that our method for harvesting and analysing Twitter data was useful for the indicator ‘contacted a politician’, as it offered the possibility of monitoring citizens’ real-time activity and awareness of the political environment. The advantage of the method developed is that it can also be re-used for other indicators requiring the filtering out of media and corporate users. This research therefore represents a further step in developing indicators using social media that can complement the information obtained from official data sources. Survey data might remain as a periodic foundation of knowledge on the social reality, while social media can offer real-time signs of social changes. Nonetheless, to derive a coherent method, further analyses need to be done addressing the scalability of the method, and determining the influence of location and temporal aspects (not only comparing a single point in time, but repeating over time), preferably unaffected by election periods. This is the focus of research currently in progress by the authors. Another relevant topic for further research is the inclusion of techniques for demographic extraction from social media, what will allow a more in-depth analysis of the users’ profiles, facilitating a more specific comparison with survey data. Additionally, follow-up research based on content analysis might offer social and political researchers further information on the motivations and interests for active participation.
7. Conclusions
The research presented in this paper contributes to the body of work assessing the opportunities and limitations of data from social networks to complement official data and generate social indicators for policy. In particular, we assessed the potential of Twitter data to obtain indications of a specific variable of active citizenship, that is, contacts to politicians in three cities of a different size in Spain. The experiment allows one to identify the strengths and weaknesses of this data source for that specific use. As discussed, there are issues about the self-selection bias inherent to data from Twitter, the overrepresentation of younger citizens and the imprecise accuracy of users’ location. Nevertheless, the use of Twitter data offers results with higher granularity in space and time. Thus, results from Twitter data might complement the values obtained by official surveys, especially for small urban areas, where official surveys do not offer representative values of the population.
The research developed a suite of methods to mine Twitter data including an assessment method to evaluate the veracity of Twitter user profiles related to politicians and a method to categorize Twitter users between ‘individual citizens’ and ‘others’ (politicians, journalists, political parties, media, companies, brands, or corporations). These methods might be reused by other researches where the categorization of users is needed. On the other hand, to progress this work further there is need to test the robustness and replicability of the methodology in other countries and political contexts. The authors are working in this direction but comparison with the work of others will advance the field faster. This is necessary because of the speed at which new data sources become available, and the degree of uncertainty still surrounding their re-use. Realizing the DE vision may be a long road but it can only be achieved one step at the time.
Supplementary_Materials.doc
Download MS Word (157 KB)Acknowledgements
We thank our colleagues Elena Roglia, Roberto Sgnaolin, Daniele Francioli, and Lorena Hernandez for their technical assistance with the Twitter data collection, storage, and visualization.
Disclosure statement
No potential conflict of interest was reported by the authors.
ORCID
Cristina Rosales Sánchez http://orcid.org/0000-0001-8355-9747
Massimo Craglia http://orcid.org/0000-0001-6244-6428
Arnold K. Bregt http://orcid.org/0000-0001-5797-7208
Additional information
Funding
Related Research Data
References
- ABS (Australian Bureau of Statistics). 2016. “ABS Data Quality Framework.” Accessed July 6. https://www.nss.gov.au/dataquality/aboutqualityframework.jsp.
- Ausserhofer, Julian, and Axel Maireder. 2013. “National Politics on Twitter.” Information, Communication & Society 16 (3): 291–314. doi:10.1080/1369118X.2012.756050.
- Barbera, Pablo, and Gonzalo Rivero. 2014. “Understanding the Political Representativeness of Twitter Users.” Social Science Computer Review 33 (6). doi:10.1177/0894439314558836.
- Bekafigo, Marija Anna, and Allan McBride. 2013. “Who Tweets About Politics? Political Participation of Twitter Users During the 2011Gubernatorial Elections.” Social Science Computer Review 31 (5): 625–643. doi:10.1177/0894439313490405.
- Bruns, Axel, and Jean E. Burgess. 2011. “#Ausvotes: How Twitter Covered the 2010 Australian Federal Election.” Communication, Politics and Culture 44 ( July): 37–56.
- CIS (Centro de Investigaciones Sociológicas). 2011. “Barómetro 2885 – Abril 2011.” http://www.cis.es/cis/opencm/ES/1_encuestas/estudios/ver.jsp?estudio=11264.
- CIS (Centro de Investigaciones Sociológicas). 2012. “Barómetro 2941 – Abril 2012.” http://www.cis.es/cis/opencm/ES/1_encuestas/estudios/ver.jsp?estudio=12704.
- CIS (Centro de Investigaciones Sociológicas). 2013. “Barómetro 2984 – Abril 2013.” http://www.cis.es/cis/opencm/ES/1_encuestas/estudios/ver.jsp?estudio=14009.
- CIS (Centro de Investigaciones Sociológicas). 2014. “Barómetro 3021 – Abril 2014.” http://www.cis.es/cis/opencm/ES/1_encuestas/estudios/ver.jsp?estudio=14067.
- CIS (Centro de Investigaciones Sociológicas). 2015. “Barómetro 3080 – Abril 2015.” http://www.cis.es/cis/opencm/ES/1_encuestas/estudios/ver.jsp?estudio=14179.
- Coleman, David J., Yola Georgiadou, and Jeff Labonte. 2009. “Volunteered Geographic Information : The Nature and Motivation of Produsers.” International Journal of Spatial Data Infrastructures Research 4: 332–358. doi:10.2902/1725-0463.2009.04.art16.
- Costanza, Robert, Maureen Hart, John Talberth, and Stephen Posner. 2009. “Beyond GDP: The Need for New Measures of Progress.” 4. Institute for Sustainable Solutions Publications. http://pdxscholar.library.pdx.edu/iss_pub/11.
- Craglia, Max, Kees de Bie, Davina Jackson, Martino Pesaresi, Gábor Remetey-Fülöpp, Changlin Wang, Alessandro Annoni, et al. 2012. “Digital Earth 2020 : Towards the Vision for the Next Decade.” International Journal of Digital Earth 5 ( December 2011): 4–21. doi:10.1080/17538947.2011.638500.
- Craglia, M., F. Ostermann, and L. Spinsanti. 2012. “Digital Earth from Vision to Practice: Making Sense of Citizen-Generated Content.” International Journal of Digital Earth 5 (5): 398–416. doi:10.1080/17538947.2012.712273.
- Culotta, Aron. 2014. “Estimating County Health Statistics with Twitter.” Paper presented at Proceedings of the 32nd Annual ACM Conference on Human Factors in Computing Systems – CHI ‘14, 1335–1344, ACM Press, New York, New York. doi:10.1145/2556288.2557139.
- Desjardin, J. 2016. “What Happens in an Internet Minute in 2016?” http://www.visualcapitalist.com/what-happens-internet-minute-2016/.
- DG COMM European Commission. 2014. “Standard Eurobarometer 82 ‘Media Use in the European Union’.” doi:10.2775/346751.
- DGINS. 2013. “Scheveningen Memorandum – Big Data and Official Statistics.” http://ec.europa.eu/eurostat/documents/42577/43315/Scheveningen-memorandum-27-09-13.
- European Statistical System Committee. 2011. “Sponsorship Group on Measuring Progress, Well-Being and Sustainable Development – Final Report.” http://epp.eurostat.ec.europa.eu/portal/page/portal/pgp_ess/about_ess/measuring_progress.
- Eurostat. 2016. “Quality of Life Indicators.” Accessed July 6. http://ec.europa.eu/eurostat/web/gdp-and-beyond/quality-of-life/data/overview.
- Gayo-Avello, Daniel. 2012. “I Wanted to Predict Elections with Twitter and All I got was this Lousy Paper.” http://arxiv.org/pdf/1204.6441v1.pdf.
- Girardin, Fabien, Francesco Calabrese, Filippo Dal Fiore, Carlo Ratti, and Josep Blat. 2008. “Digital Footprinting: Uncovering Tourists with User-Generated Content.” IEEE Pervasive Computing 7 (4): 36–43. doi:10.1109/MPRV.2008.71.
- Goodchild, Michael F., and J. Alan Glennon. 2010. “Crowdsourcing Geographic Information for Disaster Response: A Research Frontier.” International Journal of Digital Earth 3 (3): 231–241. doi:10.1080/17538941003759255.
- Goodchild, M. F., H. Guo, A. Annoni, L. Bian, K. de Bie, F. Campbell, M. Craglia, et al. 2012. “Next-Generation Digital Earth.” In Proceedings of the National Academy of Sciences 109: 11088–11094. doi:10.1073/pnas.1202383109.
- Gore, Al. 1999. “The Digital Earth: understanding our planet in the 21st century.” Photogrammetric Engineering and Remote Sensing 65 (5): 528–530.
- Honeycutt, Courtenay, and Susan C. S. C. Herring. 2009. “Beyond Microblogging: Conversation and Collaboration via Twitter.” Paper Presented at the 42nd Hawaii International Conference on System Sciences, 1–10, IEEE Computer Society. doi:10.1109/HICSS.2009.602.
- Hoskins, B., J. Jesinghaus, M. Mascherini, G. Munda, M. Nardo, M. Saisana, D. Van Nijlen, D. Vidoni, and E. Villalba. 2006. “Measuring Active Citizenship in Europe.” Ispra, Joint Research Centre. doi:LB-NA-22530-EN-C; ISBN: 92-79-03738-2; ISSN: 1018-5593.
- Hoskins, Bryony L., and Massimiliano Mascherini. 2009. “Measuring Active Citizenship through the Development of a Composite Indicator.” Social Indicators Research 90 (3): 459–488. doi:10.1007/s11205-008-9271-2.
- Huberty, Mark. 2015. “Can we Vote with Our Tweet? On the Perennial Difficulty of Election Forecasting with Social Media.” International Journal of Forecasting. doi:10.1016/j.ijforecast.2014.08.005.
- INE (Instituto Nacional de Estadística). 2014. “Spanish Municipal Register.” http://www.ine.es/jaxi/menu.do?type=pcaxis&path=%2Ft20%2Fp85001&file=inebase&L=1.
- Laney, Doug. 2001. “3D Data Management: Controlling Data Volume, Velocity and Variety.” Gartner. http://blogs.gartner.com/doug-laney/.
- Larsson, Anders Olof. 2014. “Pandering, Protesting, Engaging. Norwegian Party Leaders on Facebook during the 2013 ‘Short Campaign’.” Information, Communication & Society 18 (4): 459–473. doi:10.1080/1369118X.2014.967269.
- Larsson, Anders Olof, and H. Moe. 2012. “Studying Political Microblogging: Twitter Users in the 2010 Swedish Election Campaign.” New Media & Society 14 (5): 729–747. doi:10.1177/1461444811422894.
- Moser, Claus Adolf, and Graham Kalton. 1971. Survey Methods in Social Investigation. Survey Methods in Social Investigation. London: Heinemann Educational.
- OECD. 2013. “Guidelines on Measuring Subjective Well-Being.” http://www.oecd.org/statistics/guidelines-on-measuring-subjective-well-being.htm.
- Ognyanova, Katherine, Nien-Tsu Nancy Chen, Sandra J. Ball-Rokeach, Zheng An, Minhee Son, Michael Parks, and Daniela Gerson. 2013. “Online Participation in a Community Context: Civic Engagement and Connections to Local Communication Resources.” International Journal of Communication 7: 24. http://ijoc.org/index.php/ijoc/article/view/2287.
- Roche, Stephane, Eliane Propeck-Zimmermann, and Boris Mericskay. 2011. “GeoWeb and Crisis Management: Issues and Perspectives of Volunteered Geographic Information.” GeoJournal 78 (1): 21–40. doi:10.1007/s10708-011-9423-9.
- Schober, Michael F., Josh Pasek, Lauren Guggenheim, Cliff Lampe, and Frederick G. Conrad. 2016. “Research Synthesis: Social Media Analyses for Social Measurement.” Public Opinion Quarterly 80 (1): 180–211. doi:10.1093/poq/nfv048.
- Soria Ibáñez, María del Mar. 2015. “El Uso de Twitter Para Analizar El Activismo Ciudadano : Las Noticias Económicas de Los Principales Periódicos de Referencia Nacional.” Estudios Sobre El Mensaje Periodístico 21 (1): 599–614. http://revistas.ucm.es/index.php/ESMP/article/view/49113/45806.
- Spinsanti, Laura, and Frank Ostermann. 2013. “Automated Geographic Context Analysis for Volunteered Information.” Applied Geography 43 ( September): 36–44. doi:10.1016/j.apgeog.2013.05.005.
- Stiglitz, J., A. Sen, and J. Fitoussi. 2009. “Report by the Commission on the Measurement of Economic Performance and Social Progress.” http://www.stiglitz-sen-fitoussi.fr/documents/rapport_anglais.pdf.
- Struijs, Peter, Barteld Braaksma, and Piet J. H. Daas. 2014. “Official Statistics and Big Data.” Big Data & Society 1 (1). doi:10.1177/2053951714538417.
- Twitter. 2016. “Twitter.” Accessed July 6. https://about.twitter.com/company.
- UNECE Statistics. 2016. “High-Level Group for the Modernisation of Official Statistics.” Accessed July 6. http://www1.unece.org/stat/platform/display/hlgbas/High-Level+Group+for + the+Modernisation+of+Official+Statistics.
- United Nations. 2014. “Big Data and Modernization of Statistical Systems.” Vol. 62933. http://unstats.un.org/unsd/statcom/doc14/2014-11-BigData-E.pdf.
- UNStats. 2016. “UN Big Data for Official Statistics.” Accessed July 6. http://unstats.un.org/unsd/bigdata/.
- Verweij, Peter. 2012. “Twitter Links Between Politicians and Journalists.” Journalism Practice 6 (5–6): 680–691. doi:10.1080/17512786.2012.667272.
- Ward, Stephen, and Rachel Gibson. 2008. “European Political Organizations and the Internet. Mobilization, Participation and Change.” In Routledge Handbook of Internet Politics, 528. Routledge. https://books.google.com/books?hl=en&lr=&id=4w19AgAAQBAJ&pgis=1.