
ABSTRACT
Due to extensive water pollution in Chinese rivers and lakes, large efforts have to be made to improve the quality of drinking water and manage the sewage water treatment process. We propose a general workflow for integrating a large number of heterogeneous data sets relating to various hydrological compartments into a Virtual Geographic Environment (VGE). This allows both researchers and stakeholders to easily access complex data collections in a unified context, find interrelations or inconsistencies between data sets and evaluate simulation results with respect to other observations or simulations in the same region. A prototype of such a VGE has been set up for the region around Chao Lake, containing more than 20 spatial data sets and collections as well as first simulation result. The prototype has been successfully presented to researchers and stakeholders from China and Germany.
1. Motivation
Due to the rapid economic development in the last decades, China is now facing serious environmental challenges (Yue et al. Citation2015; Wohlfart et al. Citation2016), including water pollution, water shortage, floods, water salinization, groundwater depletion, catchment soil erosion, ecosystem deterioration and biodiversity loss. Among those, water pollution is the largest risk to the Chinese society today. More than 40% of China’s rivers are severely polluted, and 80% of its lakes suffer from eutrophication (Liu and Yang Citation2012). Since most of the drinking water comes from surface water, drinking water problems caused by harmful algal blooms and chemical spills are of great concern (Tang et al. Citation2006; Tirado Citation2008; Wang et al. Citation2008; Chen and Liu Citation2014). Wells and aquifers are contaminated with fertilizers, pesticide residues and heavy metals from the mining (Li, He, and Sun Citation2013) and petrochemical industries (Li, Zuo, and Cui Citation2014). About 300 million rural residents are lacking safe drinking water resources (Liu and Yang Citation2012; Dou, Wang, and Li Citation2014). As a result, water resources management and wastewater treatment coupled with pollution control policies are urgently needed to improve the water environment as a whole. Over the last decade, China has launched a number of water pollution control plans to deal with the existing water problems in China (Chinese Ministry of Environmental Protection Citation2016). Water had become a major topic within the Chinese 11th Five-Year Plan; the Major Science and Technology Program for Water Pollution Control and Treatment (Mega Water Projects 2006–2020) has been initiated by the Chinese government for improving wastewater treatment technology and drinking water supply as well as for rehabilitating rivers and lakes (Chen et al. Citation2015a; Chen, Sun, and Kolditz Citation2015d; Zhi et al. Citation2016).
With the rapid development of both monitoring technologies (remote sensing, sensor networks, etc.) and Geographical Information Systems (GIS), the multitude of observed data sets can be employed in the earth system modelling domain for both water resources management and environmental studies. Virtual Geographic Environments (VGEs) are regarded as a new generation of geographic analysis tools (Lu Citation2011; Chen et al. Citation2013; Lin et al. Citation2013a; Lin, Chen, and Lv Citation2013b; Lin et al. Citation2015) and among other areas of application they can be employed for water pollution analysis. Not only can static geographic objects, such as lakes, river networks or sewer networks be presented and assessed, but embedding the results of process simulators can also help to predict trends and further pollution analysis (Chen et al. Citation2012; Lin et al. Citation2015). By combining observation data and modelling platforms using modern information technology (Rink, Kalbacher, and Kolditz Citation2012; Kunkel et al. Citation2013; Helbig et al. Citation2014; Rink, Bilke, and Kolditz Citation2014), Environmental Information Systems (EISs) can be embedded in VGEs to provide a realistic geographic context or to serve as an early warning system for drinking water supplies.
2. Methodology
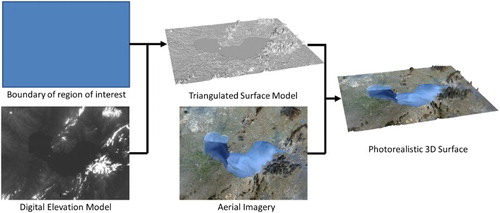
A number of conceptional and technical challenges have to be considered during the development of a multi-purpose EIS from the viewpoint of data topologies and modelling as well as scientific computing and visualisation. A VGE (Chen et al. Citation2015c) is a descriptive way of allowing users to assess and evaluate complex collections of heterogeneous data sets. This may include the analysis of spatial data sets, time-series data from observation sites or the results of simulated scenarios. Furthermore, the correlation of data sets, the variation of certain variables in a region of interest or the highlighting of certain aspects of a given data set can easily be shown by using established methods from visualisation sciences. For users to get a sense of the environment as well as the determining factors for a given phenomenon or trend (e.g. algal blooms, intrusion of chemicals, etc.), the integration of a large number of data sets into a unified context is required. Each data set has to be visually represented in a way that is meaningful to a typical user such that they may be able to focus on the relevant variables. A basic example is shown in where three data sets are required to create an instantly recognisable surface of the region of interest.
Figure 1. Example of pre-processing steps necessary for the representation of 2D data sets in 3D space.
In the environmental sciences, the inclusion of modelling data and simulation results into the VGE framework is of vital importance for an effective analysis of processes. Often different scenarios and their effect on the environment need to be displayed such that stakeholders or researchers have an intuitive understanding and are supported in their decision making process. Examples include predictions about water management (e.g. short-term vs. long-term solutions) or waste water treatment (e.g. centralised vs. decentralised concepts). Challenges for integration of this kind of data into the VGE include the large size of data sets, the number of parameters included, the transient structure of selected data sets as well as the visualisation of uncertainty in simulated parameters.
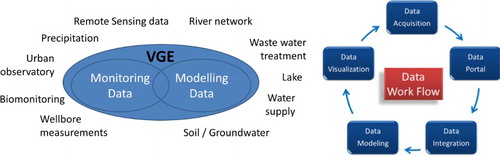
(a) provides a structure for partitioning typical input data for an EIS for water infrastructure (i.e. drinking water supply and waste water treatment). Building a framework that is not specifically tailored to one case study but defined in a way that it may be used for other case studies – even if from different application areas – requires flexible data structures and modular algorithms for storing, modifying and visualising data within the environment. The combination and parameterisation of these modules depend on the definition of general workflows as well as flexible interfaces for connecting algorithms. The EIS as a whole is in turn embedded into a concept which provides a continuous data flow ((b)) from data acquisition to data integration for multiple purposes within the environmental sciences (monitoring, planning and modelling).
Figure 2. (a) Combining monitoring and modelling data in the context of a virtual geographic environment. (b) Schematic of a continuous workflow concept (Kolditz et al. Citation2012b).
3. Data integration and workflow
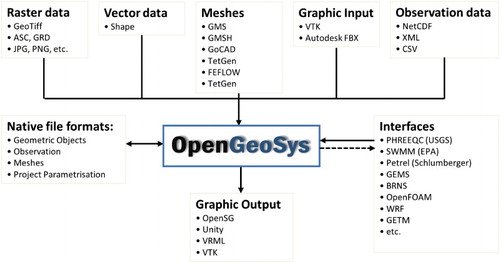
We employ the OpenGeoSys (OGS) Data Explorer (Rink et al. Citation2013) for importing data sets into a unified reference frame and the Unity engine (Goldstone Citation2011) for presentation of all integrated data sets to audiences, such as stakeholders, researchers or the general public. The Data Explorer is the graphical user interface to the OGS simulation software (Kolditz et al. Citation2012a). It is capable of importing and visualising measured data sets, such as GIS feature- or raster files as well as simulation results projecting transient parameter values on either FEM-meshes or geometric features. The framework already supports a large range of established file formats from the environmental sciences, incl. typical GIS formats, a variety of mesh generators for creating 3D objects, graphics formats and interfaces to a number of modelling and simulation frameworks. See for an overview. While OGS is mostly used for the simulation of coupled Thermo-Hydro-Mechanical-Chemical processes, the support of multi-purpose file formats such as Visualization Toolkit (Schroeder, Martin, and Lorensen Citation2006) or NetCDF (Rew and Davis Citation1990) ensure that many simulation results from domains as diverse as continuum mechanics (e.g. OpenFOAM (Weller et al. Citation1998)), climate research (e.g. weather research & forecast (WRF) (Michalakes et al. Citation2004)), lake and coastal research (e.g. general estuarine transport model (GETM) (Burchard and Bolding Citation2002)) or drainage network simulation (e.g. storm water management system (SWMM) (Rossman Citation2014)) can be interpreted by the software.
Figure 3. Supported file formats for the OGS framework. Due to the wide range of supported formats, interfacing with other simulation software is simple if an established format is supported. For instance, due to support of the netcdf format, the integration of data from models such as the WRF model used for climate simulations or the GETM used for studies of lakes or coastal regions becomes straightforward.
A typical workflow for integrating a data set into an existing scene usually includes the following steps:
Import data set into framework
Create meaningful representations of the data set in 3D space
Detect and remove (or highlight) inconsistencies between data sets
Modify data set by adding missing information (e.g. elevation on 2D data, mapping of simulation results onto 3D objects, etc.) or correct inconsistent or false information (e.g. topological incorrect surfaces, removing NaN values, etc.)
Present data in a meaningful fashion (e.g. choose appropriate colours, apply textures, select glyphs or colour lookup tables for parameters of data points, etc.)
Add interaction methods to guide users to data set (camera paths, viewpoints, animations, etc.)
Steps 1–4 are usually performed using the OGS Data Explorer. Once all data sets have been pre-processed, they are added to a scene generated by the Unity framework. Depending on structure and interpretation of each original data set, step 5 of our workflow may require algorithms implemented either in OGS or in Unity. Step 6 is exclusively executed in Unity. Since the visualisation of the aforementioned types of data is not a focus of the Unity framework, neither importing nor modifying such data is possible with the original programme. However, the framework is easily extendable and we have developed a number of specific methods and shaders for importing and visualising typical environmental and hydrogeological data sets within Unity. Examples include technical aspects, such as the use of very large textures (e.g. remote sensing imagery) or automatic translation and scaling routines to convert the often very large coordinates from regional geographic projections into a small, scaled coordinate system typically used for scenes in graphics applications. In addition, application-specific issues include the use of modified shaders, for example, for mapping selected colour arrays on objects based on simulated parameters at varying time steps. The scene containing all data sets can be built as an executable file for a virtual reality environment (using a stereoscopic video wall as well as a head-mounted display) but also for a regular desktop computer. Navigation within the virtual environment is performed via typical VR interaction devices such as Flystick, Razer Hydra or Gamepad. To make the framework easy to handle for unexperienced users, a number of features are added for navigation and interaction. This includes
predefined viewpoints of relevant regions or data sets within the scene,
the definition of camera paths along interesting features or gradients of simulated parameters,
picking of objects to access additional 2D content such as diagrams, photos or webpages,
a simple animation interface to start, pause or step through time-variant content (such as the time steps of a simulation or different planning scenarios),
toggling of data sets or groups of data sets and adjusting their transparency.
This functionality is accessible via a menu within the virtual space but can optionally also be assigned to buttons on the interaction device. While it is possible to navigate freely in 3D space, experience has shown that most users prefer predefined points of view and the interaction via a menu, similar to desktop applications.
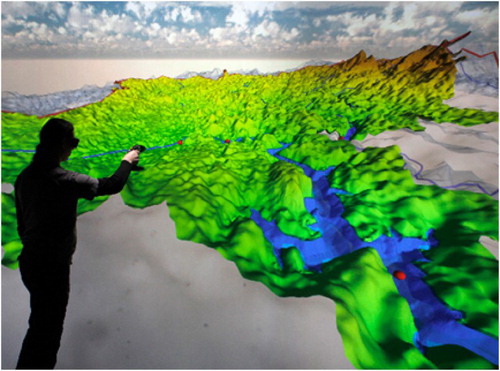
shows an example of a VGE based on case study of the Rappbode reservoir, one of the largest drinking water reservoirs in Germany. The 3D visualisation is linked to time-series data from a monitoring database, including data measured from climate stations in the region as well as a buoy on the lake (Rink et al. Citation2013). Furthermore, the scene includes simulation results from a hydrodynamic model (Bocaniov Citation2014) This facilitates a powerful combination of monitoring data and simulation results in one coherent, spatially arranged visualisation.
Figure 4. Visualisation of the rappbode reservoir in Germany in the context of a VGE, displayed on the video wall in a virtual reality environment.
4. Application prototype
We have set up a VGE for the area around Chao Lake in China (see ) as a prototype for the international project ‘Managing Water Resources for Urban Catchments’ (Dohmann et al. Citation2016). The focus within this prototype is Chaohu, a city with a population of almost one million people, located on the eastern shore of Chao Lake within the Anhui Province in Eastern China. With a surface area of 720 km2 Chao Lake is the fifth-largest freshwater lake in China. Due to eutrophication and silting, the lake has become one of the most polluted lakes in China in recent years (Chen et al. Citation2015a) which causes a number of problems for cities located at or near the lake, including Chaohu, as the population uses the lake for fishing, irrigation and obtaining drinking water. Project partners from China and Germany are working together with the goal to analyse and improve the current situation at different stages of the fresh- and sewage water treatment workflow.
Figure 5. Visualisation of the Chao Lake VGE. (a) Super-elevated terrain of Chaohu city from the north with aerial image texture. Buoys within the lake are marked in Orange. (b) View of Chaohu city from the east with sewage network superimposed on the surface. Note the fine resolution of the texture within the city compared to the rougher texture in the background (c) Super-elevated view of Chao Lake from the southwest. Mapped on the lake surface is a LANDSAT 8 image showing algal bloom in summer. (d) view of land use information in the Chao Lake region. Chaohu city is located in the lower left corner, road- and river network are mapped onto the terrain surface.
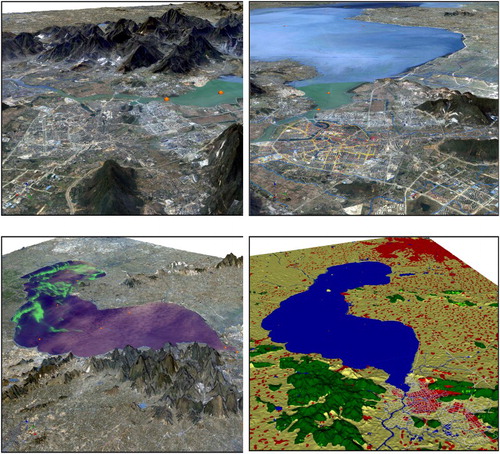
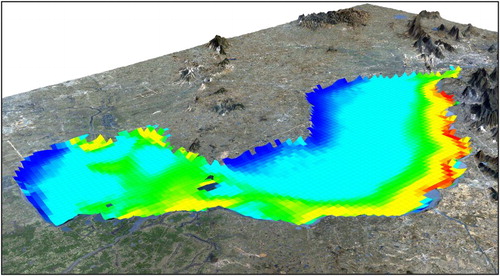
The purpose of this VGE is to show the current situation in and around the lake, including risk factors such as algae or pesticide concentration. As a next step, various simulation results are currently being integrated into the environment so that stakeholders or researchers are supported in their analysis of the complex, coupled processes involved. Furthermore, possible scenarios will be integrated to access a potential improvement of the situation. While the data collection process in not yet finished, already more than 20 environmental data sets are included in the project. Examples are a digital elevation model (DEM) (Tachikawa et al. Citation2011), a land cover map (Chen et al. Citation2015b), the bathymetry of Chao Lake, aerial imagery (esri Citation2016), water bodies for the region of interest surrounding Chao Lake (OpenStreetMap Citation2016) as well as detailed data on water and sewage networks within Chaohu City (Liao et al. Citation2016), etc. Simulations of processes in the Lake, the groundwater system as well as the drainage pipeline system for storm- and sewage water within the city are currently in preparation. Preliminary results have already been added to the framework as a proof of concept: shows a visualisation of a simulated river network, shows preliminary results from a simulation with a lake model.
Figure 6. Visualisation of one time step of simulated ammonium-concentration in a river network. The simulation results have been created using the SWMM (Rossman Citation2014). SWMM output has then been imported into OGS data structures for visualisation (SWMM data provided by Michael Käseberg).
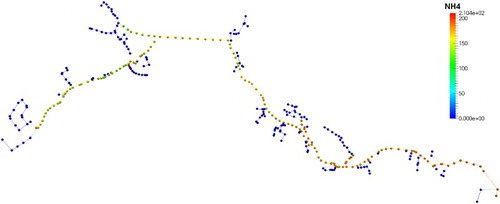
Figure 7. Embedded simulation of Chao Lake into 3D geographical scene. To enhance the existing topography of the region, the underlying DEM has been super-elevated by factor 5 and texturised using an aerial image of the region. With a maximum depth of 5 metres, Chao Lake is extremely shallow for a lake of its size. The depicted bathymetry has been super-elevated by factor 200 to give a sense of its 3D surface. Mapped on the lake surface is the result of preliminary simulation of evapotranspiration using the GETM (Burchard and Bolding Citation2002).
Our extensions of the Unity framework mentioned in the previous section are particularly useful for this case study. The complete region around Chao Lake integrated into the VGE has a size of over 5000 km2, here represented by roughly 200,000 triangles with a maximum edge length of 250 m. The corresponding aerial imagery ((c)) has a pixel size of roughly 12.5 m which results in a detailed visualisation of the surface data despite not incorporating advanced methods such as bump mapping (see for a schematic of creating the textured terrain surface). However, the regions of interest for domain scientists are usually much smaller. For instance, we added a refined surface representation and image data for Chaohu City with a size of about 100 km2. The surface of this small region consists of over 300,000 triangles with a maximum edge length of 25 m, the aerial image has a pixel size of less than 3 m. This fine resolution is necessary to maintain a useful representation of the area when users are expected to zoom in very close to the surface. Also, integrating very detailed data sets such as the drainage system for the city (with a sub-metre resolution) requires similarly refined corresponding data for a visual assessment of the relation of data sets to each other.
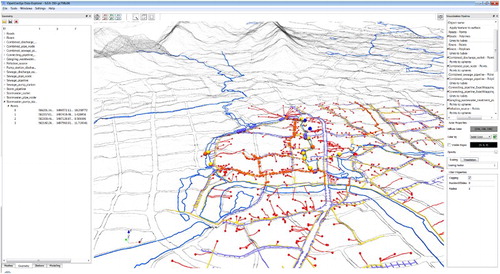
Likewise, collecting data sets into groups for toggling the visibility or transparency is vital for this case study, to avoid time-consuming selection or deselection of data sets. The case study contains 15 data sets contributing to the drainage pipeline system of Chaohu City (pipes, outlets, treatment plants, etc., see ), changing the status of each of these separately is not acceptable during live presentations.
Figure 8. Pre-processing of data sets. Depicted is the OGS Data Explorer interface while integrating the drainage pipeline system in Chaohu city into the existing scene. The terrain surface mesh is semi-transparent visible in the background for reference as well as the road- (grey) and river network (blue). Fifteen data sets related to the drainage system have been loaded, mapped and assigned colours according to their function (e.g. violet data represents storm pipeline infrastructure, yellow signifies sewage infrastructure, etc.).
Animations are required for a time series of LANDSAT images of Chao Lake ((c)) visualising the annual algae growth (LANDSAT 8, Citation2016) as well as for the visualisation of simulation results. Especially the simulation of short-term events, such as flooding, requires a very fine temporal resolution, often resulting in thousands of time steps. The example shown in is taken from a simulation over 50 days, consisting of approximately 15,000 time steps at an interval of 5 minutes.
We have done multiple presentations using prototypes of the Chao Lake VGE in a virtual reality environment using a 6 × 3 m video wall with additional projections at the sides and the floor where user position is tracked using infrared cameras (Bilke Citation2014). Scientists from various research domains and stakeholders from the German and Chinese Ministry of Science have participated and the response has been very positive. Complex context and interrelation of data sets is easy to understand even for users without a hydrogeological background and participants are often able to point out correlations or inconsistencies that have not been visible within GIS. While we are still at a prototype stage, we hope to acquire more detailed data for the region in the future and include detailed simulated scenarios from multiple hydrological compartments soon.
5. Conclusions and outlook
The present work shows a generic framework for the development of VGEs for EISs. This framework has been demonstrated for a case study of water resources management in the catchment of Chao Lake in the Anhui Province of China. Even though the data integration process is not finished, relevant types of data for water resources management that we are aware of can already be integrated into the VGE via the OGS Data Explorer.
The presented VGE provides novelty in two directions. Firstly, static and dynamic data from both remote sensing and process modelling, can be integrated and compared within the context of the VGE. Secondly, the framework allows for data integration at different spatial and temporal resolution, permitting to focus on specific regions of interest within a scene. The modular approach of the framework also allows to easily update existing data sets or add new data to an existing VGE.
Future activities are related to completing the data integration concept for all aquatic compartments (i.e. soil and groundwater systems) and to apply the framework to similar case studies within the Yangtze River Basin, for example, Poyang Lake and Tai Lake catchments. These case studies are also part of the ‘Research Centre for Environmental Information Science’ (RCEIS – www.ufz.de/rceis).
Acknowledgements
We would like to thank Michael Käseberg, Erik Nixdorf, Thomas Fischer and Guozheng Zhi for their support with data, models and algorithms.
Disclosure statement
No potential conflict of interest was reported by the authors.
Additional information
Funding
References
- Bilke, L., T. Fischer, C. Helbig, C. Krawczyk, T. Nagel, D. Naumov, S. Paulick, et al. 2014. “TESSIN VISLab – Laboratory for Scientific Visualization.” Environmental Earth Sciences 72 (10): 3881–3899. doi: 10.1007/s12665-014-3785-5
- Bocaniov, S. A., C. Ullmann, K. Rinke, K. G. Lamb, and B. Boehrer. 2014. “Internal Waves and Mixing in a Stratified Reservoir: Insights From Three-dimensional Modelling.” Limnologica 49: 52–67. doi: 10.1016/j.limno.2014.08.004
- Burchard, H., and K. Bolding. 2002. “GETM – A General Estuarine Transport Model.” Scientific Documentation, Technical Report EUR 20253 EN, European Commission.
- Chen, C., H. Börnick, Q. Cai, X. Dai, S. C. Jähnig, Y. Kong, P. Krebs, et al. 2015a. “Challenges and Opportunities of German-Chinese Cooperation in Water Science and Technology.” Environmental Earth Sciences 73 (8): 4861–4871. doi: 10.1007/s12665-015-4149-5
- Chen, J., J. Chen, A. Liao, et al. 2015b. “Global Land Cover Mapping at 30 m Resolution: A POK-based Operational Approach.” ISPRES Journal of Photogrammetry and Remote Sensing 103: 7–27. doi: 10.1016/j.isprsjprs.2014.09.002
- Chen, M., H. Lin, O. Kolditz, and C. Chen. 2015c. “Developing Dynamic Virtual Geographic Environments (VGEs) for Geographic Research.” Environmental Earth Sciences 74 (10): 6975–6980. doi: 10.1007/s12665-015-4761-4
- Chen, M., H. Lin, Y. N. Wen, L. He, and M. Y. Hu. 2012. “Sino-virtualMoon: A 3D Web Platform Using Chang'e-1 Data for Collaborative Research.” Planetary and Space Science 65 (1): 130–136. doi: 10.1016/j.pss.2012.01.005
- Chen, M., H. Lin, Y. N. Wen, L. He, and M. Y. Hu. 2013. “Construction of a Virtual Lunar Environment Platform.” International Journal of Digital Earth 6 (5): 469–482. doi: 10.1080/17538947.2011.628415
- Chen, Y., and Q. Q. Liu. 2014. “On the Horizontal Distribution of Algal-bloom in Chaohu Lake and its Formation Process. Acta Mechanica Sinica 30 (5): 656–666. doi: 10.1007/s10409-014-0078-x
- Chen, C., F. Sun, and O. Kolditz. 2015d. Design and Integration of a GIS Based Data Model for the Regional Hydro-logic Simulation in Meijiang Watershed, China. Environmental Earth Sciences. doi:10.1007/s12665-015-4734-7.
- Chinese Ministry of Environmental Protection. 2016. http://nwpcp.mep.gov.cn/.
- Dohmann, M., C. Chen, M. Grambow, O. Kolditz, P. Krebs, K. R. Schmidt, G. Subklew, et al. 2016. “German Contributions to the Major Water Program in China: Innovation Cluster–Major Water.” Environmental Earth Sciences 75: 703. doi: 10.1007/s12665-016-5504-x
- Dou, M., Y. Y. Wang, and C. Y. Li. 2014. “Oil Leak Contaminated Tap Water: A View of Drinking Water Security Crisis in China.” Environmental Earth Sciences 72 (10): 4219–4221. doi: 10.1007/s12665-014-3556-3
- Esri, Earthstar Geographics, CNES/Airbus DS. 2016. http://www.arcgis.com/home/webmap/viewer.html.
- Goldstone, W. 2011. Unity 3.x Game Development Essentials. 2nd ed. Birmingham: Packt.
- Helbig, C., H.-S. Bauer, K. Rink, V. Wulfmeyer, M. Frank, and O. Kolditz. 2014. “Concept and Workflow for 3D Visualization of Atmospheric Data in a Virtual Reality Environment for Analytical Approaches.” Environmental Earth Sciences 72 (10): 3767–3780. doi: 10.1007/s12665-014-3136-6
- Kolditz, O., S. Bauer, L. Bilke, N. Böttcher, J. O. Delfs, T. Fischer, U. J. Görke, et al. 2012a. “OpenGeoSys: An Open Source Initiative for Numerical Simulation of Thermo-Hydro-Mechanical/Chemical (THM/C) Processes in Porous Media.” Environmental Earth Sciences 67 (2): 589–599. doi: 10.1007/s12665-012-1546-x
- Kolditz, O., K. Rink, H. Shao, T. Kalbacher, S. Zacharias, and P. Dietrich. 2012b. “International Viewpoint and News: Data and Modelling Platforms in Environmental Earth Sciences.” Environmental Earth Sciences 66(4): 1279–1284. doi: 10.1007/s12665-012-1661-8
- Kunkel, R., J. Sorg, R. Eckardt, O. Kolditz, K. Rink, and H. Vereecken. 2013. “TEODOOR: A Distributed Geodata Infrastructure for Terrestrial Observation Data.” Environmental Earth Sciences 69: 507. doi: 10.1007/s12665-013-2370-7
- LANDSAT 8 (L8). 2016. “Data Users Handbook”. U. S. Geological Service. Earth Resources Observation and Science Center. LSDS-1574
- Li, X. G., H. Y. He, and Q. F. Sun. 2013. “The Shallow Groundwater Pollution’s Assessment of West Liaohe Plain (Eastern).” Journal of Chemical and Pharmaceutical Research 5 (11): 290–295.
- Li, D. F, Q. T. Zuo, and G. T. Cui. 2014. “Disposal of Chemical Contaminants into Groundwater: Viewing Hidden Environmental Pollution in China.” Environmental Earth Sciences 70 (4): 1933–1935. doi: 10.1007/s12665-013-2463-3
- Liao, Z., G. Zhi, Y. Zhou, Z. Xu, and K. Rink. 2016. “To Analyze the Urban Water Environmental Pollution Dis-charge System Using the Tracking and Tracing Approach.” Environmental Earth Sciences 75: 1080. doi: 10.1007/s12665-016-5881-1
- Lin, H., M. Batty, S. E. Jørgensen, B. Fu, M. Konecny, A. Voinov, and P. Torrens, et al. 2015. “Virtual Environments Begin to Embrace Process-based Geographic Analysis.” Editorial, Transactions in GIS 19 (4): 493–498. doi: 10.1111/tgis.12167
- Lin, H., M. Chen, G. Lu, Q. Zhu, J. Gong, X. You, Y. Wen, B. Xu, and M. Hu. 2013a. “Virtual Geographic Environments (VGEs): A New Generation of Geographic Analysis Tool.” Earth Science Reviews 126: 74–84. doi: 10.1016/j.earscirev.2013.08.001
- Lin, H., M. Chen, and G. Lv. 2013b. “Virtual Geographic Environment: A Workspace for Computer-aided Geographic Experiments.” Annals of the Association of American Geographers 103 (3): 465–482. doi: 10.1080/00045608.2012.689234
- Liu, J., and W. Yang. 2012. “Water Sustainability for China and Beyond.” Science 337 (6095): 649–650. doi: 10.1126/science.1219471
- Lu, G. N. 2011. “Geographic Analysis-oriented Virtual Geographic Environment: Framework, Structure and Functions.” Science China-Earth Sciences 54 (5): 733–743. doi: 10.1007/s11430-011-4193-2
- Michalakes, J., J. Dudhia, D. Gill, et al. 2004. “The Weather Research and Forecast Model: Software Architecture and Performance.” Proceedings of the 11th ECMWF Workshop on the Use of High Performance Computing In Meteorology 25–29.
- OpenStreetMap contributers. 2016. https://www.openstreetmap.org.
- Rew, R., and G. Davis. 1990. “NetCDF: An Interface for Scientific Data Access.” IEEE Computer Graphics and Applications 10 (4): 76–82. doi: 10.1109/38.56302
- Rink, K., L. Bilke, and O. Kolditz . 2014. “Visualisation Strategies for Environmental Modelling Data.” Environmental Earth Sciences 72 (10): 3857–3868. doi: 10.1007/s12665-013-2970-2
- Rink, K., T. Fischer, B. Selle, and O. Kolditz. 2013. “A Data Exploration Framework for Validation and Setup of Hydrological Models.” Environmental Earth Sciences 69 (2): 469–477. doi: 10.1007/s12665-012-2030-3
- Rink, K., T. Kalbacher, and O. Kolditz. 2012. “Visual Data Exploration for Hydrological Analysis.” Environmental Earth Sciences 65 (5): 1395–1403. doi: 10.1007/s12665-011-1230-6
- Rossman, L. 2014. “SWMM-CAT User’s Guide.” Technical Report. EPA 600-R-14-428.
- Schroeder, W., K. Martin, and B. Lorensen. 2006. Visualization Toolkit: An Object-oriented Approach to 3D Graphics. New York: Kitware.
- Tachikawa, T., M. Kaku, A. Iwasaki, et al. 2011. “ASTER Global Digital Elevation Model Version 2 – Summary of Validation Results.” Technical Report, NASA Jet Propulsion Laboratory, California Institute of Technology, USA.
- Tang, D. L., H. Kawamura, I. S. Oh, and J. Baker. 2006. “Satellite Evidence of Harmful Algal Blooms and Related Oceanographic Features in the Bohai Sea During Autumn 1998.” Advances in Space Research 37: 681–689. doi: 10.1016/j.asr.2005.04.045
- Tirado, R. 2008. “Analysis of Chemical Agricultural Pollution and Algal Blooms.” Greenpeace Report.
- Wang, S. F., D. L. Tang, F. L. He, Y. Fukuyo, and R. V. Azanza. 2008. “Occurrences of Harmful Algal Blooms (HABs) Associated with Ocean Environments in the South China Sea.” Hydrobiologia 596: 79–93. doi: 10.1007/s10750-007-9059-4
- Weller, H. G., G. Tabor, H. Jasak, and C. Fureby. 1998. “A Tensorial Approach to Computational Continuum Mechanics Using Object-oriented Techniques.” Computers in Physics 12 (6): 620–631. doi: 10.1063/1.168744
- Wohlfart, C., C. Kuenzer, C. Chen, and G. Liu. 2016. “Social–Ecological Challenges in the Yellow River Basin (China): A Review.” Environmental Earth Sciences 75: 1066. doi: 10.1007/s12665-016-5864-2
- Yue, T.-X., B. Xu, N. Zhao, C. Chen, and O. Kolditz. 2015. “Thematic Issue: Environment and Health in China – I.” Environmental Earth Sciences 74 (8): 6361–6365. doi: 10.1007/s12665-015-4758-z
- Zhi, G., Y. Chen, Z. Liao, M. Walther, and X. Yuan. 2016. “Comprehensive Assessment of Eutrophication Status Based on Monte Carlo – Triangular Fuzzy Numbers Model: Site Study of Dongting Lake, Mid-South China.” Environmental Earth Sciences 75 (12): 1011. doi: 10.1007/s12665-016-5819-7