
ABSTRACT
Based on the experience of the International Society for Digital Earth (ISDE), this paper describes some challenges foreseen in order to develop a Digital Earth platform that can support the implementation of the Sustainable Development Goals. The use of ready-to-use derived geospatial information is essential. Future Earth’s methodology of ‘co-design’ aims to bring together natural, social scientists and decision makers to plan and carry out research for sustainability. Sustainability implies transdisciplinary research, but in order for scientists of different disciplines to work together, they will need to be able to share, access and use common data. This is by far not simple! While the good will to share data might exist, the associated technological, ethical and privacy issues are difficult to solve. An adequate e-infrastructure will be required. ISDE could consider to use the SDGs is the basis to develop the desired Digital Earth platform. This paper, by no means, covers everything for a Digital Earth platform, it aims to trigger research discussions and to have a good view about a starting point.
1. Background
Today the political agenda worldwide recognizes the benefits that might bring sustainable development. Agreeing to the Agenda 2030 that includes the 2015–2030 Sustainable Development Goals (SDGs), the world will need to evaluate progress and look ahead to emerging challenges and eventual associated solutions. Previously, within the UN Millennium Development Goals (MDGs) (http://datatopics.worldbank.org/mdgs/), the global goal of halving poverty was achieved in 2010, unfortunately not due to the efforts of all nations, but to the outstanding individual efforts of, among others, the People’s Republic of China and India.
Within this context, data is and will be one of the most important issues. Jointly with the importance of data is the necessary digital platform that will be required to host all required data and what is more important, a Digital Earth platform that should enable all the different audiences of users (e.g. scientists, decision makers, and the civil society) to store and easily retrieve and visualize the data. Such a Digital Earth platform will be a key element in order for the national and international community to be able to access the vast amount of data that will be used.
1.1. Future earth
The International Council for Science (ICSU) was requested by The Science and Technology Alliance for Global Sustainability to undertake a major restructuring of the existing global change research programs.
We must recognize that the Global Change Research Programmes have been and are extremely successful. However major donors requested to incorporate scientific interdisciplinarity as well as a change in focus, focusing more on scientific research towards sustainability. As a result a research platform known as ‘Future Earth’ was launched in 2012 at the United Nations Conference on Sustainable Development Rio + 20 (ICSU Citation2013). This research platform has a life cycle of 10 years.
‘Future Earth’ is therefore a global environmental change research platform with the aim of providing knowledge and support to accelerate transformations to a sustainable world. Future Earth aims to do so by covering three major themes: Dynamic Planet, Global Sustainable Development and Transformations to Sustainability (ICSU Citation2013). It is based on science and technology, open to scientists of all disciplines, natural and social, as well as engineering, the humanities and law, and seeks to work together with business, NGOs, civil society and government. The type of support that data should provide to Future Earth (ICSU Citation2013):
Observing systems
Data systems
Earth system modeling
Theory development
Synthesis and assessments
Capacity development and education
Communication
Science policy interface and interaction
Future Earth aims to focus on answering fundamental questions such as how and why the global environment is changing. To predict and model future changes? It will undertake research to provide scientific-based options aimed to reduce losses caused by natural disasters. The research is oriented to identify ways to implement transformations to prosperous and equitable futures.
Future Earth will integrate as different disciplines from the natural and social sciences (including economic, legal and behavioral research), engineering and humanities. It will be co-designed and co-produced by academics, governments, business and the civil society.
Clearly the Future Earth program will require large amount of data coming from many different scientific research disciplines. How to store and retrieve such data is something that could be addressed by the Digital Earth platform that International Society for Digital Earth (ISDE) aims to develop.
In the field of data there are significant barriers to developing and implementing sound data management programs and infrastructure in a timely manner to meet desired objectives such as open access, long-term stewardship, and support for both research and application needs. Future Earth will need to cover both research areas as well as applied research.
Future Earth is still in a beginning stage and it does not know precisely its associated key data needs, to identify what data infrastructures exists already and to adapt data management practices based on existing ones (e.g. CODATA, WDS, the Group on Earth Observations (GEO), etc.). A new aspect for Future Earth would be the challenge of encouraging and facilitating the scientific analysis of integrated natural and social science data.
Currently Future Earth has established a Data Task Force. This data task force is focusing on establishing partners with existing data expert institutions. Avoid any duplication is the main focus. A good partnership and close cooperation between Future Earth and ISDE would be mutual beneficial.
1.2. Digital earth/ISDE
Digital Earth is a concept of an interactive digital replica of the entire planet that can facilitate a shared understanding of the multiple relationships between the physical and natural environments and society. To do so, it needs to be accessible globally from multiple platforms (mobiles, tablets, computers); be able to display information in ways that are easily understood by multiple audiences (the public, decision-makers, scientists from all disciplines); and be constantly updated with data coming from sensors (space-based, airborne, in-situ), citizens, and both public and private sectors. It must be able to focus on change (from the past, to present and future) and thus include not just derived-information from data, but also the outcomes of models and simulations to enable a wider understanding of the consequences of human action on the environment, and of environmental change on society. It must be a tool for scientific discovery and education, social interaction, and debate. It must also be fun to use to engage the younger generations, who are the future of our planet.
Both, Future Earth and Digital Earth, are emerging under the political Agenda 2030, Agenda that aims to achieve overall sustainability and recognizes and requests the need to have scientific evidence supporting the decision making process. Future Earth, jointly with many other institutions, is setting up the scientific research platform, while Digital Earth is setting up the tools where such scientific information could be derived. While the political agenda provides an excellent atmosphere for Future Earth and Digital Earth to succeed, the main challenge is for both activities to do so. We focus in this article in the way Digital Earth as a geospatial Digital Platform could evolve. Founded in Beijing in 2006, the ISDE, is a non-political, non-governmental and not-for-profit international organization. ISDE encourages the academic exchange, science and technology innovation, education, and international collaboration towards the development and realization of the digital platform known as Digital Earth.
New technologies like a continuously and increasing number of satellite remote sensors are facilitating remarkable gains in access to improved sources of water. Being able to measure and model the associated local conditions, the fight against malaria and tuberculosis is gaining terrain. At the same time, the world must acknowledge that there are not only success stories: progress has been uneven and insufficient. Environmental sustainability is under threat, with accelerating growth in global greenhouse gas emissions and biodiversity loss. More than a billion people still live in extreme poverty. Nearly all of them suffer from hunger. Natural Disasters are causing an increased number of social and economic loses, etc.
The situation is complex and very difficult to understand by a single scientific discipline. We must take advantage of current ICT developments so that we can develop the tools that can help us in undertaking in-depth analyses of the complex cross disciplinary and cross-sectoral issues involved. Examples of these complex challenges are: urban sustainability; food and nutrition; security and access to modern energy services for all; eradicating extreme poverty; promoting sustainable consumption and production; and managing the planet’s natural resources for the benefit of humankind.
Over the past years, the global challenges to sustainable development have been driven by a broad set of ‘megatrends’, such as changing demographic profiles, changing economic and social dynamics, advancements in technology and trends towards environmental deterioration. A better understanding of the linkages among all these trends and the associated changes in economic, social and environmental conditions is needed. There are some ICT tool available that have started facilitating access to data but such tools are spread all over and therefore difficult to use. A common web-based distributed ICT platform to enable a full understanding is missing. This could be the niche for ISDE in order to develop Digital Earth.
2. Data for sustainability and the associated digital earth platform
In the following section we use the UN Secretary General report ‘A word that Counts’ as a guide to present the data requirement and how Digital Earth can respond to it. The report ‘A word that Counts’ states: ‘Data are the lifeblood of decision-making and the raw material for accountability.
Without high-quality data providing the right information on the right things at the right time; designing, monitoring and evaluating effective policies becomes almost impossible’ (http://www.undatarevolution.org).
The UN Secretary General report suggests the following data conditions:
‘Data needs to be georeferenced’. In a recent research workshop we found out that the word ‘georeferenced’ is complex for the social and economic sciences. Within the jargon of the social and economic sciences they use the term ‘space-based-information’. This example shows that we will face the challenge of setting up a common vocabulary out of our own scientific silo, a new vocabulary that can be understood by everyone. Miller (Citation2007) suggests that ‘place based’ Is not enough. He indicates that Geographic information science and technologies are revolutionizing basic and applied science by allowing integrated holistic approaches to the analysis of geographic locations and their attributes. However, the increasing mobility and connectivity of many people in the world means that the relationships between people and place are becoming more subtle and complex, rendering a place-based perspective incomplete. This article discusses the need to move beyond a place-based perspective in geographic information science to include a people-based perspective (i.e. the individual in space and time).
Raster data is commonly obtained by scanning maps or collecting aerial photographs and satellite images. Scanned map datasets don’t normally contain spatial reference information (either embedded in the file or as a separate file). With aerial photography and satellite imagery, sometimes the location information delivered with them is inadequate, and the data does not align properly with other existing data. Thus, to use some raster datasets in conjunction with all other spatial data there is the need to align or georeference all data to a map coordinate system. A map coordinate system is defined using a map. By georeferencing raster data this allows it to be viewed, queried, and analyzed jointly with other geographic data. (http://help.arcgis.com/en/arcgisdesktop/10.0/help/index.html#//009t000000mn000000)
The situation is completely different in data that does not come from automatic satellite sensors. Socio-economic data, biodiversity species data, etc. do not have a common georeferenced structure. Several attempts to standardize the georeferencing of data have been undertaken. A series of guidelines and best practices are available (Chapman and Wieczorek Citation2006).
Without question Digital Earth will need to be able to store and retrieve georeferenced data. In a perfect Digital Earth platform all data must be georeferenced. The task of georeferencing all existing data is out of the scope of Digital Earth. Digital Earth will need to set up partnerships with the various organizations dealing with the issue of data georeferencing, so that Digital Earth can guide its users into the most recommended methodologies, guidelines and practices for data georeferencing. Once the data is georeferenced it should then be made available through the Digital Earth platform.
‘Data will need to be accurate’. For each data set a robust frame to ensure the data quality will be required. As much as possible problems found with the data should be documented.
The challenge with data accuracy is that we will need to change the way a project is defined, by adding into the project data quality requirements and data quality assessment an integral part of the whole project. Jointly with this data quality we will need to ensure that a data measurement methodology is also included as part of the project. The GEO has undertaken serious research about data validation (GEO Citation2013; Herold et al. Citation2016). An outstanding example is the validation of GlobeLand30 (Chen, Ban, and Li Citation2014), were a knowledge-based interactive verification procedure was developed with the support of web service technology. An approach based on the integration of Pixel- and Object-based methods with Knowledge (POK-based) was tested using eight selected areas with differing landscapes from five different continents. An overall classification accuracy of over 80% was achieved.
Digital Earth should not cope with these difficult challenges. However Digital Earth will need to consider how to store the proper metadata so that any user can easily understand how accurate the data is, and how the quality of the data has been evaluated or validated. Additionally Digital Earth should offer a place for users to enter comments about the problems found when using a specific data set and the associated application for which the data set was used.
‘Data should be disaggregated’. It should be possible to know if the data refers to adults or children, to male or female, etc.
The Sustainable Development Solutions Network identified that for the MDGs it was difficult if not impossible to understand how people of different ages, capabilities, or income levels had benefited or not benefited from the actions undertaken in order to fulfill the MDGs. Therefore for the SDGs the UN has taken the overall approach of ‘no one to be left behind’ (http://mg.co.za/article/2015-11-27-00-sdgs-leave-no-one-behind). This is also mentioned in SDG-10 ‘Reduce inequality within and among countries’. For this reason it is required to have the data disaggregated. However nobody has yet agreed to the precise level of disaggregation required.
Digital Earth should not enter into the concept of creating disaggregated data. However the Digital Earth platform will need to start considering how the storage, retrieval and mainly presentation (e.g. visualization) of disaggregated data will be handled.
‘Data must be available: data openness’. Sustainability will imply the integration of all sources of data. Therefore it will not be possible that, for example, a Minister of Health does not make available all its data to the Minister of Environment and vice versa.
The concept of openness goes beyond the fact of making data accessible. The ICSU describes openness as (Science International Citation2015):
Simply making data accessible is not enough. Data must be ‘intelligently open’, meaning that they can be thoroughly scrutinized and appropriately re-used. The following criteria should be satisfied for open data, it should be:
discoverable – a web search can readily reveal their existence;
accessible – the data can be electronically imported into or accessed by a computer;
intelligible – there must be enough background information to make clear the relevance of the data to the specific issue under investigation;
assessable – assessable–users must be able to assess issues such as the competence of the data producers or the extent to which they may have a pecuniary interest in a particular outcome;
usable – there must be adequate metadata (the data about data that makes the data usable), and where computation has been used to create derived data, the relevant code, sometimes together with the characteristics of the computer, needs to be accessible.
Data should be of high quality wherever possible, reliable, authentic, and of scientific relevance. For longitudinal datasets, the metadata must be sufficient for users to be able to make a comparative analysis between timelines, and the sources must be valid and verifiable. It is important to be aware that the quality of some scientifically important datasets, such as those derived from unique experiments, may not be high in conventional terms, and may require very careful treatment and analysis.
‘Data will need to be usable’. Different scientific disciplines as well as different governmental institutions need to be able to use all types of data. Efforts will be required in order to ensure that all data can be usable.
The GEO (Citation2015) has done particular successful efforts towards data openness. This is a major area for the development of Digital Earth. Making data usable implies supporting the decision making with data. For this reason Digital Earth will need to understand the full process ‘from data to decision making’. This is a major challenge. Digital Earth will need to understand the different user audiences, Digital Earth will need to provide raw data so that experts in data analysis can work with such a data; for a different audience Digital Earth will need to provide graphics in order to facilitate the understanding of the data; civil society can be engaged using attractive maps and associated information. In summary this is a key area for Digital Earth to be able to provide a valuable contribution to the use of georeferenced data.
‘Data privacy and ethics’. A major challenge is to make all data available to everyone and at the same time to maintain the individual privacy of persons and to undertake strong control in order to avoid that the data is being used with unethical purposes.
In order to make progress in sustainable development, an extraordinary degree of trust must be built among all stakeholders. To be able to establish such trust, the Digital Earth platform will need to go beyond privacy habitudes and current existing data control measures. The Digital Earth platform will need to embrace practices and behaviors based on the highest ethical standards.
Data and information related with sustainability will be the core business of the Digital Earth platform. The privacy and ethics associated creates a critical challenge. For example, business companies are being asked to gather more types of data faster than ever to maintain a competitive edge in the digital marketplace; at the same time, however, they are being asked to provide pervasive and granular control mechanisms over the use of that data throughout the data supply chain. Daily we undertake activities that are digitally recorder. These activities could be used to measure sustainability; however, the tracing of these activities poses also severe ethical consequences.
Activities that were once private or shared with the few now leave trails of data that expose our interests, traits, beliefs, and intentions. We communicate using e-mails, texts, and social media; find partners on dating sites; learn via online courses; seek responses to mundane and sensitive questions using search engines; read news and books in the cloud; navigate streets with geotracking systems; and celebrate our newborns, and mourn our dead, on social media profiles. Through these and other activities, we reveal information – both knowingly and unwittingly – to one another, to commercial entities, and to our governments. (Acquisti, Brandimarte, and Loewenstein Citation2015, 509)
The challenge is extremely important and needs to be fully addressed all along the development process. If the Digital Earth platform required to deliver services, fails to secure personal data, or fails to comply with the highest ethical standards, users will run away of the platform and the concept of Digital Earth will never be able to take off. In Europe there are now a series of research groups activities on the specific issue of data privacy and ethics (Moran Citation2002).
For Digital Earth defining effective compliance activities to support legal and regulatory obligations can be a good starting point. It will be extremely difficult since laws are different among the different nations. However such a starting point will not be sufficient, Digital Earth will need to identify the best data and information ethics. Obviously we do not have a solution to this problem in this article, but we are suggesting this area of privacy and ethics as a major area of research that Digital Earth must address seriously all along the development of Digital Earth.
ISDE has been very active in the issue of data privacy and ethics. The ISDE European Chapter has made this topic its main priority. Therefore we encourage Digital Earth to further continue working in the research and implementation of this important topic. Partnerships with other institutions working on similar themes are suggested, for example, in collaboration with the US National Science Foundation, in 2014, the Council for Big Data, Ethics, and Society was started (http://bdes.datasociety.net/council-members/). It aims to provide critical social and cultural perspectives on big data initiatives. The Council brings together researchers from diverse disciplines – from anthropology and philosophy to economics and law – to address issues such as security, privacy, equality, and access in order to help guard against the repetition of known mistakes and inadequate preparation.
3. A digital earth platform to monitor the Anthropocene
The Programme on Ecosystem Change and Society (PECS) was launched in 2011. In 2014 PECS became a ‘core project’ of Future Earth. With PECS, Future Earth benefits from a very focused and in-depth understanding of social-ecological systems, through a comparison of long-term case studies. PECS views social – ecological systems as interdependent and linked systems of people and nature, which are nested across scales. For PECS people are part of ecosystems and shape them, from local to global scales, and are at the same time fundamentally dependent on the capacity of these systems to provide services for human wellbeing and societal development (Bennett et al. Citation2016). PECS focuses on bringing together cutting-edge research insights on social-ecological dynamics in the ‘Anthropocene’.Footnote1
An extremely complex issue is to undertake research in order to identify the core data variables that are required to understand the ‘Anthropocene’.
The International Panel on Climate Change (IPCC), jointly with the Global Climate Observing System (GCOS), have done tremendous scientific progress by identifying an initial set of Essential Climate Variables. Scientists could follow the example of IPCC/GCOS and to undertake research in order to start identifying the ‘Essential Anthropocene Variables’. Since such a task will be extremely complex and researchers will need to separate the whole into specific themes, it is then proposed to focus on Essential Variables for the Sustainable Development Goals (E-SDG-Vs). The SDGs offer a straight forward form of separating each topic. The concept will then to bring together scientists of all disciplines to identify the ‘core data sets’ for each SDG. It expected that some E-SDG-Vs will be trans-sectorial and some layers will be used in several SDGs. An example is the Global Change data set at 30 m resolution 2000 vs. 2010 (e.g. GlobeLand30). Such a data set will have multiple uses in all the SDGs.
Clearly, as mentioned before, all data will need to be geo-referenced. In Earth Observation all information is attached to the pixel, and therefore it is related to the spatial resolution of the sensor: 30 m for most of the Landsat satellite ancient images, and now 15 m for the new emerging families of satellite platforms (e.g. the Sentinel missions). The challenge will then to decide the spatial resolution adequate to incorporate the social and economic derived information. For example, a national population census at 30 m resolution will be a tremendous if not impossible task to implement. Traditional methods of capturing data (e.g. census data) will need to be complemented with innovative approaches (e.g. smartphones).
4. Digital earth and GlobeLand30
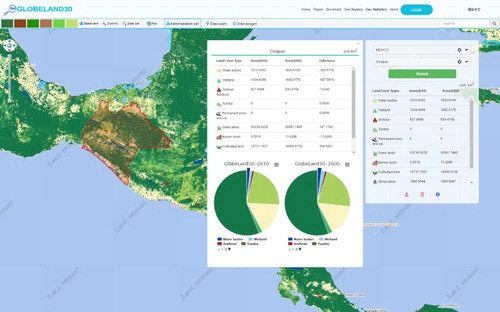
Since the ‘Anthropocene’ refers to the impact that humans are having on the Earth, let us consider the case of land cover changes occurred on the surface of the Earth between 2000 and 2010. As described before, for the past four years, the National Geomatics Center of China has developed and prepared GlobeLand30 (Chen, Ban, and Li Citation2014). This is the world’s first global land cover data sets at a 30 m resolution, for the years 2000 and 2010. The data sets are organized by 10 major land cover classes and provide essential high resolution (30 m) land cover and change information. Thousands of satellite images were necessary. Massive image processing was undertaken. Problems with clouds, difference in dates in the satellite images were corrected; geometric and radiometric techniques were applied. As final result researchers, decision makers and the society in general con have free access to a very valuable set of information displaying statistics of changes on any selected area of the Earth from 2000 to 2010.
In order to use GlobeLand30 users have open access (as per 15 March 2016, the National Geomatics Center of China, listed in its website: http://www.globallandcover.com/GLC30Download/index.aspx)
Globeland30 is an excellent example on the way remote sensing is already progressing. While recognizing the very valuable importance that has the processing of one Landsat scene and extracting as much information as possible by developing new technologies, what the ‘Anthropocene’ requires is the massive processing of satellite images, as automatic as possible, and at the very end the provision of information easy to understand and to use by everyone. In this sense the work of the GEO and in particular Globeland30, which is a result of GEOSS, is an outstanding example on how satellite image data needs to be processed in order to derive easy-to-use information required to cope with the ‘Anthropocene’. These efforts are excellent examples of Big Data supporting sustainability.
While Globeland30 is an outstanding example, we can use this example to illustrate the complexity of the information. Land cover changes between 2000 and 2010. Much more data sets similar to GlobeLand30 will be required. The main challenges to be solved are with the socio-economic data. If we continue with the example of the statistics provided on , many questions can come to the minds of researchers and decision makers working on this issue: who is causing these land cover changes? Are there national laws that do not allow such changes to take place? Is it a problem of weak law enforcement? If we want the society to change, what different alternatives can we offer to local communities? etc. The Digital Earth platform will need to have also all the different layers of the necessary socio-economic and political information. How all this is going to be integrated harmonized and make it interoperable is again an important research challenge that Digital Earth will need to address.
Figure 1. Through the simple and friendly use of GLOBELAND30, statistics of changes between 2000 and 2010 can be obtained by any area of the world. In this example, the Mexican State of Chiapas.
5. Data in a changing world
The world is changing rapidly. These new conditions challenge the ability of the social, behavioral and economic sciences to understand what is happening at a local or national scale and in people’s daily local lives. Forces such as globalization, the shifting composition of the economy, and the revolution in information brought about by the internet, smartphones and social media are just a few of the forces that are changing lives. Not only has the world changed since data collection methods currently used were developed, but the ways now available to link information and new data sources have radically changed. In the near future the social economic sciences will require a Digital Earth platform with increased cyber-infrastructure capability so that researchers and decision makers can keep pace with these continuously changing social and informational landscapes. Moran (Citation2012) has large experience in addressing these challenges. His work proposes a way to ensure that the growing volume and complexity of data can better serve business, government, education, health, and the social and economic needs of society. A new systematic and targeted approach to handling what have become Big Data challenges will be required. The Digital Earth platform (the social component) will require to be both scalable and flexible; that permits new questions to be addressed; that allows, for example, for preparedness, rapid response and adaptation to extreme events (such as extreme weather events or natural resource windfalls); and that facilitates understanding local conditions of the people as well as associated links with the economy and policy. The Intergovernmental Panel on Climate Change (IPCC Citation2008) has recently been mandated to address research on Climate Change Adaptation (https://unfccc.int/files/adaptation/sbsta_agenda_item_adaptation/application/pdf/background_paper_tt_web.pdfreport).
By analyzing the vision for the social and economic sciences, we can see that Earth Observation is already putting in place a Digital Platform that is both scalable and flexible. The challenge for Digital Earth will be to integrate all Earth Observation derived information (not raw data) with the needs and requirements of the social and economic sciences.
New data from the Internet and social media, when combined with newly available administrative and transactional data, have the potential to greatly expand the questions that can be addressed, as well as the spatial and temporal scales at which they can be addressed. For example, by using data from social networking sites, business transactions, smart phones, and online experiments, we can learn about labor market and consumer behavior and assess vulnerability to weather events and the impact of local and national policies and programs in real time.
Digital revolution is in progress: Cloud, Big Data, Internet of Things, are anymore words on everyone’s lips, but concepts which are modifying people’s, consumers’ and company’s habits. Today we have 3 billion devices connected to the network (such as the world’s population in 1960!), which generate a quantity of data in exponential rise. Every minute we send 204,000 e-mail, 277,000 tweet, we upload 72 hours of video on Youtube. Only on Facebook, we upload photos and contents for more than 105 terabytes per 30 minutes. Our phone apps trace, save and analyses all our daily activities.
It’s no longer just about PCs and smartphones: there are shoes that measure our athletic performances, refrigerators that warn us about products expiring. This is the Internet of Things where every object is connected, smart and generates information that is bringing a societal transformation. Clearly this data revolution is causing a societal transformation but it is not yet known how to use all this potential to support the societal transformation for sustainability.
6. Adding value to data, sharing data with other disciplines: geovisualization
Geo-visualization is the set of tools that through computer visualization enable the presentation, understanding, interpretation and assessment of environmental data. Basically geovisualization is based on Geographical Information Systems (GIS), the associated combination of multiple layers and how all these layers are presented to the end-user. ISDE will need to address the issues of data visualization as a major priority. As described before we are being exposed to a very large amount of data, data that is increasing daily. As in the case of GlobeLand30 we will need to focus our efforts in ‘Deriving value out of Big Data’. We as humans we are not used, and is for us not easy to understand large amount of numbers. Since the beginning of time we are more used to images (e.g. the Lascaux cave where richly colored figures document a hunt).
There is a variety of conventional ways to display information tables, histograms, pie charts and bar graphs are being used every day, in every project and on every possible occasion. However, to convey a message to other scientific disciplines, decision makers and the society in general, we will need much than just a simple pie chart of results. In fact, there are much better, profound, creative and absolutely fascinating ways to present information.
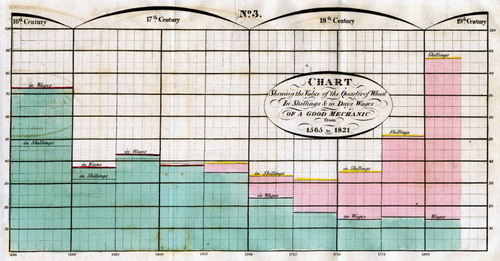
Although little was known about the brain two centuries ago, the inventors of statistical graphs must have had some intuitive awareness of how the visual system functioned. William Playfair, inventor of the time series line graph, the bar chart, and the pie chart, was particularly astute in his choice of designs (Spence Ian, William Playfair and the Psychology of Graphs Ian). The very first attempts to present data into a graphical information form was done by Mr. William Playfair in 1786, who in 1801 presented for the first time data in the form of graphical information () (Spence Citation2006).
Figure 2. A time series display showing three parallel time-series: prices of a quarter of wheat (the histogram bars), wages of a good mechanic (the line beneath it) and the reigns of English monarchs from Elizabeth I to George IV (1565 through 1820). © http://www.lindahall.org/william-playfair/ - Scientist of the Day - William Playfair - September 22, 2015 - Dr. William B. Ashworth, Jr., Consultant for the History of Science, Linda Hall Library and Associate Professor, Department of History, University of Missouri-Kansas City.
Up to now the concept of Digital Earth has evolved using the current visualization methods for a two-dimensional Geographic Information System (2D GIS). NASA has done tremendous research forward developing 3D visualization tools, one outstanding example is the ‘Magic Planet’: (as per 15 March 2016, the National Oceanic and Atmospheric Administration of the USA, listed in its website (http://sos.noaa.gov/Datasets/dataset.php?id=44). Magic Planet is a registered trademark of © Global Imagination ().
Figure 3. An innovative and interactive technology to display layers in 3D. Most of the data sets in the Science On a Sphere® catalog were created by NOAA and NASA and are freely available for public use. Others have been created by science museums, universities, and other individuals. The Magic Planet © NASA Jet Propulsion Laboratory.
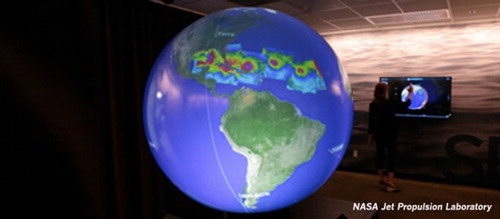
The Magic Planet combines the power of 3D multimedia visualization; the world’s largest library of global content; and a user interface designed and tested for its simple to use methodology. It’s a scalable, proven platform that grabs the attention and taps the learning strengths of each student in the classroom. Magic Planet includes a huge library of exhibits, movies, animations and images developed by NOAA, NASA, and an international community of leading museums and science centers. Using the data sets developed by NOAA and NASA users are able to select and display global data sets ranging from water temperature to population shifts. The data sets known as ‘Earth from Space’ highlights the series of Earth observing satellites orbiting our planet, the data they collect, and how people are using these data for research and applications. Through such a powerful visualization, users learn how NASA EOS data is collected through remote sensing systems, recognize the connection between this data and the area in which they live, and recognize the relevance and value of NASA data for understanding changes in the Earth related to where they live. The project is a good example on transforming data into information for all. The International Society for Photogrammetry and Remote Sensing has brought together large expertise in particular in heritage sites and/or objects visualization. The virtual reality obtained is on the modeling of an ancient Globe (the Behain Globe) is of extreme high-quality, ISDE should partnership with such expertise (Menna et al. Citation2012).
6.1. Visualization pushes research and knowledge forward
In today’s world distance has become a relative concept. It takes less time to cover the 800 miles between New York and Chicago by air than it does to reach Albany, 150 miles north, by land. And that is as true for an epidemic as it is for you (Brockmann and Helbing Citation2013).
The Brockman Lab in Berlin has been reinventing the way we manage distances. This is a new complete way of handling distance information. The visualization concept is innovative. The associated research project ‘How Connectedness – Not Distance – Predicts the Spread of a Pandemic’ came out with a revolutionary point – to-point visualization (http://www.dailymail.co.uk/sciencetech/article-2958805/Watch-world-s-swarming-flight-paths-action-Beautiful-multicoloured-visualisation-reveals-air-traffic-globe.html)
A main focus of his research is the understanding of the dynamics of human infectious diseases (The Global Trachoma Mapping Project, http://www.scidev.net/global/disease/data-visualisation/trachoma-mapping-project.html). News, fads, fashion and also infectious diseases spread by a combination of replication and propagation. Large scale epidemic events, such as the 2003 worldwide spread of SARS, the 2009 H1N1 pandemic are events that can be understood in terms of mathematical contagion models ().
Figure 4. The Global Trachoma Mapping Project, http://www.scidev.net/global/disease/data-visualisation/trachoma-mapping-project.html) (Brockmann and Helbing Citation2013).
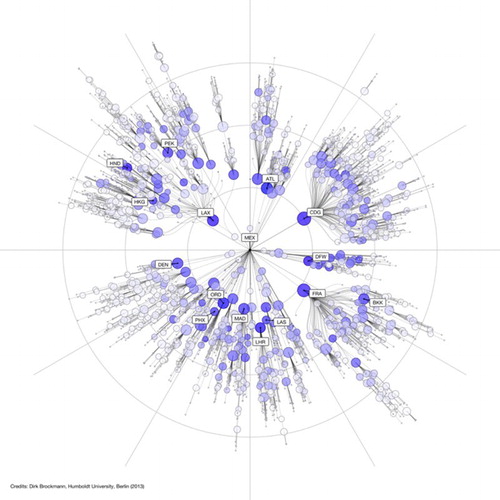
Visualization methodology that enables to understand the time required to fly from Mexico City to other worldwide airports. This innovative type of visualization enables researchers to understand that all airports that are located in concentric centers around Mexico city airport, correspond to those cities that are the most vulnerable to be spread with a contagious illness initiated in Mexico city. Only by visualizing the time to fly between airports, were researchers able to understand how the ‘Swine influenza’ that started in Mexico, spread worldwide.
The examples mentioned herein are only a small sample of the large amount of research being done in the area of visualization.
Progress is being made in the ability to visualize and model geologic data and information in 3 spatial dimensions (3D) and sometimes adding time for 4 dimensions (4D). These abilities are enriching the conceptual models and process simulations constructed by geologists and hydrogeologists. Computer technology is also enhancing the visualization and modeling of landscapes. (Glynn et al. Citation2011, 1)
7. The way forward for the ISDE
As explained previously, ISDE should encourage the academic exchange, science and technology innovation, education, and international collaboration towards the development and realization of the Digital Earth concept. Unfortunately since the concept of Digital Earth is so wide, ISDE has not been able to select priorities and then to start encouraging research groups to address such priorities. Conscious that the SDGs do not cover all the thematic areas of Digital Earth, we suggest herein considering some priorities for ISDE to support the SDGs, priorities that could become then some of the initial research activities that ISDE should encourage.
7.1. Large amount of data vs. no data
There is a tremendous amount of data available, but at the same such data is not easily accessible and, if researchers do not have the right contacts, the data cannot be found. This contradiction comes mainly from the fact that data are available within various different non-related databases spread all over and such data is the result of different unrelated initiatives. These databases or digital-platforms and tools differ in their implementation, ontology, meta-data, requirements, output, infrastructure, access policy, legal constraints, audience, etc. As a result they are sometimes incompatible, exploited partially by community fragments only, and sometimes, they are redundant. The situation becomes even more complex if we consider also the situation of socio-economic data. These digital platforms that have this data are sometimes less structured then, for example, those having Earth Observation data.
Worldwide, researchers are developing different global- and regional-scale data sets on the environment and human development. However there are severe problems when integrating all this data: the problems rare related with inconsistent data integration and visualization, variable data quality and documentation, uncoordinated proliferation of different versions of data sets, etc. (Chen Citation2004).
The SDGs will require the support of an interdisciplinary group of scientists, the participation of decision makes and the society. Having good and easy access to data will significantly contribute as the main ‘bridge’ to bring all these different stakeholders together and to make them work jointly.
ISDE can make significant progress addressing all these issues and working jointly with data expert institutions (e.g. CODATA, CIESIN, WDS, etc.) to define the ideal digital-platform. The private sector should also be involved. If ISDE can come out with guidelines, standards and coherence for a data repository that will significantly assist scientific interdisciplinarity as well as it will improve the knowledge of what data is available, where, its associated data quality, etc.
The funding for research projects needs also to change. Currently the project gathers the data and produces a final scientific paper report. The data is never packaged in such a way (e.g. graphics, videos, modeling, etc.) that can make such data understandable to other disciplines. Here is a major area where ISDE can provide a major contribution. The encouragement of innovative ITC-based visualization and modeling methods will make the data more attractive and more usable to more people.
7.2. Adding value to data
The funding for research projects needs also to change. Currently the project gathers the data and produces a final scientific paper report. The data is never packaged in such a way (e.g. graphics, videos, modeling, etc.) that can make such data understandable and usable to other disciplines. Here is a major area where ISDE can provide a major contribution. The encouragement of innovative ITC-based visualization and modeling methods will make the data more attractive and more usable to more people. From a research point of view it is frustrating to see that large amounts of financial resources are dedicated to develop computer games with excellent graphics and virtual reality. These technologies must also be used, using existing data sets, in order to produce modeling and virtual reality visualizations of our planet earth and all its associated ecosystems and associated socio-economical developments.
We have described GlobeLand30 in this paper. Its associated visual components (graphics to indicate percentage of changes) are an extraordinary added value to the data set. ISDE should be encouraged to follow these examples.
8. Conclusions
This paper aims to discuss for ISDE the different priorities that ISDE could consider in the near term. Clearly this paper does not cover all possibilities. However it indicates that ISDE could use the research topic of sustainability and in particular the necessary research and ICT support that the SDGs will require. This could be a niche for ISDE to start moving form events organizing towards a research platform that encourages researchers to work together under a common ISDE topic.
Disclosure statement
No potential conflict of interest was reported by the author.
Notes
1. The Anthropocene defines Earth’s most recent geologic time period as being human-influenced, or anthropogenic, based on overwhelming global evidence that atmospheric, geologic, hydrologic, biospheric and other earth system processes are now altered by humans. The word combines the root ‘anthropo’, meaning ‘human’ with the root ‘-cene’, the standard suffix for ‘epoch’ in geologic time. The Anthropocene is distinguished as a new period either after or within the Holocene, the current epoch, which began approximately 10,000 years ago (about 8000 BC) with the end of the last glacial period. © Source: The Encyclopedia of Earth.
References
- Acquisti, A., L. Brandimarte, and G. Loewenstein. 2015. “Privacy and Human Behavior in the Age of Information.” Science 347 (6221): 509–514. doi: 10.1126/science.aaa1465
- Bennett, E. M., M. Solan, R. Biggs, T. Mcphearson, A. V. Norström, P. Olsson, L. Pereira, et al. 2016. “Bright Spots: Seeds of a Good Anthropocene.” Frontiers in Ecology and the Environment 14 (8): 441–448. doi: 10.1002/fee.1309
- Brockmann, D., and D. Helbing. 2013. “The Hidden Geometry of Complex, Network-Driven Contagion Phenomena.” Science 342 (6164): 1337–1342. doi: 10.1126/science.1245200
- Chapman, A. D., Wieczorek, J. 2006. “Guide to Best Practices for Georeferencing.” Contributors: J. Wieczorek, R. Guralnick, A. Chapman, C. Frazier, N. Rios, R. Beaman, and Q. Guo. Copenhagen, Denmark: Global Biodiversity Information Facility. Accessed September 9, 2011. http://www.gbif.org/prog/digit/Georeferencing. ISBN: 87-92020-00-3.
- Chen, R. 2004. “Gloal Spatial Data and Information Development.” Dissemination and Use Report of a Workshop. Organizers: CIESIN, FAO, UNEP, WHO, and CGIAR Co-Sponsors: CODATA and SEDAC, September 21–23, Lamont-Doherty Earth Observatory, Columbia University.
- Chen, J., Y. Ban, and S. Li. 2014. “China: Open Access to Earth Land-Cover map.” Nature 514 (7523): 434. doi: 10.1038/nature13609
- Chen, J., J. Chen, A. Liao, X. Cao, L. Chen, X. Chen, C. He, et al. 2015. “Global Land Cover Mapping at 30m Resolution: A POK-Based Operational Approach.” ISPRS Journal of Photogrammetry and Remote Sensing 103: 7–27. doi: 10.1016/j.isprsjprs.2014.09.002
- GEO (Group on Earth Observations). 2013. “GEOSS Data Quality Guidelines.” http://earthobservations.org/documents/dsp/GEOSS_Data_Quality_Guidelines.pdf.
- GEO (Group on Earth Observations). 2015. “Open Access to Earth Information Data and Knowledge.” Ministerial Declaration Mexico, November.
- Glynn, P., L. Jacobsen, G. Phelps, G. Bawden, V. Grauch, R. Orndorff, R. Winston, M. Fienen, V. Cross, and J. Bratton. 2011. “3D/4D Modeling, Visualization and Information Frameworks: Current US Geological Survey Practice and Needs.” Three-Dimensional Geologic Mapping Workshop, Minneapolis, MN, 33–39. https://www.glerl.noaa.gov//pubs/fulltext/2011/20110040.pdf.
- Herold, M., L. See, N. Tsendbaztzar, and S. Fritz. 2016. “Towards an Integrated Global Land Cover Monitoring and Mapping System.” Remote Sensing 8 (12): 1036. doi:10.3390/rs8121036.
- ICSU (International Council for Science). 2013. “Research Framework for Future Earth.” http://www.icsu.org/future-earth/media-centre/relevant_publications/future-earth-research-framework.
- ICSU (International Council for Science) 2015. “Open Data in a Big Data World.” http://www.icsu.org/science-international/accord/open-data-in-a-big-data-world-short.
- IPCC (Intergovernmental Panel on Climate Change). 2008. “Integrating Socio-Economic Information in Assessments of Impact, Vulnerability and Adaptation to Climate Change.” http://unfccc.int/files/adaptation/sbsta_agenda_item_adaptation/application/pdf/background_paper_tt_web.pdf.
- Menna, F., A. Rizzi, E. Nocerino, F. Remondino, and A. Gruen. 2012. “High Resolution 3D Modeling of the Behaim Globe.” ISPRS – International Archives of the Photogrammetry, Remote Sensing and Spatial Information Sciences XXXIX-B5: 115–120. doi: 10.5194/isprsarchives-XXXIX-B5-115-2012
- Miller, H. 2007. “Place-Based Versus People-Based Geographic Information Science.” Geography Compass 1: 503–535. doi: 10.1111/j.1749-8198.2007.00025.x
- Moran, F. E. 2002. “Spatial Integration of Social and Biophysical Factors Related to Landcover Change.” Population and Development Review 28 (Supplement: Population and Environment: Methods of Analysis): 165–186.
- Moran, E. F. 2012. “Environmental Social Science: Human–Environment Interactions and Sustainability.” International Journal of Social Research Methodology 10 (5): 445–450.
- Science International. 2015. Open Data in a Big Data World. Paris: International Council for Science (ICSU), International Social Science Council (ISSC), The World Academy of Sciences (TWAS), InterAcademy Partnership (IAP) Science International. www.science-international.org.
- Spence, Ian. 2006. “William Playfair and the Psychology of Graphs.” 2006 JSM Proceedings, American Statistical Association, Alexandria, 2426–2436.