
ABSTRACT
Detecting changes in vegetation, distinguishing the persistence of changes, and seeking their causes during multiple periods are important to gaining a deeper understanding of vegetation dynamics. Using the Global Inventory Modeling and Mapping Studies Normalized Difference Vegetation Index (NDVI) version NDVI3g dataset in the Tibetan Plateau, the trends in the seasonal components of NDVI and their linkage with climatic factors were analyzed over 14 asymptotic periods of 18–31 years since 1982. Dynamic trends in vegetation experienced an obvious increase at regional scale, but the increases of vegetation activity mostly tended to stall or slow down as the studied time period was extended. At pixel scale, areas with significant browning significantly expanded over 14 periods for all seasons, but for significant greening significantly increased only in autumn. The changes of vegetation activity in spring were the most drastic among three seasons. Increased increments of NDVI in summer, spring, and autumn took turns being the main reason for the enhanced vegetation activity in the growing season in the nested 14 periods. Vegetation activity was mainly regulated by a thermal factor, and the dominant climatic drivers of vegetation growth varied across different seasons and regions. We speculate that the increase of NDVI will continue but the increments will decline in all seasons except autumn.
1. Introduction
Life on Earth ultimately depends on solar energy (Haberl et al. Citation2004); that energy enters the predominantly biosphere through absorption by plants. As a major component of the terrestrial ecosystem, vegetation not only provides food, oxygen, and shelter for humans, but also plays an important role in maintaining the stability of the earth’s climate through the exchange of energy and the water cycle (Wang et al. Citation2011; Piao et al. Citation2011b; Peng et al. Citation2012). Furthermore, vegetation helps regulate the global carbon cycle; this occurs because the variation in terrestrial net carbon uptake is primarily controlled by the variation of vegetative productivity (Piao et al. Citation2011b). Thus, the monitoring of the dynamics of vegetation growth and understanding the relationship and interaction of vegetation with climate have been crucial topics in global change research (Piao et al. Citation2011b; Xu et al. Citation2014; Zhu et al. Citation2016).
A long-term Normalized Difference Vegetation Index (NDVI) record can provide a powerful tool to understanding the history of vegetation growth, to monitor current conditions, and to prepare for future changes (van Leeuwen et al. Citation2006; Piao et al. Citation2011b). The Global Inventory Modeling and Mapping Studies (GIMMS) NDVI dataset is one of the best datasets available for detecting vegetation activity (Alcaraz-Segura et al. Citation2010; Beck et al. Citation2011; Beck and Goetz Citation2011; Fensholt et al. Citation2012). In 2014, the newest NDVI dataset, called GIMMS NDVI3g and covering from 1981 to 2012 was released; an analysis of the quality of this new dataset shows that the GIMMS NDVI3g meets the general needs required for regional vegetation monitoring (Zeng et al. Citation2013; Dardel et al. Citation2014; Pinzon and Tucker Citation2014; Wang et al. Citation2014). This dataset provides the possibility of detecting the trends in NDVI based on long-term sequences from the 1980s to more recent years; this information obviously has more important scientific and practical implications and can be used by natural resource managers in their effort to design and apply adaptive ecological management strategies.
As one of the earth’s regions most sensitive to climatic changes, the Tibetan Plateau (TP) has been recognized as a hotspot for couple studies on the terrestrial ecosystem and climate change. The TP serves as an ecological safety net for China and even for East Asia through exerting major effects on regional and global climate through thermal and mechanical forcing mechanisms (Qin et al. Citation2009; Shichang et al. Citation2010; Yang et al. Citation2010; Duan et al. Citation2011; Liu and Wang Citation2011; Duan et al. Citation2012a, Citation2012b). The TP has experienced strong climate changes in recent years, such as pronounced warming (Qin et al. Citation2009; Shichang et al. Citation2010; Duan et al. Citation2011; Yang et al. Citation2014) and a major drying trend (Huang et al. Citation2011). These changes greatly affect the growth of vegetation (Yang, Ding, and Chen Citation2005; Yang and Piao Citation2006; Mao et al. Citation2007; Ding et al. Citation2010; Zhang et al. Citation2010; Xu et al. Citation2011, Citation2012; Peng et al. Citation2012; Mohammat et al. Citation2013) and phenological shifts (Yu, Luedeling, and Xu Citation2010; Shen et al. Citation2011; Piao et al. Citation2011a, Citation2011b; Yu et al. Citation2012; Ding et al. Citation2013; Zhang et al. Citation2013). Past studies using the GIMMS NDVI dataset commonly use 1982 as a starting year, with ending years of 1999, 2002, 2003, and 2006 (Yang and Piao Citation2006; Ding et al. Citation2010; Yu, Luedeling, and Xu Citation2010; Zhang et al. Citation2010, Citation2013; Shen et al. Citation2011, Citation2014; Peng et al. Citation2012; Yu et al. Citation2012). These reports found that NDVI generally increased in the TP over time. Research appears to be lacking for the contribution of seasonal vegetation change to annual vegetation dynamics and a comparative analysis between the results of multi-periods. Some uncertainty and controversy remain related to the vegetation greenness and phenological trends on the TP (Shen et al. Citation2013; Zhang et al. Citation2013); therefore, gaining a better understanding of the changes in the NDVI and their climate controls during a longer time span in different seasons is needed.
For these reasons, the GIMMS NDVI3g dataset was used to investigate the dynamic changes occurring within the vegetation of the TP over 14 periods: 1982–1999, 1982–2000, … , 1982–2012 at different temporal and spatial scales in the present study, as well as to analyze the correlations of vegetation with temperature, precipitation, and sunshine duration. In order to compare with the previous research (Yang and Piao Citation2006) and considering the appropriate time span, the first period of 1982–1999 was selected. The main questions addressed in this paper are:
Which season is the largest contributor to the change in NDVI in the growing season (April–October)? Also, how has this changed as the time period extended?
What were the main climatic drivers for the observed vegetation changes on the TP?
2. Materials and methods
2.1. Studied areas
The TP, located in southwestern China, lies within 26.0–39.8°N, 78.3–104.8°E, and covers about one-quarter of China’s territory at a mean elevation of more than 4000 m a.s.l. As the highest and most extensive highland in the world, the TP supports unique vegetation types and climate features. The plateau climate in the study area exhibits a gradient from warm and humid in the southeast to cold and dry in northwest, which leads to a wide spatial differentiation of biomes (Peng et al. Citation2012). Hydrothermal conditions on the TP reach the biological limit for terrestrial ecosystems making those ecosystems extremely sensitive to climate change.
2.2. Data sources and processing
The GIMMS NDVI3g dataset was derived from the NOAA/AVHRR dataset with a spatial resolution of 0.083° × 0.083° over a 15-d interval from 1982 to 2012. The GIMMS NDVI3g dataset has been corrected to minimize the effects of volcanic eruptions and difference in sensor design; these datasets can be used to evaluate the long-term trends in vegetation activity (Pinzon and Tucker Citation2014). The long-term monthly climatic data (142 weather stations in (79 stations) and around (63 stations) the TP, see supplementary Figure S1), including mean temperature, precipitation, and sunshine hours, were acquired from the China Meteorological Data Sharing Service System.
The monthly GIMMS NDVI3g dataset was obtained using the Maximum Value Composite method. To reduce the influence of sparsely vegetated pixels on the NDVI trend, and following other similar research in the same area (Shen et al. Citation2011; Piao et al. Citation2011a, Citation2011b; Mohammat et al. Citation2013; Zhang et al. Citation2013), pixels with a mean growing season NDVI < 0.10 were excluded from this study.
2.3. Methods
To gain insight into the contribution of each season to the change in total growing season NDVI, the growing season was divided into three seasons for individual analysis: spring (April–May), summer (June–August), and autumn (September–October). NDVI of the growing and its three single seasons were calculated as the average of NDVI during the corresponding months. Least-squares linear regression was applied to detect trends in the NDVI of the growing and its three single seasons during each given period at regional and pixel scales. To better reflect the relative range of change in NDVI, the percent change in NDVI was measured as the ratio of the linear regression slope to the mean annual NDVI during 1982–2012 (Yang and Piao Citation2006). Moreover, the contribution of change in NDVI in a single season to the total amount of NDVI change in the entire growing season equals the ratio of the amount of change in NDVI in a single season to that in the growing season. The amount of NDVI change in a season and the entire growing season was calculated as the product of NDVI slope and the number of corresponding months.
To further explore the climatic factors driving NDVI change, inter-annual correlations between NDVI and climatic variables were calculated using the Pearson correlation coefficient. Similar to other related research studies (Zhao et al. Citation2011; Li, Wu, and Huang Citation2012), we used the ordinary Kriging method to generate individual maps for temperature, precipitation, and sunshine hours with the same resolution and geographic coordinate system as those of the GIMMS NDVI3g dataset. We also calculated the percentage area that showed positive or negative trends in NDVI as well as that which showed positive or negative correlation between NDVI and climatic factors in the 14 nested time series. Meanwhile, to distinguish the main control climate factors under different hydrothermal conditions, we analyzed the correlations between NDVI and climatic factors at sub-region scale () according the eco-geographical divisions (Zheng Citation2008). Significance tests of trends in vegetation dynamics and correlations between NDVI and climate were conducted using the correlation coefficient of the linear regression. Based on the results of the significance tests, trends, or correlations these were classified into three ranks: prominent or very significant (P < .01), significant (P < .05), and not significant (P > .05).
Table 1. Delineation of eco-geographic region system of Tibetan Plateau.
3. Results
3.1. NDVI trends
3.1.1. Trends at a regional scale
The mean NDVI across the TP in all seasons and growing season increased with fluctuations during the 14 periods () and these increases were significant () in the growing and spring seasons during 13 periods (R2 ≥ 0.13, R2 ≥ 0.09, excluding n = 31 in spring and n = 27 in growing season), in summer during only the first four periods (R2 ≥ 0.28, n = 18–21), and in autumn during only the last three periods (R2 ≥ 0.17, n = 29–31). Among seasons, the rate of increase in NDVI in spring is greater than the correspondent rates of other seasons during the first and 5th–11th periods, in the summer during the 2nd–4th periods, and in autumn during the 12th–14th periods (). As the NDVI record grew in length, the rates of increase showed a very significantly decrease in the growing season (R2 = 0.81, n = 14), spring (R2 = 0.87), and summer (R2 = 0.76) seasons, and a significant increase (R2 = 0.35) in autumn ().
Figure 1. Inter-annual variations of NDVI on the Tibetan Plateau. Solid black lines represent the area-average growing season and seasonal NDVI, and dashed lines indicate linear fit during the period of 1982–2012. (a) growing season; (b) spring; (c) summer; (d) autumn.
Figure 2. Variations of seasonal NDVI inter-annual slope during 14 periods.
Although the percent NDVI increases in spring were more than those in summer and autumn during all periods, the maximum among the three seasons of the total amounts of NDVI change occurs in summer during the first five periods. This is because the NDVI changes in summer were significant in four of these five periods () and summer NDVI values are largest () with summer time length one month longer than spring’s or autumn’s. However, as the NDVI change during summer became non-significant (), the greatest magnitudes of NDVI change shifted to spring during the 6th–11th periods and to autumn during the last three periods ().
Table 2. The percent (%·yr−1) and the total amounts of NDVI change (10–2/yr) in all seasons during 14 periods of analysis.
3.1.2. Spatial patterns of NDVI trend
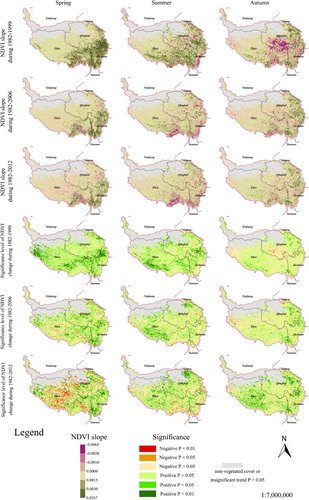
From 1982 to 2012, significant increase of NDVI was found in over 24% and 17% of the vegetated area for the growing season and autumn, respectively; most of these pixels were concentrated in the northeastern part of Qinghai, southwestern Tibet and the part of Sichuan that lies within the TP, whereas pixels characterized by significantly decreased NDVI were fewer and fragmented. Significant greening in spring during 1982–2012 was observed over 17%, which is mainly located in the eastern part of TP; in addition, significant browning mainly occurred in the majority of Tibet and the western part of Qinghai. Over 15%, mainly in the central and northeastern TP, showed an significant increasing trend in summer NDVI during 1982–2012, and the significant decrease mainly distributed in the eastern and southern perimeters of the TP. Compared with the spatial pattern of change in NDVI during the last period, areas with a significant change in NDVI were usually smaller for the growing, summer, and autumn seasons, but the distribution was more concentrated during the former 13 periods ( and ).
Figure 3. Spatial distribution of trends of NDVI in the growing season during selected periods.
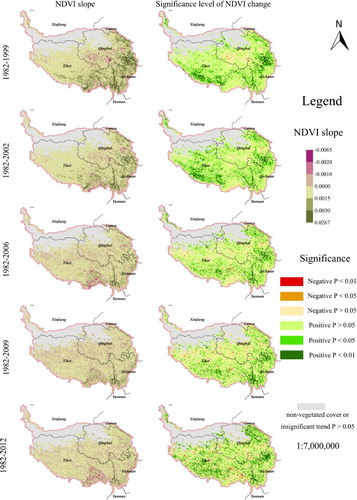
Figure 4. Spatial distribution of trends in seasonal NDVI during selected periods.
More than 56% of the vegetated area showed increasing trend of NDVI in all three seasons during all periods, and the number of pixels with a significantly increasing trend was also more than that with a significantly decreasing trend. Areas with positive trends of NDVI very significantly decreased over 14 periods in the growing, spring, and summer seasons (R2 = 0.72, R2 = 0.99, R2 = 0.70), and that showed a slight increase in autumn. The significant browning area in all seasons very significantly increased (R2 = 0.92, R2 = 0.88, R2 = 0.88, R2 = 0.30) as the length of the period increased, and that with significant greening decreased significantly in summer (R2 = 0.39, n = 14), increased very significantly in autumn (R2 = 0.82), slightly increased in the growing season, and decreased in spring ().
Table 3. The proportion of pixels characterized by different levels of statistical significance during 14 periods.
3.2. Effects of climate change on NDVI trends
3.2.1. Relationship between NDVI and climatic factors at a regional scale
Positive correlations between NDVI and temperature in the growing, spring, and autumn seasons were strong (), and significant correlations were found in all periods for spring and autumn, and in most periods for the growing season. Moreover, these correlations increased as the studied time period grow. The NDVI-precipitation and NDVI-sunshine duration relationships for three seasons and NDVI-precipitation for the growing season were weak during all 14 periods, and the NDVI-sunshine duration relationships in the growing season were strongly negative during the first few periods ().
Table 4. Correlation coefficients between NDVI and climate during 14 periods.
In order to explore the lag effects of vegetation change to precipitation, we also calculated the correlation coefficients between summer and autumn NDVI and preceding precipitation (). The results show that both summer and autumn NDVI significantly and positively correlated with spring precipitation, and correlations between autumn NDVI and summer precipitation were pretty weak. Spring precipitation may be beneficial to soil water in summer and autumn.
Table 5. Correlations between summer and autumn NDVI vs. preceding season precipitation.
3.2.2. Relationship between NDVI and climatic factors at a division scale
Because there are much less vegetated pixels in divisions of HIID1, HIID2, and HID1, these three divisions were excluded from our analysis (Figure S1). Strong positive correlations between NDVI and sunshine duration have been observed in VA5 and VA6, where there are no remarkable correlations between NDVI and both temperature and precipitation. HIB1 and HIIAB1 may be a temperature-limited area on account of significant and positive correlations between NDVI and temperature. The NDVI correlated strongly and positively to both temperature and sunshine duration in HIC1 and HIC2 in autumn, and significantly and negatively to precipitation in summer. All three climate variables played an important role in vegetation activity in HIIC1 and HIIC2. For HIID3, only a significant positive correlation and a significant negative correlation between summer NDVI and sunshine duration and precipitation were observed, respectively ().
Table 6. Statistics of correlations between NDVI and climate factors during 1982–2012 at division scale.
3.2.3. Spatial pattern of NDVI-climate relationships
3.2.3.1. Relationship between NDVI and temperature
In over 55% and 11% (except for summer) of the vegetated area during 14 periods, NDVI was insignificantly and significantly positively correlated with temperature. Among all seasons, spring had the largest area (about 25%) with a significant positive correlation during the 14 periods, followed by autumn (). For all seasons, pixels with significant negative correlations increased very significantly (R2 = 0.81, R2 = 0.73, R2 = 0.62, R2 = 0.51), and those with positive correlation except autumn decreased significantly (R2 = 0.60, R2 = 0.28, R2 = 0.89) as the study period grew in length. Pixels with significant positive correlations in all seasons were mainly distributed in central and eastern TP, whereas significant negative correlations were concentrated in southwestern TP in summer. Compared with the findings during 1982–2012, areas with both significant positive and negative correlations during 1982–1999 for the growing, summer, and autumn seasons shrunk somewhat but their distribution was more concentrated; also, those with significant negative correlations declined rapidly and those with significant positive correlations remained relatively constant for spring ().
Figure 5. Spatial distribution of correlations between NDVI and temperature in all seasons during selected periods.
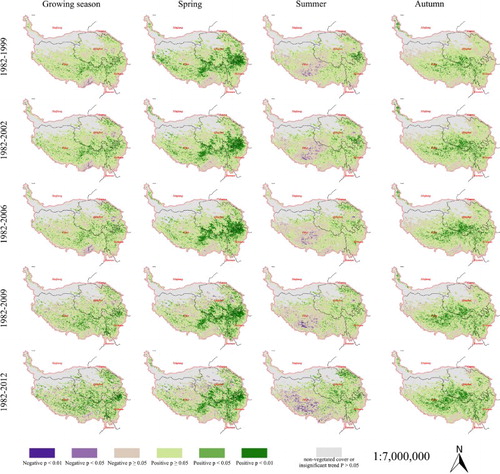
Table 7. The proportion of pixels characterized by different levels of statistical significance for the correlation between NDVI and temperature during 14 periods (%).
3.2.3.2. Relationship between NDVI and precipitation
The areas with a significantly positive correlation for the growing and summer seasons during all periods were markedly larger than those with a significantly negative correlation, whereas the opposite was true for spring and autumn (). For all seasons, the pixels with significant negative correlations increased very significantly (R2 = 0.75, R2 = 0.80, R2 = 0.75, R2 = 0.59) as the study period grew in length, and those with significant positive correlations also increased significantly for the growing, spring, and autumn seasons (R2 = 0.30, R2 = 0.43, R2 = 0.50). Pixels with significant positive correlations in the growing and summer seasons were mainly concentrated in northeastern and southwestern TP and those with significant negative correlation in southeastern TP ().
Figure 6. Spatial distribution of correlations between NDVI and precipitation in all seasons during selected periods.
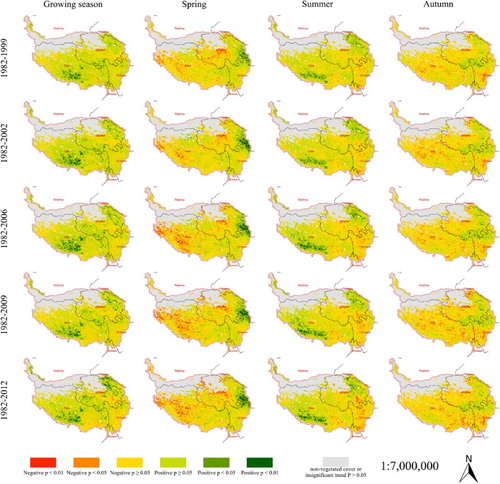
Table 8. The proportion of pixels characterized by different levels of statistical significance for the correlation between NDVI and precipitation during 14 periods (%).
3.2.3.3. Relationships between NDVI and sunshine duration
For three seasons, more than 50% of the pixels were characterized by a positive correlation and the area with a significant positive correlation was also larger than that with a significant negative correlation during all periods, although this was not true for the growing season (). Pixels both with positive and significant positive correlations increased in number significantly (positive: R2 = 0.85, R2 = 0.68, R2 = 0.76, R2 = 0.37, significant positive: R2 = 0.90, R2 = 0.78, R2 = 0.87, R2 = 0.75) for all seasons as the study period grew in length. Significant negative correlations for the growing and summer seasons were observed in relatively more pixels during all periods, mostly in northeastern and southwestern TP ().
Figure 7. Spatial distribution of correlations between NDVI and sunshine hour in all seasons during selected periods.
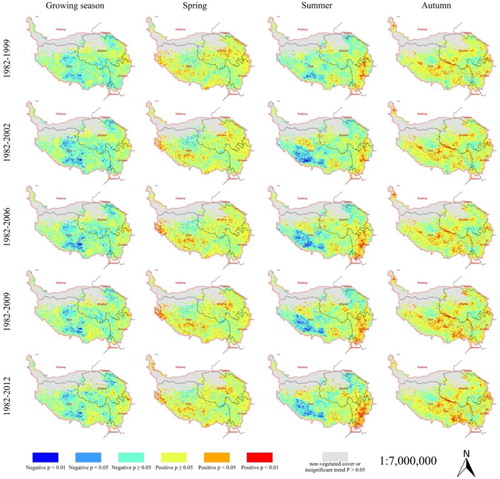
Table 9. The proportion of pixels characterized by different levels of statistical significance for the correlation between NDVI and sunshine duration during 14 periods (%).
4. Discussion
4.1. Analysis of NDVI trend
The general increase in vegetation activity in the TP for all seasons had persisted after 2006. However, the increments of NDVI decreased significantly with progressively longer time series since 1982 during the growing season. This was attributed to the very significant decrease of NDVI increment in spring and summer as the lengths of periods analyzed grew longer. In addition, the phenomenon of the modifiable temporal unit problem may partly contribute to the reduction of the NDVI increment for the growing, spring, and summer seasons over periods at a regional scale (de Jong and de Bruin Citation2012; Cheng and Adepeju Citation2014).
At a pixel scale, the increase of spatial area with a significant decrease of NDVI for spring and summer grew faster than that with a significant increase as the study period grew in length. This may result in the slowing, even stalling of the increase in NDVI in the future at a whole region scale.
The change in the growing season NDVI is an average of changes in spring, summer, and autumn NDVI (Piao et al. Citation2011b). The contribution of a single season to the total amount of NDVI change in the growing season varied as the study period grew in length. This essentially reflected the difference of persistence in the NDVI trend among seasons. Spatial patterns of NDVI change in the growing season during1982–1999 were more similar to that in summer, but during 1982–2012 they were similar to that in autumn ( and ). This fact further demonstrated the contribution of seasons to the change as the NDVI record grew in length.
The discrepancy of NDVI trends among seasons may indicate that the enhancement of NDVI in the growing season mainly resulted from accelerated vegetation activity and the advanced growing season before 2005, and from both the advanced growing season and the delay in the end date of the growing season in the more recent years. The trends in autumn NDVI appear consistent with other studies (Jeong et al. Citation2011; Che et al. Citation2014) that have concluded the end of the growing season has been delayed more and more over the study period.
4.2. Response of vegetation growth to climate change
Vegetation activity in cold and high elevation regions such as the TP is generally assumed to be very sensitive to temperature (Yang and Piao Citation2006; Zhang et al. Citation2010; Hu et al. Citation2011; Piao et al. Citation2011b). The present analysis of the correlation between NDVI and temperature confirmed this assumption; warming is one of the main drivers of the enhancement of vegetation growth. But the responses of vegetation growth to climate change vary across different seasons and regions.
In both spring and autumn, NDVI was more strongly positively correlated with temperature than with precipitation, and the spatial extent of the area with a significant negative correlation between NDVI and precipitation was larger than that with significant positive correlation; the opposite phenomenon was found for the correlation between NDVI and both temperature and sunshine duration. This suggested that vegetation growth in spring and autumn on large parts of the TP was mainly controlled by temperature and sunshine duration, which both reflected thermal conditions.
The significant positive correlation between NDVI and precipitation and the significant negative correlation between NDVI and sunshine duration generally dominate in southwestern and northeastern TP ( and ), respectively, where precipitation is relatively less and sunshine abundant (Zhang et al. Citation2010), see Figure S2. But on southeastern TP (i.e. VA5, VA6, and HIIAB1 divisions) with more moisture and less sunshine, correlations between NDVI and climate factors were the opposite: the correlation between NDVI and precipitation is significant and negative and that between NDVI and sunshine duration is significant and positive. Strong negative correlations between spring NDVI and precipitation ( and ) in most of TP except HIIC1 were partly caused by water from melting of winter snow, glaciers and permafrost, which enriched the soil water content (Zhang et al. Citation2004; Yang, Ding, and Chen Citation2005) and weakened the dependence of vegetation growth on rain (Fensholt and Rasmussen Citation2011). However, spring precipitation may promote vegetation activity in summer and autumn (); this also reflected the nonlinear responses of vegetation growth to climate changes and complicated interactions among different climate factors (Hu et al. Citation2011; Peng et al. Citation2011; Piao et al. Citation2011b).
The present results do not fully support findings from previously published literature; for example, Yu et al. (Citation2012) found that vegetation is not well adjusted to climate and is unable to exploit additional thermal resources that are made available by global warming. Temperature and NDVI increased significantly, and NDVI was significantly and positively correlated with temperature during the last few periods for the growing, summer, and autumn seasons. This indicates that the effects of increasing temperature on vegetation greening is still effective in some seasons. The influence of increasing temperature on vegetation growth may differ among seasons. In spring, temperature increased significantly (R2 > 0.38, n = 18–31) during all 14 periods, but NDVI decreased non-significantly after 1998. But in autumn, the increasing trends of vegetation activity persisted and became amplified during more recent periods. A possible explanation is that the increased vegetative growth in spring that was driven by warming may have been counterbalanced by the inhibition of vegetative growth caused by the trend for additional moisture and a greater reduction in sunshine duration (Figure S3) that combined to result in a net decrease in the NDVI during the last decade in the present study.
Although the slowdown of NDVI increase should be mainly regulated by climate change at large scale across whole TP, significant decrease in NDVI at the local scale may result from human disturbance. For example, as the first large-scale cascade hydropower station, Longyangxia hydropower plant and reservoir (the location see Figure S1) building has lasted for many years, which caused the reduction of vegetation coverage around and in the construction site during the early periods, and vegetation has been restored during the recent periods with the implementation of ecological protection (Du, Shu, and Zhang Citation2012). Consumption of forest resources and sharply increasing number of tourists (Wei, Liu, and Qiong Citation2008) may has contributed to the degradation of forest vegetation in the Linzhi prefecture (the location see Figure S1) of Tibet Autonomous Region (Zhu et al. Citation2010). In addition, the implementation of the ecological protection and restoration project that started from 2005 in the three-river headwater region (TRHR) has a certain role in stopping the degradation trend and promoting the recovery of vegetation (Xu et al. Citation2011; Liu et al. Citation2013; Du et al. Citation2016b).
Gaining a deeper understanding of the long-term trends of vegetation activity and its causes provides the basis for reasonably predicting future vegetation dynamics and for reducing the uncertainty present in forecasts (van Leeuwen et al. Citation2006; Piao et al. Citation2011a, Citation2011b). Although the linear regression method is simple, robust, and its results are easy to interpret (Fensholt et al. Citation2009; Peng et al. Citation2012), the overall linear trend cannot accurately show the actual temporal patterns of change in vegetation growth during the entire study period (de Jong et al. Citation2011, Citation2012; Piao et al. Citation2011b). Using general ecological models to simulate future vegetation change has proved to be difficult (Yu et al. Citation2012; Xu et al. Citation2014). The investigation of spatio-temporal changes of vegetation and their relationship with climatic factors during multiple nested periods is likely becoming one of the methods that can be used to effectively address this problem in the study of vegetation change and projection of that change. Over progressively longer periods since the beginning year of the study, detecting the changes of vegetation growth and exploring the trend in the annual variation rates of NDVI during each period may provide the future trajectory of vegetation change. Therefore, the area with a significant decrease in vegetation activity in all seasons will expand, while the area with significant increase in summer will shrink, and expand further in autumn. At a regional scale, enhancement of vegetation activity in the growing, summer, and spring seasons will gradually decelerate and tend to stall, but should continuously strengthen in autumn. However, it is worth mentioning that NDVI change in future is mainly controlled by climate variation and human activities at large scale.
The results of using GIMMS NDVI3g are not completely consistent with that using GIMMS NDVIg and Moderate-Resolution Imaging Spectroradiometer (MODIS) NDVI (Du et al. Citation2016a; Du et al. Citation2016c), such as in terms of NDVI trends in spring during the last few periods, the changes of area with result in a significant increase in NDVI during spring and summer, etc. Other satellite-derived NDVI data with better quality (e.g. MODIS NDVI, Landsat TM/ETM NDVI), long-term ecological datasets from ground observations, including eddy flux tower observations, may be used to further evaluate which GIMMS NDVI dataset was more reliable and could better reflect the actual variation in vegetation activity on the TP in the future (Jiang et al. Citation2013).
5. Conclusions
The results presented in this study demonstrate that the increasing vegetation productivity in the TP as found in previous studies persisted in the last decade; in particular, the increase was significant in the spring and growing seasons during almost all periods. The rate of increase in the NDVI during the growing season prominently and significantly declined as the studied period was extended, which means the NDVI was stagnant or slowed down over time and vegetation activity tended to stabilize. This also occurred in spring and summer, but increments of vegetation activity in autumn largely increased over time. At a pixel scale, the area with a significant decrease of NDVI in all seasons rapidly expanded as the study period grew in length, but that with a significant increase spatially enlarged only in autumn.
Based on the percent change in the NDVI, the changes of vegetation activity in spring were most dramatic among the three seasons during the 14 periods. The contribution of seasonal vegetation activity to plant growth in the growing season varied with increasing time used for the study period. The largest increments of NDVI were found in summer during the first five periods, in spring during the subsequent six periods, and in autumn during the last three periods. Accelerated vegetation growth, an earlier onset of the vegetation green-up, and a delay of fall phenology may turn out to be the main reasons for the enhanced vegetation activity in the TP as the study period grew in length.
Overall, vegetation activity was mainly regulated by the thermal factor, especially by temperature and at spring and autumn. The dominant climatic drivers of vegetation growth varied across different seasons and regions with different hydrothermal conditions. The persistence of promoting vegetation growth driven by warming may have varied between seasons, rising temperatures may continue to promote the activity of autumn vegetation, and this role was obvious only in the first few periods for spring and summer.
Trend analysis during the multiple nested time series may contribute to a better and deeper understanding of changes in NDVI and to foreseeing its future trajectory. It can thus be speculated that the increase of spring and summer NDVI is expected to stall further, autumn NDVI will continuously increase, and the magnitude of the increase in NDVI for the growing season will further slowdown in the future. However, the extent of the area with a significant decrease in NDVI mostly will increase significantly for growing and three individual seasons.
Supplementary_Materials.zip
Download Zip (18.2 MB)Acknowledgements
We thank LetPub (www.letpub.com) for linguistic assistance during the preparation of this manuscript.
Disclosure statement
No potential conflict of interest was reported by the authors.
Additional information
Funding
Related Research Data
References
- Alcaraz-Segura, Domingo, Elisa Liras, Siham Tabik, José Paruelo, and Javier Cabello. 2010. “Evaluating the Consistency of the 1982–1999 NDVI Trends in the Iberian Peninsula Across Four Time-series Derived from the AVHRR Sensor: LTDR, GIMMS, FASIR, and PAL-II.” Sensors 10 (2): 1291–1314. doi: 10.3390/s100201291
- Beck, Pieter S. A., and Scott J. Goetz. 2011. “Satellite Observations of High Northern Latitude Vegetation Productivity Changes Between 1982 and 2008: Ecological Variability and Regional Differences.” Environmental Research Letters 6 (4): 5501–5511. doi: 10.1088/1748-9326/6/4/045501
- Beck, Hylke E., Tim R. McVicar, Albert I. J. M. van Dijk, Jaap Schellekens, Richard A. M. de Jeu, and L. Adrian Bruijnzeel. 2011. “Global Evaluation of Four AVHRR–NDVI Data sets: Intercomparison and Assessment Against Landsat Imagery.” Remote Sensing of Environment 115 (10): 2547–2563. doi: 10.1016/j.rse.2011.05.012
- Che, Mingliang, Baozhang Chen, John L. Innes, Guangyu Wang, Xianming Dou, Tianmo Zhou, Huifang Zhang, Jianwu Yan, Guang Xu, and Hongwei Zhao. 2014. “Spatial and Temporal Variations in the End Date of the Vegetation Growing Season Throughout the Qinghai–Tibetan Plateau from 1982 to 2011.” Agricultural and Forest Meteorology 189–190 (0): 81–90. doi: 10.1016/j.agrformet.2014.01.004
- Cheng, T., and M. Adepeju. 2014. “Modifiable Temporal Unit Problem (MTUP) and its Effect on Space-time Cluster Detection.” PLoS ONE 9 (6): e100465. doi: 10.1371/journal.pone.0100465
- Dardel, C., L. Kergoat, P. Hiernaux, E. Mougin, M. Grippa, and C. J. Tucker. 2014. “Re-greening Sahel: 30 Years of Remote Sensing Data and Field Observations (Mali, Niger).” Remote Sensing of Environment 140: 350–364. doi: 10.1016/j.rse.2013.09.011
- Ding, Mingjun, Yili Zhang, Linshan Liu, and Zhaofeng Wang. 2010. “Temporal and Spatial Distribution of Grassland Coverage Change in Tibetan Plateau Since 1982.” Journal of Natural Resources 25 (12): 2114–2122.
- Ding, MingJun, YiLi Zhang, XiaoMin Sun, LinShan Liu, ZhaoFeng Wang, and WanQi Bai. 2013. “Spatiotemporal Variation in Alpine Grassland Phenology in the Qinghai-Tibetan Plateau from 1999 to 2009.” Chinese Science Bulletin 58 (3): 396–405. doi: 10.1007/s11434-012-5407-5
- Du, Jiaqiang, Zhao Chenxi, Shu Jianmin, Jiaerheng Ahati, Yuan Xinjie, Yin Junqi, Fang Shifeng, and He Ping. 2016a. “Spatiotemporal Changes of Vegetation on the Tibetan Plateau and Relationship to Climatic Variables During Multiyear Periods from 1982–2012.” Environmental Earth Sciences 75 (1): 1–18. doi:10.1007/s12665-015-4818-4 doi: 10.1007/s12665-015-4873-x
- Du, Jiaqiang, Ahati Jiaerheng, Chenxi Zhao, Shifeng Fang, Weiling Liu, Junqi Yin, Xinjie Yuan, Yanda Xu, Jianmin Shu, and Ping He. 2016b. “Analysis of Vegetation Dynamics Using GIMMS NDVI3g in the Three-Rivers Headwater Region from 1982 to 2012.” Acta Prataculturae Sinica 25 (1): 1–12.
- Du, Jiaqiang, Jianmin Shu, and Linbo Zhang. 2012. “Analysis of Ecosystem Degradation and Recovery Using Precipitation Use Efficiency and NDVI in the Headwater Catchment of the Yellow River Basin.” Acta Ecologica Sinica 32 (11): 3404–3413. doi: 10.5846/stxb201105240681
- Du, Jiaqiang, Yuehui Wang, Huading Shi, Shifeng Fang, Ping He, Weiling Liu, and Junqi Yin. 2016c. “Performance Evaluation of GIMMS NDVI3g and GIMMS NDVIg Based on MODIS and Landsat in Tibetan Plateau.” Transactions of the Chinese Society of Agricultural Engineering 32 (22): 192–199.
- Duan, Anmin, Fei Li, Meirong Wang, and Guoxiong Wu. 2011. “Persistent Weakening Trend in the Spring Sensible Heat Source Over the Tibetan Plateau and Its Impact on the Asian Summer Monsoon.” Journal of Climate 24 (21): 5671–5682. doi: 10.1175/JCLI-D-11-00052.1
- Duan, Anmin, Meirong Wang, Yonghui Lei, and Yangfan Cui. 2012a. “Trends in Summer Rainfall Over China Associated with the Tibetan Plateau Sensible Heat Source During 1980–2008.” Journal of Climate 26 (1): 261–275. doi: 10.1175/JCLI-D-11-00669.1
- Duan, Anmin, Guoxiong Wu, Yimin Liu, Yaoming Ma, and Ping Zhao. 2012b. “Weather and Climate Effects of the Tibetan Plateau.” Advances in Atmospheric Sciences 29 (5): 978–992. doi: 10.1007/s00376-012-1220-y
- Fensholt, Rasmus, Tobias Langanke, Kjeld Rasmussen, Anette Reenberg, Stephen D. Prince, Compton Tucker, Robert J. Scholes, et al. 2012. “Greenness in Semi-arid Areas Across the Globe 1981–2007 – an Earth Observing Satellite Based Analysis of Trends and Drivers.” Remote Sensing of Environment 121 (0): 144–158. doi: 10.1016/j.rse.2012.01.017
- Fensholt, Rasmus, and Kjeld Rasmussen. 2011. “Analysis of Trends in the Sahelian ‘Rain-use Efficiency’ Using GIMMS NDVI, RFE and GPCP Rainfall Data.” Remote Sensing of Environment 115 (2): 438–451. doi: 10.1016/j.rse.2010.09.014
- Fensholt, Rasmus, Kjeld Rasmussen, Thomas Theis Nielsen, and Cheikh Mbow. 2009. “Evaluation of Earth Observation Based Long Term Vegetation Trends – Intercomparing NDVI Time Series Trend Analysis Consistency of Sahel from AVHRR GIMMS, Terra MODIS and SPOT VGT Data.” Remote Sensing of Environment 113 (9): 1886–1898. doi: 10.1016/j.rse.2009.04.004
- Haberl, Helmut, Niels B. Schulz, Christoph Plutzar, Karl Heinz Erb, Fridolin Krausmann, Wolfgang Loibl, Dietmar Moser, et al. 2004. “Human Appropriation of Net Primary Production and Species Diversity in Agricultural Landscapes.” Agriculture, Ecosystems & Environment 102 (2): 213–218. doi: 10.1016/j.agee.2003.07.004
- Hu, Meng Qi, Fei Mao, Han Sun, and Ying Yu Hou. 2011. “Study of Normalized Difference Vegetation Index Variation and its Correlation with Climate Factors in the Three-river-source Region.” International Journal of Applied Earth Observation and Geoinformation 13 (1): 24–33. doi: 10.1016/j.jag.2010.06.003
- Huang, Lin, Jiyuan Liu, Quanqin Shao, and Ronggao Liu. 2011. “Changing Inland Lakes Responding to Climate Warming in Northeastern Tibetan Plateau.” Climatic Change 109 (3–4): 479–502. doi: 10.1007/s10584-011-0032-x
- Jeong, Su-Jong, Chang-Hoi Ho, Hyeon-Ju Gim, and Molly E. Brown. 2011. “Phenology Shifts at Start vs. end of Growing Season in Temperate Vegetation Over the Northern Hemisphere for the Period 1982–2008.” Global Change Biology 17 (7): 2385–2399. doi: 10.1111/j.1365-2486.2011.02397.x
- Jiang, Nan, Wenquan Zhu, Zhoutao Zheng, Guangsheng Chen, and Deqin Fan. 2013. “A Comparative Analysis Between GIMSS NDVIg and NDVI3g for Monitoring Vegetation Activity Change in the Northern Hemisphere During 1982–2008.” Remote Sensing 5 (8): 4031–4044. doi: 10.3390/rs5084031
- de Jong, R., and S. de Bruin. 2012. “Linear Trends in Seasonal Vegetation Time Series and the Modifiable Temporal Unit Problem.” Biogeosciences 9 (1): 71–77. doi: 10.5194/bg-9-71-2012
- de Jong, Rogier, Sytze de Bruin, Michael Schaepman, and David Dent. 2011. “Quantitative Mapping of Global Land Degradation Using Earth Observations.” International Journal of Remote Sensing 32 (21): 6823–6853. doi: 10.1080/01431161.2010.512946
- de Jong, Rogier, Jan Verbesselt, Michael E. Schaepman, and Sytze de Bruin. 2012. “Trend Changes in Global Greening and Browning: Contribution of Short-term Trends to Longer-term Change.” Global Change Biology 18 (2): 642–655. doi: 10.1111/j.1365-2486.2011.02578.x
- van Leeuwen, Willem J. D., Barron J. Orr, Stuart E. Marsh, and Stefanie M. Herrmann. 2006. “Multi-sensor NDVI Data Continuity: Uncertainties and Implications for Vegetation Monitoring Applications.” Remote Sensing of Environment 100 (1): 67–81. doi: 10.1016/j.rse.2005.10.002
- Li, Ang, Jianguo Wu, and Jianhui Huang. 2012. “Distinguishing Between Human-induced and Climate-driven Vegetation Changes: A Critical Application of RESTREND in Inner Mongolia.” Landscape Ecology 27 (7): 969–982. doi: 10.1007/s10980-012-9751-2
- Liu, Xianfeng, Zhiyuan Ren, Zhihui Lin, Yanxu Liu, and Donghai Zhang. 2013. “The Spatial-temporal Changes of Vegetation Coverage in the Three-river Headwater Region in Recent 12 Years.” Acta Geographica Sinica 68 (7): 897–908.
- Liu, Xiaodong, and Yi Wang. 2011. “Contrasting Impacts of Spring Thermal Conditions Over Tibetan Plateau on Late-spring to Early-summer Precipitation in Southeast China.” Atmospheric Science Letters 12 (3): 309–315. doi: 10.1002/asl.343
- Mao, Fei, Zhiguang Lu, Jiahua Zhang, and Yingyu Hou. 2007. “Relations Between AVHRR NDVI and Climate Factors in Northern Tibet in Recent 20 Years.” Acta Ecologica Sinica 27 (8): 3198–3205.
- Mohammat, Anwar, Xuhui Wang, Xiangtao Xu, Liqing Peng, Yan Yang, Xinping Zhang, Ranga B. Myneni, and Shilong Piao. 2013. “Drought and Spring Cooling Induced Recent Decrease in Vegetation Growth in Inner Asia.” Agricultural and Forest Meteorology 178–179 (0): 21–30. doi: 10.1016/j.agrformet.2012.09.014
- Peng, Shushi, Anping Chen, Liang Xu, Chunxiang Cao, Jingyun Fang, Ranga. B. Myneni, Jorge. E. Pinzon, Compton. J. Tucker, and Shilong Piao. 2011. “Recent Change of Vegetation Growth Trend in China.” Environmental Research Letters 6 (4): 4027–4029. doi: 10.1088/1748-9326/6/4/044027
- Peng, Jian, Zhenhuan Liu, Yinghui Liu, Jiansheng Wu, and Yinan Han. 2012. “Trend Analysis of Vegetation Dynamics in Qinghai–Tibet Plateau Using Hurst Exponent.” Ecological Indicators 14 (1): 28–39. doi: 10.1016/j.ecolind.2011.08.011
- Piao, Shilong, Mengdi Cui, Anping Chen, Xuhui Wang, Philippe Ciais, Jie Liu, and Yanhong Tang. 2011a. “Altitude and Temperature Dependence of Change in the Spring Vegetation Green-up Date from 1982 to 2006 in the Qinghai-Xizang Plateau.” Agricultural and Forest Meteorology 151 (12): 1599–1608. doi: 10.1016/j.agrformet.2011.06.016
- Piao, Shilong, Xuhui Wang, Philippe Ciais, Biao Zhu, T. A. O. Wang, and J. I. E. Liu. 2011b. “Changes in Satellite-derived Vegetation Growth Trend in Temperate and Boreal Eurasia from 1982 to 2006.” Global Change Biology 17 (10): 3228–3239. doi: 10.1111/j.1365-2486.2011.02419.x
- Pinzon, Jorge, and Compton Tucker. 2014. “A Non-stationary 1981–2012 AVHRR NDVI3g Time Series.” Remote Sensing 6 (8): 6929–6960. doi: 10.3390/rs6086929
- Qin, Jun, Kun Yang, Shunlin Liang, and Xiaofeng Guo. 2009. “The Altitudinal Dependence of Recent Rapid Warming Over the Tibetan Plateau.” Climatic Change 97 (1–2): 321–327. doi: 10.1007/s10584-009-9733-9
- Shen, Miaogen, Zhenzhong Sun, Shiping Wang, Gengxin Zhang, Weidong Kong, Anping Chen, and Shilong Piao. 2013. “No Evidence of Continuously Advanced Green-up Dates in the Tibetan Plateau Over the Last Decade.” Proceedings of the National Academy of Sciences 110 (26): E2329. doi:D - NLM: PMC3696789 EDAT- 2013/05/11 06:00 MHDA- 2013/09/07 06:00 CRDT- 2013/05/11 06:00 PHST- 2013/05/09 [aheadofprint] AID - 1304625110 [pii] AID - 10.1073/pnas.1304625110 [doi] PST - ppublish doi: 10.1073/pnas.1304625110
- Shen, Miaogen, Yanhong Tang, Jin Chen, Xiaolin Zhu, and Yinghua Zheng. 2011. “Influences of Temperature and Precipitation Before the Growing Season on Spring Phenology in Grasslands of the Central and Eastern Qinghai-Tibetan Plateau.” Agricultural and Forest Meteorology 151 (12): 1711–1722. doi: 10.1016/j.agrformet.2011.07.003
- Shen, Miaogen, Gengxin Zhang, Nan Cong, Shiping Wang, Weidong Kong, and Shilong Piao. 2014. “Increasing Altitudinal Gradient of Spring Vegetation Phenology During the Last Decade on the Qinghai–Tibetan Plateau.” Agricultural and Forest Meteorology 189–190 (0): 71–80. doi: 10.1016/j.agrformet.2014.01.003
- Shichang, Kang, Xu Yanwei, You Qinglong, Flügel Wolfgang-Albert, Pepin Nick, and Yao Tandong. 2010. “Review of Climate and Cryospheric Change in the Tibetan Plateau.” Environmental Research Letters 5 (1), article no. 015101. http://iopscience.iop.org/article/10.1088/1748-9326/5/1/015101/meta doi: 10.1088/1748-9326/5/1/015101
- Wang, Junbang, Jingwei Dong, Jiyuan Liu, Mei Huang, Guicai Li, Steven Running, W. Smith, et al. 2014. “Comparison of Gross Primary Productivity Derived from GIMMS NDVI3g, GIMMS, and MODIS in Southeast Asia.” Remote Sensing 6 (3): 2108–2133. doi: 10.3390/rs6032108
- Wang, Xuhui, Shilong Piao, Philippe Ciais, Junsheng Li, Pierre Friedlingstein, Charlie Koven, and Anping Chen. 2011. “Spring Temperature Change and its Implication in the Change of Vegetation Growth in North America from 1982 to 2006.” Proceedings of the National Academy of Sciences 108 (4): 1240–1245. doi: 10.1073/pnas.1014425108
- Wei, Min, Zhineng Liu, and Da Qiong. 2008. “Study on Relationship Between Climate Change Trend and Forest Resources Degradation in Linzhi Prefecture.” Forest Inventory and Planning 33 (1): 37–40.
- Xu, Weixin, Song Gu, XinQuan Zhao, Jianshe Xiao, Yanhong Tang, Jingyun Fang, Juan Zhang, and Sha Jiang. 2011. “High Positive Correlation Between Soil Temperature and NDVI from 1982 to 2006 in Alpine Meadow of the Three-River Source Region on the Qinghai-Tibetan Plateau.” International Journal of Applied Earth Observation and Geoinformation 13 (4): 528–535. doi: 10.1016/j.jag.2011.02.001
- Xu, Xiangtao, Shilong Piao, Xuhui Wang, Anping Chen, Philippe Ciais, and Ranga. B. Myneni. 2012. “Spatio-temporal Patterns of the Area Experiencing Negative Vegetation Growth Anomalies in China Over the Last Three Decades.” Environmental Research Letters 7 (3), article no. 35701. http://iopscience.iop.org/article/10.1088/1748-9326/7/3/035701#references doi: 10.1088/1748-9326/7/3/035701
- Xu, Guang, Huifang Zhang, Baozhang Chen, Hairong Zhang, John Innes, Guangyu Wang, Jianwu Yan, Yonghong Zheng, Zaichun Zhu, and Ranga Myneni. 2014. “Changes in Vegetation Growth Dynamics and Relations with Climate Over China’s Landmass from 1982 to 2011.” Remote Sensing 6 (4): 3263–3283. doi: 10.3390/rs6043263
- Yang, Jianping, Yongjian Ding, and Rensheng Chen. 2005. “NDVI Reflection of Alpine Vegetation Changes in the Source Regions of the Yangtze and Yellow Rivers.” Acta Geographica Sinica 60 (3): 467–478.
- Yang, Kun, Xiaofeng Guo, Jie He, Jun Qin, and Toshio Koike. 2010. “On the Climatology and Trend of the Atmospheric Heat Source Over the Tibetan Plateau: An Experiments-Supported Revisit.” Journal of Climate 24 (5): 1525–1541. doi: 10.1175/2010JCLI3848.1
- Yang, Yuanhe, and Shilong Piao. 2006. “Variations in Grassland Vegetation Cover in Relation to Climatic Factors on the Tibetan Plateau.” Journal of Plant Ecology 30 (1): 1–8. doi: 10.17521/cjpe.2006.0001
- Yang, Kun, Hui Wu, Jun Qin, Changgui Lin, Wenjun Tang, and Yingying Chen. 2014. “Recent Climate Changes Over the Tibetan Plateau and Their Impacts on Energy and Water Cycle: A Review.” Global and Planetary Change 112 (0): 79–91. doi: 10.1016/j.gloplacha.2013.12.001
- Yu, Haiying, Eike Luedeling, and Jianchu Xu. 2010. “Winter and Spring Warming Result in Delayed Spring Phenology on the Tibetan Plateau.” Proceedings of the National Academy of Sciences 107 (51): 22151–22156. doi: 10.1073/pnas.1012490107
- Yu, Haiying, Jianchu Xu, Erick Okuto, and Eike Luedeling. 2012. “Seasonal Response of Grasslands to Climate Change on the Tibetan Plateau.” PLoS ONE 7 (11): e49230. doi: 10.1371/journal.pone.0049230
- Zeng, Fan-Wei, G. Collatz, Jorge Pinzon, and Alvaro Ivanoff. 2013. “Evaluating and Quantifying the Climate-Driven Interannual Variability in Global Inventory Modeling and Mapping Studies (GIMMS) Normalized Difference Vegetation Index (NDVI3g) at Global Scales.” Remote Sensing 5 (8): 3918–3950. doi: 10.3390/rs5083918
- Zhang, Geli, Hua Ouyang, Xianzhou Zhang, Caiping Zhou, and Xingliang Xu. 2010. “Vegetation Change and its Responses to Climatic Variation Based on Eco-geographical Regions of Tibetan Plateau.” Geographical Research 29 (11): 2004–2016.
- Zhang, Senqi, Yonggui Wang, Yongzhen Zhao, Yong Huang, Yongguo Li, Weidong Shi, and Xiaogang Shang. 2004. “Permafrost Degradation and Its Environmental Sequent in the Source Regions of the Yellow River.” Journal of Glaciology and Geocryology 26 (1): 1–6.
- Zhang, Geli, Yangjian Zhang, Jinwei Dong, and Xiangming Xiao. 2013. “Green-up Dates in the Tibetan Plateau Have Continuously Advanced from 1982 to 2011.” Proceedings of the National Academy of Sciences. doi:10.1073/pnas.1210423110.
- Zhao, X., K. Tan, S. Zhao, and J. Fang. 2011. “Changing Climate Affects Vegetation Growth in the Arid Region of the Northwestern China.” Journal of Arid Environments 75 (10): 946–952. doi: 10.1016/j.jaridenv.2011.05.007
- Zheng, Du. 2008. Eco-geographical Region System of China. Beijing: The Commercial Press.
- Zhu, Yuan, Guangxiong Peng, Zhi Wang, Zongqian Rang, Zhenlei Zhang, Dan Li, Jianing Liu, Baoxiong Chen, and Qingshan Ren. 2010. “Temporal and Spatial Changes of Vegetation in Linzhi Area Based on MODIS-NDVI.” Geography and Geo-Information Science 26 (5): 58–62.
- Zhu, Zaichun, Shilong Piao, Ranga B. Myneni, Mengtian Huang, Zhenzhong Zeng, Josep G. Canadell, Philippe Ciais, et al. 2016. “Greening of the Earth and its Drivers.” Nature Climate Change 6 (8): 791–795. doi:10.1038/nclimate3004 doi: 10.1038/nclimate3004