
 ?Mathematical formulae have been encoded as MathML and are displayed in this HTML version using MathJax in order to improve their display. Uncheck the box to turn MathJax off. This feature requires Javascript. Click on a formula to zoom.
ABSTRACT
Surface radiative fluxes over landfast sea ice off Zhongshan station have been measured in austral spring for five springs between 2010 and 2015. Downward and upward solar radiation vary diurnally with maximum amplitudes of 473 and 290 W m−2, respectively. The maximum and minimum long-wave radiation values of the mean diurnal cycle are 218 and 210 W m−2 for downward radiation, 277 and 259 W m−2 for upward radiation and 125 and −52 W m−2 for net radiation. The albedo has a U-shaped mean diurnal cycle with a minimum of 0.64 at noon. Sea ice thickness is in the growth phase for most spring days, but can be disturbed by synoptic processes. The surface temperature largely determines the occurrence of ice melting. Surface downward and upward long-wave radiation show synoptic oscillations with a 5–8 day period and intraseasonal variability with a 12–45 day period. The amplitudes of the diurnal, synoptic and intraseasonal variability show some differences during the five austral springs considered here. The intraseasonal and synoptic variability of downward and upward long-wave radiation are associated with the variability of cloud cover and surface temperature induced by the atmospheric circulation.
1. Introduction
A prominent increase in the Antarctic surface temperature has been observed in recent decades (Turner et al. Citation2005; Mayewski et al. Citation2009; Steig et al. Citation2009). The Antarctic atmosphere can strongly influence the surface net radiation flux, which in turn leads to changes in surface temperature. Previous studies have suggested that the model bias in Antarctic surface temperature results mainly from a problem in the surface energy budget (Bodas-Salcedo et al. Citation2012; Schneider and Reusch Citation2015). Hence, investigating the surface radiation flux and its changes is vital for understanding Antarctic and even global climate change, and improving the simulation of Antarctic weather and climate.
The World Meteorological Organization/International Council of Scientific Unions (WMO/ICSU) Joint Scientific Committee for the World Climate Research Programme (WCRP) chose three stations (Neumayer, Syowa and South Pole) to be part of the Baseline Surface Radiation Network (BSRN) and provide Antarctic surface irradiances (Ohmura et al. Citation1998). Previous researchers have investigated the surface radiation fluxes over above three stations (Town, Walden, and Warren Citation2005; Yamanouchi and Shudou Citation2007; Kratz et al. Citation2009; Van den Broeke et al. Citation2009; Munneke et al. Citation2011). To remedy the poor spatial and temporal coverage in Antarctica, automatic weather stations (AWS) have also been used to observe the surface energy fluxes. Van den Broeke, Reijmer, and van de Wal (Citation2004, Citation2005, Citation2006) utilized four AWSs in western Dronning Maud Land (DML), East Antarctica, to explore the surface radiation balance and its diurnal and seasonal cycles. Välisouo, Vihma, and King (Citation2014) analyzed the interannual variability in surface radiative fluxes from AWSs over the Larson and Wilkins Ice Shelves on the Antarctic Peninsula from 1989 to 2010. The radiative surface energy fluxes from an AWS on Larsen C Ice Shelf were also used to analyze the surface energy budget which led to invalidating summertime flux estimates from three atmospheric models (Munneke et al. Citation2012; King et al. Citation2015).
Although several previous studies investigated the variability of surface radiation fluxes over the Antarctic land surface, very limited observations have been obtained over the Antarctic sea ice, insufficient to cover the interannual variability (e.g. Allison, Brandt, and Warren Citation1993; Brandt et al. Citation2005; Vihma, Johansson, and Launiainen Citation2009; Weiss et al. Citation2012; Yang et al. Citation2016a). To improve our understanding of radiation variation over Antarctic sea ice, we carried out routine radiation measurements at a fixed landfast sea ice site near Zhongshan Station in Prydz Bay since 2010 (Yang et al. Citation2016a). To the authors’ knowledge, this is the first observational study of the variability of Antarctic sea ice surface radiation fluxes over five springs.
In this paper we present the variability of springtime surface radiative fluxes (upward and downward short-wave and long-wave radiation) on timescales ranging from diurnal to interannual at a landfast sea ice site near the Antarctic Zhongshan station for five springs between 2010 and 2015 (2014 is missing), and analyze differences in these variabilities.
2. Measurements and methods
The surface radiation balance can be written as(1)
(1) where SW↓ and SW↑ are incoming and reflected short-wave radiation fluxes, and LW↓ + LW↑ are incoming and emitted long-wave radiation fluxes. Fluxes toward the surface are defined as positive. The four flux components were measured over a landfast sea ice site near Zhongshan Station (69°22′24″S, 76°22′40″E) using a Kipp and Zonen CNR4 net radiometer (Yang et al. Citation2016a) from late August to early December. In this study we analyze the data from 1 September to 30 November for the five analyzed years. The short-wave and long-wave radiations were measured with a CNR4 sensor mounted 1.5 m above the surface on a 3-m high tripod. The CNR4 sensor houses a paired pyranometer (short-wave spectral range 310–2800 nm) and pyrgeometer (infrared 4.5–42 µm) that faces upward and a complementary pair that faces downward.
The recording interval of the flux data was one minute which was then averaged over a 30-min period. The radiation sensors were checked around 1300 LST (local time) every day. The sensors were seldom covered by snow and/or frost flower during the observation periods. The horizontal level of the sensors was also checked and adjusted, since surface melt on the sensors can cause tilting. The uncertainty of the radiation measurements is ±5%. As the albedo measurements are not reliable for large solar zenith angles (Vihma, Johansson, and Launiainen Citation2009), the albedo was calculated based on the SW↑ and SW↓ ratio for zenith angles of less than 80°, consistent with Pirazzini (Citation2004) and Järvinen and Leppäranta (Citation2013). Sea ice thickness used in this study was measured with an ice auger every seven days with an accuracy of ±0.5 cm at all three sites, and then averaged. Snow thickness was measured almost every day using a ruler with an accuracy of ±0.2 cm near the the downward-facing pyranometer. The snow/bare ice surface temperature was calculated from the downward/upward long-wave fluxes using a fixed emissivity according to Pirazzini et al. (Citation2006).
The surface air temperature, dew point temperature, total cloud cover and pressure observed at the Zhongshan meteorology station are also used. In addition surface radiation flux data and other atmospheric variables from the National Centers for Environmental Prediction (NCEP) Department of Energy (DOE) (Kanamitsu et al. Citation2002) are used to explore variability of surface radiation and the impact of large-scale circulations on the surface radiation.
Wavelet analysis and Empirical mode decomposition (EMD) (Huang et al. Citation1998, Citation1999) were used to investigate the main periodicities of short-wave and long-wave radiation at Zhongshan station and extract the time series of the periodicity, EMD is an efficient tool to extract wave signals with different periodicities from nonlinear and non-stationary time series. These wave signals are defined as intrinsic mode functions (IMFs) characterized by a slowly varying wave-package. The first IMF displays the highest frequency oscillation and higher order IMFs are at lower frequencies. The last IMF usually indicates the trend of the time series. A detailed description of EMD is given by Huang and Wu (Citation2008). In this study we applied EMD and wavelet analysis to 30-min sample rate time series of short- and long-wave radiation and extracted the time series of mainly the diurnal, synoptic (2–10 days) and intraseasonal (10–70 days) periods, as well as the trends, and compared the variations of these signals over five years. We also explore the reasons for the periods of these radiation fluxes in terms of the atmospheric circulation. Before the EMD analysis, two-dimensional global spectra of radiation fluxes were constructed using wavelet analysis to obtain the main periodicities of these fluxes.
3. Results and discussions
3.1. Monthly values of radiation fluxes
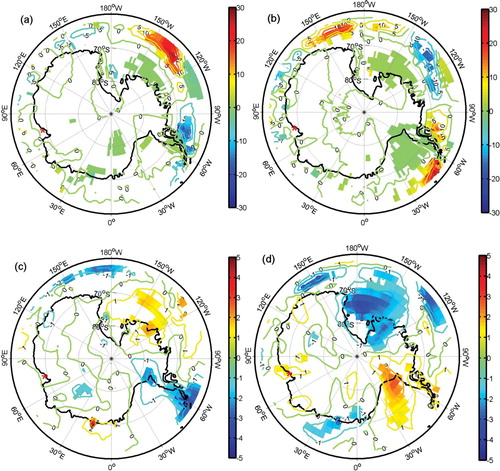
The five-year averaged values of the springtime fluxes are 182 W m−2 for downward short-wave radiation, 113 W m−2 for upward short-wave radiation, 214 W m−2 for downward long-wave radiation, and 266 W m−2 for upward long-wave radiation. Overall, the surface gains 69 W m−2 from short-wave radiation, but emits 52 W m−2 of long-wave radiation. Thus, without considering the sensible and latent heat fluxes, and subsurface conductive heat flux, only 17 W m−2 is used to heat the surface. Short-wave and net radiation show a markedly increasing trend from September to November. Long-wave radiation displays smaller upward and larger downward components in September than other spring months, resulting from more cloud cover and colder surface temperature in September. These surface radiation fluxes also vary interannually, as shown in for the three months of austral spring. In contrast to net long-wave radiation, net short-wave and net radiation demonstrate larger interannual variability, particularly in October and November. Thus the variability of net short-wave radiation determines that of net radiation. The maxima in short-wave and net radiation occur in 2011 with the exception of net radiation in September when a maximum occurs in 2015. The minima in net short-wave and net radiation fluxes occur in 2010 with the exception of September net radiation in 2012 and November net short-wave radiation in 2015. The years 2015 and 2010 had a strong El Niño and La Niña, respectively. The extreme values of surface short-wave and net radiation do not correspond to El Nino Southern Oscillation (ENSO) years. ENSO does not exert a significant effect on monthly surface short-wave and net radiation fluxes nor does the Antarctic Oscillation (AAO). The relationship between long-wave radiation and AAO is also not significant, although Smith, Previdi, and Polvani (Citation2013) found a significant correlation between wintertime surface long-wave radiation and AAO. The above-mentioned relationships are investigated further using longer time series of surface radiation data derived from NCEP-DOE. The regression maps of surface short and long-wave radiation on the austral spring Niño3.4 (Trenberth Citation1997) and AAO indices are shown in . The significant impact regions occur mainly over West Antarctica, with almost no effect at the observation site.
Figure 1. The variability of short-wave (red line), long-wave (blue line) and net (black line) radiation fluxes for September (a), October (b) and November (c).
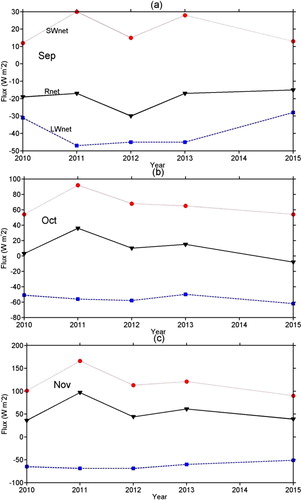
Figure 2. The short-wave (a), (b) and long-wave (c), (d) radiation fluxes anomalies regressed on the austral spring Niño 3.4 (a), (c) and AAO (b), (d) indices. The filled regions are significant at the 95% confidence level. The red asterisk indicates the location of the radiation observation site.
3.2. Five-year averages of radiation fluxes
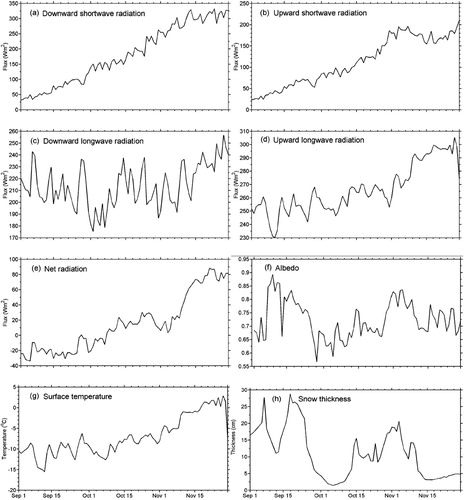
The time series of five-year averaged variables are presented in . With the increase in solar elevation angle, the short-wave, net and upward long-wave radiation increase. For downward short-wave radiation the value increases from 31 W m−2 on 1 September to 300 W m−2 on 11 November and thereafter oscillates around 310 W m−2. Upward short-wave radiation increases from 23 W m−2 on 1 September to 186 W m−2 on 1 November and hereafter remain steady with an average of around 178 W m−2. Downward long-wave radiation ranges from 175 to 257 W m−2, which is related to synoptic and sub-seasonal processes. Upward long-wave radiation, which is correlated with surface temperature, has a maximum (minimum) value of 300 (230) W m−2. Net radiation becomes positive after 8 October, increases abruptly in early November and thereafter remains steady due to the downward short-wave radiation. Snow thickness of less than 30 cm at the site influences the albedo ranging from 0.55 to 0.9.
Figure 3. The five-year averaged time series of downward short-wave (a), upward short-wave (b), downward long-wave (c), upward long-wave (d), net (e) radiation fluxes, (f) albedo, (g) surface temperature and (h) snow thickness in austral spring.
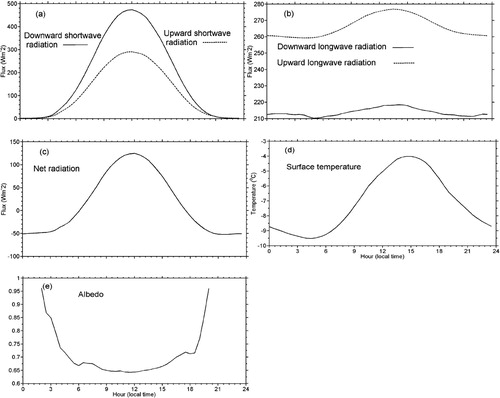
For each variable, 30-min values for five springs are averaged to obtain the climatological diurnal cycle. The mean diurnal cycles of various quantities are presented in . Both incoming and reflected solar radiation have an obvious cycle with maximum values of 473 and 290 W m−2, respectively. The upward long-wave radiation has a sinusoidal diurnal cycle with a maximum (minimum) value of 277 (259) W m−2 as a result of the diurnally varying surface temperature. The diurnal cycle of the downward long-wave radiation, with a maximum (minimum) value of 218 (210) W m−2, is slightly perturbed by the cloud cover as a response to synoptic processes. At night the snowpack releases a maximum of 52 W m−2; at noon it absorbs a maximum of 125 W m−2. A diurnal cycle in albedo also is apparent. The albedo decreases abruptly when the surface melts, to a minimum value of 0.64 at noon. The diurnal cycle of albedo is U-shaped, which suggests a dependence on solar zenith angle.
Figure 4. The five-year averaged diurnal cycles of downward/upward short-wave (a), downward/upward long-wave (b), net (c) radiation fluxes, (d) surface temperature and (e) albedo in austral spring.
3.3. Sea ice thickness change in austral spring
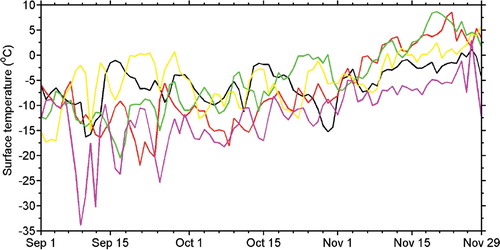
We calculated sea ice variability and change rate for five springs. The sea ice change rate is obtained from the difference in sea ice thickness for two successive days. The landfast sea ice thickness during spring is still in the growth phase (Lei et al. Citation2010; Yang et al. Citation2016a), but the growth rate is decreasing, particularly in late spring (). But in 2015 the sea ice change rate greatly increased in late spring to 20 mm per day, which may be associated with colder surface temperature than other years (). The ice thickness shows an increasing trend in spring. The seasonal mean growth rate of ice thickness in five springs shows some differences. The largest growth rate of 4.5 mm d−1 occurs in 2010, followed by 3.4 mm d−1 in 2015. The smallest growth rate is 1.6 mm d−1 in 2011. For a surface temperature of >0°C in early to late November of 2011 and 2012, the growth rate of ice thickness is slightly negative. In other years a surface temperature of <0°C retards the ice melt. The ocean heat flux also can melt sea ice from the bottom boundary (Lei et al. Citation2010; Yang et al. Citation2016b), which may be the reason for the decreased sea ice thickness in late November of 2010.
Figure 5. The sea ice thickness (a) and its average growth rate (b) in five austral springs: 2010 (black), 2011 (red), 2012 (green), 2013 (yellow) and 2015 (magenta).
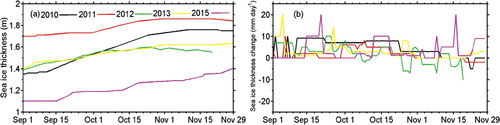
Figure 6. The surface temperature change for five austral springs: 2010 (black), 2011 (red), 2012 (green), 2013 (yellow) and 2015 (magenta).
3.4. Periodicities
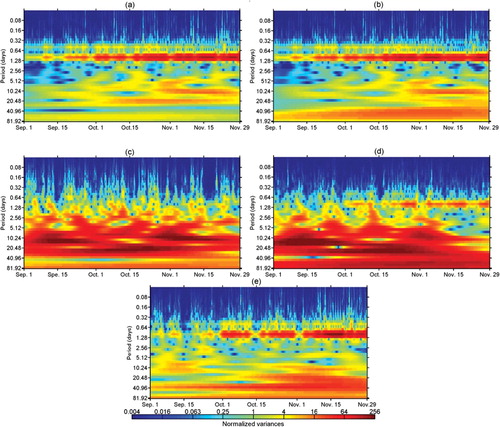
The two-dimension wavelet spectra for springtime surface radiation fluxes in 2010 are shown in . Surface short-wave and net radiation display a diurnal cycle. Upward long-wave radiation also shows a one-day period, but its amplitude is considerably weaker than that of short-wave radiation. The diurnal cycle of downward long-wave radiation is not noticeable mainly because the randomness of cloud cover related to synoptic-scale variability can disrupt the diurnal cycle of the downward long-wave radiation (Vihma, Johansson, and Launiainen Citation2009). The amplitude of the diurnal cycle has a markedly increasing trend in austral spring. In addition, long-wave upward and downward radiation show periods of synoptic and intraseasonal variation. The surface radiation fluxes in other years display a similar wavelet spectrum. Detailed analyses of these periods and their difference over five austral springs are given below.
Figure 7. Wavelet spectra for the downward short-wave (a), upward short-wave (b), downward long-wave (c), upward long-wave (d), and net (e) radiation fluxes from 1 September to 29 November 2010.
3.4.1. The diurnal cycle
The fourth IMFs for the time series of short-wave, upward long-wave and net radiation display a diurnal signal. shows the fourth IMF of the downward short-wave radiation for five austral springs. As shown in their two-dimensional wavelet spectra () the amplitude of the diurnal cycle shows a markedly increasing trend in austral spring. The increasing trend is usually intercepted by a lower-frequency oscillation which is discussed in a subsequent section. The amplitude of downward short-wave radiation increases from less than 100 W m−2 in September to more than 800 W m−2 in November, with year-to-year variations. The largest value of 8.98 W m−2 yr−1 occurs in 2010, while the smallest value of 5.39 W m−2 yr−1 occurs in 2015 (). In addition to the trend, the time series of the diurnal amplitudes show synoptic periodicities. Among the five years, the periodicities of the diurnal amplitudes are 6–7 days for 2010, 2012 and 2015 and 3–4 days for 2011 and 2013. The diurnal cycle of downward short-wave radiation shows noontime maxima from 140.1 W m−2 in 2015 to 222.2 W m−2 in 2010 and midnight minima from −211.0 W m−2 in 2010 to −132.9 W m−2 in 2015 as a consequence of cloud cover over the observation site. The largest springtime amplitude of the diurnal cycle occurs in 2010, while the smallest occurs in 2015. The extreme value of the diurnal cycle amplitude reflects the increasing trend in the amplitude. Although the extreme years of the diurnal cycle appear to occur during ENSO years, the relationship may be insignificant over a longer period.
Figure 8. The fourth IMF of the time series of downward short-wave radiation for five springs.
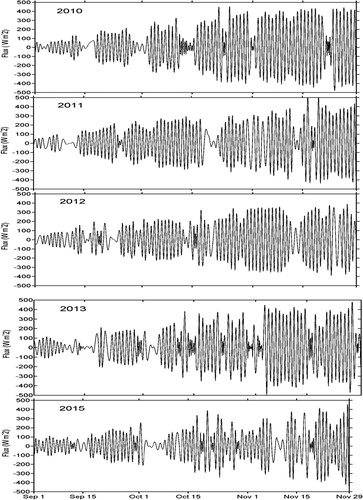
Table 1. Springtime changes in the amplitude of daily cycles of surface radiation fluxes for five years (units: W m−2 day−1).
Similar analyses are applied to upward short-wave and long-wave, and net radiation. Like downward short-wave radiation, the IMFs of the three radiation fluxes also shows a prominent increasing daily cycle accompanying the season transition, although the upward long-wave radiation diurnal cycle shows a weaker daily oscillation in late November than the rest of the austral spring (not shown). The diurnal oscillation of the upward short-wave and long-wave, and net radiation also is modulated by synoptic processes, with periods of 3–5 and 7 days. The intraseasonal oscillation of 10–14 days also influences the diurnal cycle. In 2010 the synoptic and intraseasonal variability do not significantly affect the diurnal cycle. The amplitudes of the seasonal cycle show an increasing trend, with the exception of upward long-wave radiation in 2012 (). The extreme values of the trends vary in different years for different radiation fluxes, indicating that several atmospheric processes and factors modulate the diurnal cycle of the surface radiation.
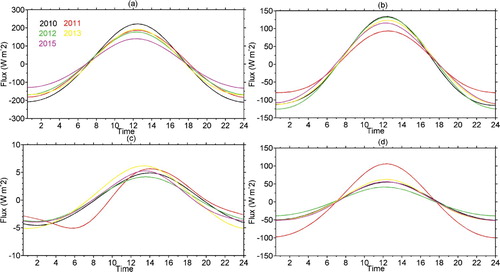
The daily cycles of the short-wave, upward long-wave and net radiation are shown in . The short-wave and net radiation show a symmetric and sinusoidal shape with the largest values at noon and the smallest at midnight, which are attributable to the zenith angle. The upward long-wave radiation also has a sinusoidal cycle but with an asymmetric feature, especially in 2011, due to the cycle in the surface temperature. Like short-wave radiation, the smallest values occur at midnight except for 2011, but the largest values occur between 13:00 and 15:00. The daily cycle of the upward short-wave radiation in 2011 is smallest, while the largest daily oscillation occurs in 2012 (). The diurnal variability of upward long-wave radiation is much smaller than the other radiation fluxes. The extreme values of the diurnal net radiation amplitude are opposite to those of upward short-wave radiation.
Figure 9. The EMD averaged diurnal cycle of the downward short-wave (a), upward short-wave (b), upward long-wave (c) and net (d) radiation in austral spring.
3.4.2. Synoptic processes (2–10 days)
The downward long-wave radiation in 2011, 2012, 2013 and 2015 exhibits a periodicity of 6–8 days; in contrast, no significant synoptic periodicity occurs in 2010. A significant synoptic oscillation with a 5–8 day periodicity only occurs in the time series of upward long-wave radiation in 2012, 2013 and 2015. The synoptic components of IMFs for upward and downward long-wave radiation are located between the sixth and ninth IMFs and between the fifth and seventh IMFs, respectively. These IMFs with synoptic periodicities are added to generate the time series of their synoptic variabilities. The time series of the synoptic components of downward long-wave radiation are shown in . There is considerable month-to-month variability; for example, larger synoptic oscillations occur during late September and October than the rest of the spring in 2012. In contrast, the synoptic processes in 2015 show no intraseasonal variability. The synoptic processes also show a year-to-year difference. The mean standard variances of the synoptic variations are shown in . The variances in 2010 and 2012 are much smaller than those in other years. The variances of the upward long-wave radiation are less than half those of the downward long-wave radiation (not shown). The synoptic variability of upward long-wave radiation in 2015 is much greater than that in the other four austral springs. The synoptic variability of long-wave radiation is related to that of cloud cover, which is induced by the passage of polar cyclones. Below a simple case study is presented to further illustrate the impact of a synoptic process on the downward long-wave radiation at the observation site.
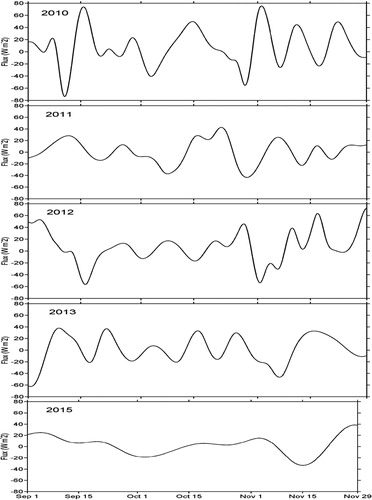
Figure 10. The time series of downward long-wave radiation on the synoptic time scale for five austral springs.
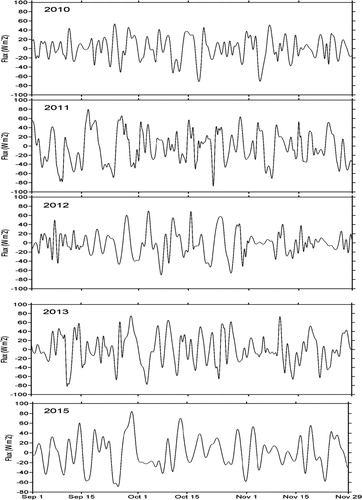
Table 2. Mean standard variances of downward and upward long-wave radiation on the synoptic and intraseasonal time scales (units: W m−2).
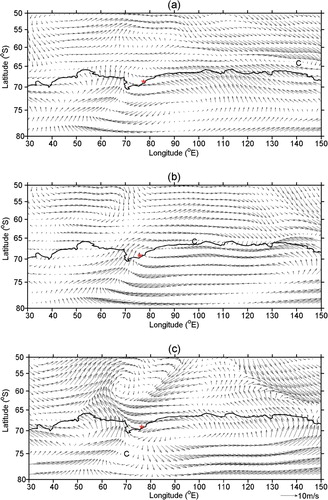
In late September 2015, a polar cyclone passed through the observation site. During the passage atmospheric variables including long-wave radiation exhibit a synoptic-scale oscillation (). On September 22 a polar cyclone can be seen over the western Ross Sea when easterly winds prevail at the observation site ((a)). Accompanying the westward movement of the cyclone the winds over observation site shift to southerly ((b)). Meanwhile, the surface air temperature, dew point temperature and pressure decrease, which leads to decreased upward long-wave radiation. There is a reduced or even no cloud cover over the observation site, which is consistent with decreased downward long-wave radiation. While the cyclone moves to the southwest of Prydz Bay ((c)), warmer northeasterly winds over the observation site increase surface air temperature, humidity and cloud cover, thus leading to enhanced upward and downward long-wave radiation.
Figure 11. Observed time series of atmospheric variables at Zhongshan station from 22 September to 29 September 2015.
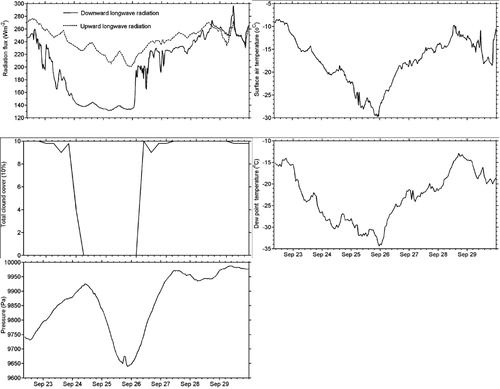
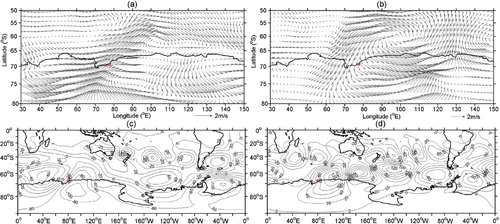
Figure 12. Surface wind field over east Antarctic on 22 September 2015 (a), 25 September 2015 (b) and 27 September 2015 (c). ‘C’ indicates a polar cyclone. The red asterisk indicates the observation site.
3.4.3. The intraseasonal oscillation (10–70 days)
Similarly, the time series of downward long-wave radiation over the intraseasonal time scale are extracted in . The main periods of downward long-wave radiation are 12–22, 31 and 37–45 days with year-to-year differences. The 17–45 day period occurs only in 2012, 2013 and 2015, while the 12–22 day period occurs in 2010 and 2011. A similar time series of upward long-wave radiation also was generated (not shown). Like synoptic oscillations, the amplitude of upward long-wave radiation is much smaller than that of downward long-wave radiation. The variances of long-wave radiation on the intraseasonal time scale show a year-to-year difference (). The largest variances occur in 2010; the smallest in 2015. The intraseasonal oscillation has been attributed to AAO and the Pacific South America (PSA) pattern (Yu et al. Citation2011; Rimbu et al. Citation2014). PSA is associated with tropical Pacific convection and the Madden Julian Oscillation (MJO) (Mo and Higgins Citation1998). Carvalho, Jones, and Ambrizzi (Citation2005) suggested that suppressed (increased) MJO activity occurs during the El Nino (La Nina) years; thus, El Nino (La Nina) can increase (decrease) the variance of long-wave radiation on the intraseasonal time scale.
Figure 13. The time series of downward long-wave radiation on the intraseasonal time scale for five austral springs.
Similarly another case study is chosen to exhibit an intraseasonal oscillation of long-wave radiation and related atmospheric variables. A prominent intraseasonal oscillation of about 30 days occurred in the time series of long-wave radiation as well as atmospheric variables for the period of 27 October to 30 November 2013 ( and ). Higher surface air temperature is associated with stronger upward long-wave radiation; more cloud cover occurs during periods of increased downward long-wave radiation. The reverse occurs for lower surface temperature and less cloud cover. From the perspective of the surface wind field, dry and cold southwesterly winds tend to decrease the surface temperature and cloud cover, which results in the reduced upward and downward long-wave radiation and vice versa ((a) and (b)). (c) and (d) display anomalous 500-hPa geopotential heights in the southern Hemisphere during the two intraseasonal phases. Two remarkable wave trains occur over the subtropical and mid-latitude regions, both emanating from the Indonesian Archipelago (Yu et al. Citation2011). The mid-latitude wave train propagates eastwards with an anomalous height and surface wind field passing over the site, which leads to the intraseasonal oscillation of surface temperature, cloud cover and long-wave radiation ( and ).
Figure 14. Time series of 10–90 day filtered atmospheric variables at Zhongshan station for 27 October to 30 November 2013. The seasonal cycle is removed.
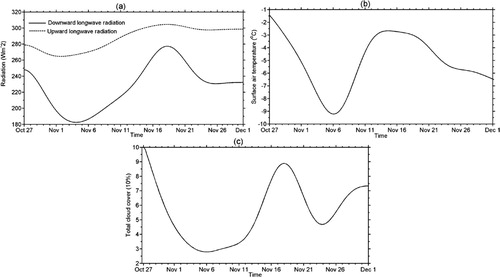
Figure 15. 10–90 day filtered mean surface wind field (a), (b) and 500-hPa geopotential height (c), (d) in east Antarctic for 1 to 8 November (a), (c) and 15 to 21 November 2013 (b), (d).
3.5. Discussion
This initial study on the variability of Antarctic sea ice surface radiation fluxes, has only five springs of surface radiation data which limits the significance of our results on the interannual time scale. The effect of ENSO and AAO on the daily cycle, synoptic processes and intraseasonal variability of surface radiation fluxes over Antarctic sea ice all need to be further investigated using longer datasets. The reanalysis data is a good choice to resolve the issue, though it may not always agree with the observations (Välisouo, Vihma, and King Citation2014; King et al. Citation2015). Future work should focus on the variability of surface radiation fluxes over the whole Antarctic ice sheet and sea ice, and their relationships with large-scale climate factors using high-resolution reanalysis data.
4. Conclusions
We analyzed surface radiation fluxes (downward and upward long-wave and short-wave and net radiations) at a landfast sea ice site near Zhongshan station during the austral spring for five springs between 2010 and 2015 using wavelet and EMD methods. The mean values are 182 W m−2 for downward short-wave radiation, 113 W m−2 for upward short-wave radiation, 214 W m−2 for downward long-wave radiation and 266 W m−2 for upward long-wave radiation. Short-wave, upward long-wave and net radiation increase gradually and remain steady in early November, while downward long-wave radiation decreases until 1 October and then increases gradually. The year-to-year variability of net short-wave radiation is similar to that of net radiation. The monthly net short-wave, net long-wave and net radiation show no significant relationship with AAO and ENSO.
During most of spring the sea ice is in a growth phase. The increasing surface temperature related to cyclone activities can disturb the growth. The growth rate of sea ice thickness differs in different years with the largest (smallest) value in 2010 (2011). Surface temperature of above 0°C in early November of 2011 and 2012 results ice melt. In 2010 the ocean heat flux may play a more important role in spring ice melting. The specific effect of these factors need to be further explored by using sea ice models.
A strong diurnal cycle of noontime maxima and midnight minima occurs in the short-wave, upward long-wave and net radiation. The daily cycle of upward long-wave radiation is much smaller than those of the other three radiation fluxes. The amplitude of most of the diurnal cycles of these radiation fluxes shows an increasing trend, though the increasing trend is often interrupted by synoptic processes and intraseasonal oscillations. The diurnal cycle of the radiation fluxes also varies over the five springs. In addition, surface temperature and albedo also show an apparent cycle. The diurnal cycle of albedo is a nearly symmetric U shape. With increasing surface temperature, albedo decreases rapidly to 0.64.
In addition the long-wave radiation shows a synoptic 5–8 day period oscillation and intraseasonal variability with a 12–45 day period. The synoptic and intraseasonal periods vary over the five years. The synoptic and intraseasonal variabilities of upward long-wave radiation are smaller than those of downward long-wave radiation. The synoptic and intraseasonal variabilities also show differences among the five springs. The synoptic oscillations of upward and download long-wave radiation are associated with the variability of surface temperature and cloud cover induced by polar cyclones. The intraseasonal variability of long-wave radiation may be associated with atmosphere circulation induced by the mid-latitude wave train.
Acknowledgements
We thank the Chinese Arctic and Antarctic Administration and Polar Research Institute of China for the logistic support.
Disclosure statement
No potential conflict of interest was reported by the authors.
Additional information
Funding
References
- Allison, I., R. E. Brandt, and S. G. Warren. 1993. “East Antarctic Sea Ice: Albedo, Thickness Distribution, and Snow Cover.” Journal of Geophysical Research 98 (C7): 12417–12429. doi: 10.1029/93JC00648
- Bodas-Salcedo, A., K. D. Williams, P. R. Field, and A. P. Lock. 2012. “The Surface Downwelling Solar Radiation Surplus Over the Southern Ocean in the Met Office Model: The Role of Mid-latitude Cyclone Clouds.” Journal of Climate 25: 7467–7486. doi: 10.1175/JCLI-D-11-00702.1
- Brandt, R. E., S. G. Warren, A. P. Worby, and T. C. Grenfell. 2005. “Surface Albedo of the Antarctic Sea Ice Zone.” Journal of Climate 18 (17): 3606–3622. doi: 10.1175/JCLI3489.1
- Carvalho, L. M. V., C. Jones, and T. Ambrizzi. 2005. “Opposite Phases of the Antarctic Oscillation and Relationships with Intraseasonal to Interannual Activity in the Tropics During the Austral Summer.” Journal of Climate 18: 702–718. doi: 10.1175/JCLI-3284.1
- Huang, N. E., Z. Shen, and S. R. Long. 1999. “A New View of Nonlinear Water Waves: The Hilbert Spectrum, Ann.” Annual Review of Fluid Mechanics 31: 417–457. doi: 10.1146/annurev.fluid.31.1.417
- Huang, N. E., Z. Shen, S. R. Long, M. C. Wu, H. H. Shih, Q. Zheng, N.-C. Yen, C. C. Tung, and H. H. Liu. 1998. “The Empirical Mode Decomposition and the Hilbert Spectrum for Nonlinear and Non-stationary Time Series Analysis.” Proceedings of the Royal Society A: Mathematical, Physical and Engineering Sciences 454: 903–995. doi: 10.1098/rspa.1998.0193
- Huang, N. E., and Z. Wu. 2008. “A Review on Hilbert-Huang Transform: Method and its Applications to Geophysical Studies.” Reviews of Geophysics 46: RG2006. doi: 10.1029/2007RG000228.
- Järvinen, O., and M. Leppäranta. 2013. “Solar Radiation Transfer in the Surface Snow Layer in Dronning Maud Land, Antarctica.” Polar Science 7: 1–17. doi: 10.1016/j.polar.2013.03.002
- Kanamitsu, M., W. Ebisuzaki, J. Woollen, S.-K. Yang, J. J. Hnilo, M. Fiorino, and G. L. Potter. 2002. “NCEP/DOE AMIP-II Reanalysis (R-2).” Quarterly Journal of the Royal Meteorological Society 83: 1631–1643. doi: 10.1175/BAMS-83-11-1631
- King, J. C., A. Gadian, A. Kirchgaessner, P. K. Munneke, T. A. Lachlan-Cope, A. Orr, C. Reijimer, M. R. van den Broeke, J. M. van Wessem, and M. Weeks. 2015. “Validation of the Summertime Surface Energy Budget of Larsen C Ice Shelf (Antarctica) as Represented in Three High-resolution Atmospheric Models.” Journal of Geophysical Research 120: 1335–1347.
- Kratz, D. P., S. K. Gupta, A. C. Wilber, and V. E. Sothcott. 2009. “Validation of the CERES Edition 2B Surface-Only Flux Algorithms.” Journal of Applied Meteorology and Climatology 49: 164–180. doi: 10.1175/2009JAMC2246.1
- Lei, R., Z. Li, B. Cheng, Z. Zhang, and P. Heil. 2011. “Annual Cycle of Landfast Sea Ice in Prydz Bay, East Antarctica.” Journal of Geophysical Research 115: C02006. doi:10.1029/2008JC005223.
- Mayewski, P. A., M. P. Meredith, C. P. Summerhayes, J. Turener, A. Worby, P. J. Barrett, G. Casassa, et al. 2009. “State of the Antarctic and Southern Ocean Climate System.” Reviews of Geophysics 47: RG1003. doi: 10.1029/2007RG000231.
- Mo, K. C., and R. W. Higgins. 1998. “The Pacific–South American Modes and Tropical Convection During the Southern Hemisphere Winter.” Monthly Weather Review 126: 1581–1596. doi: 10.1175/1520-0493(1998)126<1581:TPSAMA>2.0.CO;2
- Munneke, P. K., M. R. van den Broeke, J. C. King, T. Gray, and CH, Reijmer. 2012. “Near-surface Climate and Surface Energy Budget of Larsen C ice Shelf, Antarctic Peninsula.” The Cryosphere 6: 353–363. doi: 10.5194/tc-6-353-2012
- Munneke, P. K., M. R. van den Broeke, J. T. M. Lenaerts, M. G. Flanner, A. S. Gardner, and W. J. van de Berg. 2011. “A New Albedo Parameterization for Use in Climate Models Over the Antarctic Ice Sheet.” Journal of Geophysical Research 116: D05114. doi:10.1029/2010JD015113.
- Ohmura, A., E. G. Dutton, B. Forgan, C. Fröhlich, H. Gilgen, H. Hegner, A. Heimo, et al. 1998. “Baseline Surface Radiation Network (BSRN/WCRP): New Precision Radiometry for Climate Research.” Bulletin of the American Meteorological Society 79: 2115–2136. doi: 10.1175/1520-0477(1998)079<2115:BSRNBW>2.0.CO;2
- Pirazzini, R. 2004. “Surface Albedo Measurements Over Antarctic Sites in Summer.” Journal of Geophysical Research 109 (D20), doi:10.1029/2004JD004617.
- Pirazzini, R., T. Vihma, M. A. Granskog, and B. Cheng. 2006. “Surface Albedo Measurements Over Sea Ice in the Baltic Sea During the Spring Snowmelt Period.” Annals of Glaciology 44: 7–14. doi: 10.3189/172756406781811565
- Rimbu, N., G. Lohmann, G. König-Langlo, C. Necula, and M. Ionita. 2014. “Daily to Intraseasonal Oscillations at Antarctic Research Station Neumayer.” Antarctic Science 26: 193–204. doi: 10.1017/S0954102013000540
- Schneider, D. P., and D. B. Reusch. 2015. “Antarctic and Southern Ocean Surface Temperatures in CMIP5 Models in the Context of the Surface Energy Budget.” Journal of Climate 29: 1689–1716. doi: 10.1175/JCLI-D-15-0429.1
- Smith, K., L. M. Previdi, and L. M. Polvani. 2013. “The Antarctic Atmospheric Energy Budget. Part II: The Effect of Ozone Depletion and Its Projected Recovery.” Journal of Climate 26: 9729–9744. doi: 10.1175/JCLI-D-13-00173.1
- Steig, E. J., D. P. Schneider, S. D. Rutherford, M. E. Mann, J. C. Comiso, and D. T. Shindell. 2009. “Warming of the Antarctic Ice-Sheet Surface Since the 1957 International Geophysical Year.” Nature 457: 459–462. doi: 10.1038/nature07669
- Town, M. S., V. P. Walden, and S. G. Warren. 2005. “Spectral and Broadband Long-Wave Downwelling Radiative Fluxes, Cloud Radiative Forcing, and Fractional Cloud Cover Over the South Pole.” Journal of Climate 18: 4235–4252. doi: 10.1175/JCLI3525.1
- Trenberth, K. E. 1997. “The Definition of El Niño.” Bulletin of the American Meteorological Society 78: 2771–2777. doi: 10.1175/1520-0477(1997)078<2771:TDOENO>2.0.CO;2
- Turner, J., S. R. Colwell, G. J. Marshall, T. A. Lachlan-Cope, A. M. Carleton, P. D. Jones, V. Lagun, P. A. Reid, and S. Lagovkina. 2005. “Antarctic Climate Change During the Last 50 Years.” International Journal of Climatology 25: 279–294. doi: 10.1002/joc.1130
- Välisouo, I., T. Vihma, and J. C. King. 2014. “Surface Energy Budget on Larsen and Wilkins Ice Shelves in the Antarctic Peninsula: Results Based on Reanalyses in 1989–2010.” The Cryosphere 8: 1519–1538. doi: 10.5194/tc-8-1519-2014
- Van den Broeke, M., G. König-Langlo, G. Plcard, P. K. Munneke, and J. Lenaerts. 2009. “Surface Energy Balance, Melt and Sublimation at Neumayer Station, East Antarctica.” Antarctic Science 21. doi:10.1017/S0954102009990538.
- Van den Broeke, M., C. Reijmer, D. van As, and W. Boot. 2006. “Daily Cycle of the Surface Energy Balance in Antarctica and the Influence of Clouds.” International Journal of Climatology 26: 1587–1605. doi: 10.1002/joc.1323
- Van den Broeke, M., C. Reijmer, D. van As, R. van de Wal., and J. Oerlemans. 2005. “Seasonal Cycles of Antarctic Surface Energy Balance from Automatic Weather Stations.” Annals of Glaciology 41: 131–139. doi: 10.3189/172756405781813168
- Van den Broeke, M., C. Reijmer, and R. van de Wal. 2004. “Surface Radiation Balance in Antarctica as Measured with Automatic Weather Stations.” Journal of Geophysical Research 109: D09103. doi: 10.1029/2003JD004394.
- Vihma, T., M. M. Johansson, and J. Launiainen. 2009. “Radiative and Turbulent Surface Heat Fluxes Over Sea Ice in the Western Weddell Sea in Early Summer.” Journal of Geophysical Research 114 (C4). doi: 10.1029/2008JC004995.
- Weiss, A. I., J. C. King, T. A. Lachlan-Cope, and R. S. Ladkin. 2012. “Albedo of the Ice Covered Weddell and Bellingshausen Seas.” The Cryosphere 6: 479–491. doi: 10.5194/tc-6-479-2012
- Yamanouchi, T., and Y. Shudou. 2007. “Trends in Cloud Amount and Radiative Fluxes at Syowa Station, Antarctica.” Polar Science 1: 17–23. doi: 10.1016/j.polar.2007.04.001
- Yang, Q., J. Liu, M. Leppäranta, Q. Sun, R. Li, L. Zhang, T. Jung, et al. 2016a. “Albedo of Coastal Landfast Sea Ice in Prydz Bay, Antarctica: Observations and Parameterization.” Advances in Atmospheric Sciences 33 (5): 535–543. doi: 10.1007/s00376-015-5114-7
- Yang, Y., L. Zhijun, M. Leppäranta, B. Cheng, L. Shi, and R. Lei. 2016b. “Modelling the Thickness of Landfast Sea Ice in Prydz Bay, East Antarctica.” Antarctic Science 28 (1): 59–70. doi: 10.1017/S0954102015000449
- Yu, L., Z. Zhang, M. Zhou, S. Zhong, B. Sun, H. Hsu, Z. Gao, H. Wu, and J. Ban. 2011. “The Intraseasonal Variability of Winter Semester Surface Air Temperature in Antarctica.” Polar Research 30: 6039. doi: 10.3402/polar.v30i0.6039.