
ABSTRACT
Cropland is one of the essential elements of our ecological systems for producing agricultural products. In developing countries, urban expansion is a frequently appearing phenomena, which is a type of land cover land use (LCLU) change. This change can drastically alter the features on the land surface including croplands. It can lead to detrimental consequences which has considerable effects on the social-ecological systems when croplands are lost. Argentina is an extremely agricultural intense developing country, and Buenos Aires province is a top agricultural production site and has been urbanizing during the last 30 years. Thus studying and analyzing the metropolitan area of this province will contribute to our understanding of the relationship between urban expansion and its effect on croplands. So far, no research has used measurable quantitative methodologies on the Buenos Aires metropolitan region (BAMR) to reveal the relationship between urbanization and cropland. By using 30-meter resolution Landsat images of June 1985 and July 2015, this study finds urban land has expanded from 937.16 km2 to 1835.47 km2, and 30.28% of the new urban lands comes from existing croplands.
1. Introduction
1.1. Background
Urbanization at difference scales has been the study area for many researchers due to its profound effects on the environment. Using remote sensing images and methods is crucial to understand ‘global environmental change’, ‘regional planning’, and ‘natural resource management’ (Seto and Liu Citation2003).
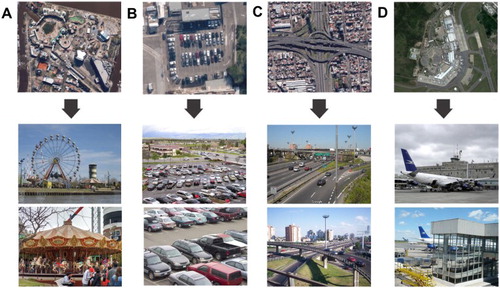
Definitions of urban expansion can be different. Some define it as the increasing share of a nation’s population living in urban areas and a declining share living in rural areas (Satterthwaite, McGranahan, and Tacoli Citation2010). Others see it as increase in impervious surfaces, and other forms of built structures (Seto et al. Citation2011). For this research, urban expansion is defined as an increase in more city-like areas or features. It can appear in the form of newly formed housing, roads, buildings, or industrial designated areas ( and ).
Figure 1. Urban land patterns in BAMR area (housing). Left: urban centers of provincial departments; Middle: slums or informal settlements; Right: disperse housing. Modified from ‘Natural territory, urban growth and climate change in the Parana River Delta and Rio de la Plata estuarine system, Verónica M.E. Zagare, 2011’.
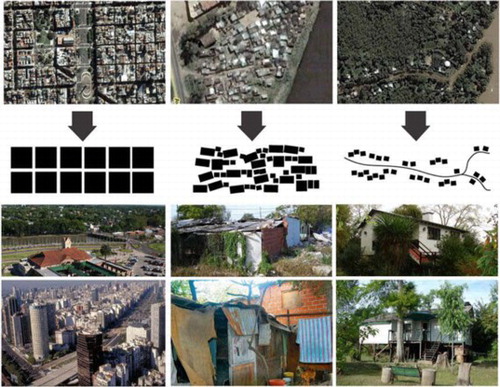
Figure 2. Other urban land features in BAMR area. (A) Amusement parks (Parque de la Costa). (B) Parking lots. (C) Roads and bridges. (D) Airports (Ezeiza International Airpor). Pictures acquired from google earth.
Since urban population have been growing more rapidly than rural population especially in developing countries like Argentina, urbanization is the most important driver in cropland loss (Ramankutty, Foley, and Olejniczak Citation2002; United Nations Citation2014). Indeed, cities settle first near to fertile grounds and water bodies, then starts to develop around its centers and the expansion starts with the surroundings which are usually the most productive agricultural land (Satterthwaite, McGranahan, and Tacoli Citation2010). Investigating the relationship between urban expansion and cropland change will help us to understand better the relationship between environment monitoring, economics and human wellbeing. It can also provide reference for policy-makers to help them understand the impact of allowing urban expansion, thus make the magnitude of urban expansion to be planned appropriately. Effectively monitoring urban expansion and its effects on land use patterns is critical to efficient land use planning and management.
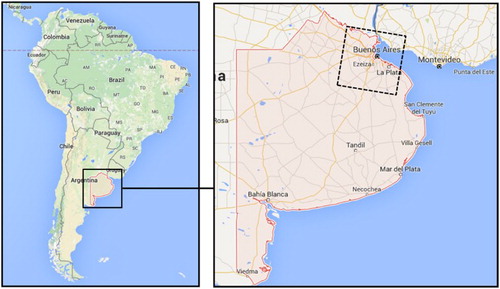
This paper focuses on the Buenos Aires metropolitan region (BAMR), to investigate the impact of urbanization on cropland from 1985 to 2015 (). This study is unique to other research for its site selection, methodologies and research goal. From evidence of other research, it is certain that the urban land and population have expanded over the years near the study area of this research. One study focusing on Parana River Delta and Rio de la Plata estuarine system states that urbanization started in the Buenos Aires Metropolitan Area (BAMA) during 1950s and quickly accelerated since 1990s and reached the Lower Parana Delta (Zagare Citation2011). It also included population data that ‘31% of the national population’ lives in BAMA with less than 0.15% of the country’s surface area, but ‘participates in 53% of the gross domestic product (GDP)’ (Zagare Citation2011). In recent decades, the pace of change in Latin America’s urban landscapes has sped up, in part as a consequence of global economic restructuring, regional integration, national policy decisions, and rural to urban migration. Therefore, an examination of changes proceeding in Buenos Aires should be conducted to understand the interrelationship between urbanization, cropland and ecological systems. Argentina is a distinctive study area because it plays an important role in global wheat, maize, and soybean markets, and has helped increasing the world supply of grains and oilseeds. The most dramatic and extensive land use change in Argentinean started in the last quarter of twentieth Century, with industrial agricultural expansion and the introduction of soybean as the main crop. Currently, Argentina is among the largest crop products exporters. Argentina is also one of the top five bio-diesel producers worldwide (Biodiesel Magazine Editorial Staff Citation2010). However, environmental setbacks such as deforestation, lack of land for subsistence agriculture, are greatly damaging the growth and sustainability of Argentina’s economy (Chakravarty et al. Citation2012). In the Argentinean Great Chaco, 20,000 km2 had been deforested in 1975, 65,000 km2 in 2001 and 100,000 in 2011 (Vallejos et al. Citation2014). According to this result, 20% of the forested area have been lost during 1975–2011. Causes should mainly be seen in the expansion of cropland, but also in infrastructural measures and housing development (Fritsche et al. Citation2015).
Figure 3. Location of BAMR. Left box: Buenos Aires Province. Right dashed box: Buenos Aires Metropolitan Region (BAMR).
Land cover change detection is very complex with regards to ‘spatial arrangement and temporal pattern’ of change in the aspects of ‘functional differences within types of land cover, structural variance between types of land cover change’ (Lambin and Geist Citation2001). Because land use is very complicated to determine when the cities are still expanding, it is very difficult to obtain accurate information about unplanned settlements for residential use at various extent (Kuffer and Barrosb Citation2011). It is very difficult to account in formal written data, however, with remote sensing techniques that this research paper employs, unplanned settlements are easily detected and used in area calculation. Over the past two decades, remote sensing techniques such as image classification and vegetation indexes have provided new tools for studying environmental change and data for mapping the composition of urban settings and analyzing changes over time (Patino and Duque Citation2013). Remote sensing is able to provide ‘spatially consistent data sets’ for large areas with both high resolution and observation frequency (Herold, Goldstein, and Clarke Citation2003). This enables the analysis of land cover patterns and change at local, regional and global scales over time. For example, urban cluster studies of the Atlanta Metropolitan Area have proved the effectiveness of combining remote sensing and geographical information system (GIS) to analyze landscape changes which can classify different spatial patterns into groups and helps to ‘reveal the underlying processes of urban land changes’ (Liu and Yang Citation2015).
Among many research and publications regarding urbanization, most of them focus on urbanization/environment, urbanization/ecology, urbanization/social drivers, and after effects of urbanization. Although the topics are similar (Petrişor Citation2010; Petrişor and Petrişor Citation2013), they do not provide quantitative conclusions. Some provide the effect of inefficient urbanization on different land types (Cadenasso, Pickett, and Schwarz Citation2007; Luck and Wu Citation2002), but do not include cropland. Others analyze the ecological changes brought about by urban expansion without specifying the cropland impacted by urbanization (Morello et al. Citation2000).
Limited research has been done towards urban expansion in BAMR, Argentina and its effect on cropland especially using remote sensing techniques. This research aims to reveal how much has urban lands increased and how much of that comes from existing croplands. By using time series remote sensing data, this study is able to quantify cropland loss and better understand the relationship between urban expansion and cropland change.
1.2. Methodology review
Using remote sensing technologies is a way of measuring change in the land surface and to record natural or human activities on Earth (Jensen Citation2005). Some scientists think remote sensing data obtained through satellites inspired more ways of using the data such as ‘change detection algorithms and methodologies’ to record land cover land use (LCLU) change (Hester Citation2008). Advanced change-detection methods use GIS data, interpretive modeling, classification process to do spatial analysis (Lu et al. Citation2004). These methods are too diverse to fit many general characterizations, but they are usually developed in response to specific research area issues or LCLU categories of particular interest.
There are many different methods to detect land cover change. Some use a nested hierarchy of land cover to monitor land use (Seto and Kaufmann Citation2003). Others calibrate Landsat L1T images to surface reflectance and brightness temperature (BT) and a further screening procedure based on the RIRLS (Robust Iteratively Reweighted Least Squares) technique can be implemented (Fu and Weng Citation2016). Another is using maximum likelihood classifier to detect urban change with Landsat TM images from two periods (Seto and Liu Citation2003). Maximum likelihood is a parametric supervised classification method assuming a normal distribution that usually requiring iterations.
To understand temporal-spatio landscape dynamics, researchers have used multi-temporal satellite imagery combined with supervised classification methodology (Nori, Elsidding, and Niemeyer Citation2008; Rawat and Kumar Citation2015). As a free-of-charge open source database with a wealth of information, Landsat image set has been provided as an invaluable research tool for the scientific community to study LCLU change and subsequent environmental influences (Bastawesy Citation2014; Chander, Markham, and Helder Citation2009). Many type of information can be obtained from Landsat images depending on the processing methods, for example, statistics, image maps, and classified maps.
2. Data and methodology
Data for this research are Landsat images (path 225 row 084) for June 1985 and July 2015 from USGS Glovis (U.S. Department of the Interior Citation2016). Winter season in Argentina include June, July, and August. Both images are from winter season to keep consistency. It is also a good time for image classification because plant growth is generally very slow so the urban structures will be especially visible and clear.
Statistical method was commonly applied during early years of remote sensing analysis due to the limitation of computer power. Although statistical allows relatively fast analysis and can produce quantitative output of the landscape overview, it can only apply to a small area and there is no detailed map or visual aids. Since there is no mapped output using statistics method, it makes spatial analysis to be impossible which is a huge disadvantage to geographical analysis. One way to detect change is output image maps by simply overlaying two Landsat images together to view images from different dates simultaneously. Overlaying maps shows direct spatial comparison between images on different dates and gives researchers a better sense of LCLU changes. However, this method is not quantitative itself for downstream analysis. Here, classified maps using decision tree method is used in this study after overlaying images from 1985 to 2015, which is also the most representative analyzing method currently. Classified maps can produce pixel counts, which can quantify landscape changes by calculating how many pixels are in each categorized land types. For example, non-urban land becomes urban land, non-urban land stays non-urban, or urban land stays as urban. This method requires massive researcher-supervised site selection to reduce error rate before performing automated spatial analysis and multiple iteration, thus it is time-consuming and costly. Nonetheless, the result’s accuracy increases with more iterations. In addition, unlike generally viewing the landscape, classified maps using decision tree method allows quantification analysis to accurately measure LCLU changes. To decrease the cost of classifying large areas, choosing small yet symbolic portions of the entire image as training sites for precise classification can be used as sampling strategy.
During recent years, decision tree model used in classification for remote sensing images has become more popular (Pal and Mather Citation2003). In decision tree classification, both the variances and covariances of the class signatures are considered when assigning each cell to one of the classes represented in the signature file. This study also uses this classification method over maximum likelihood classification (MLC) and artificial neural networks (ANN) because decision tree is non-parametric, do not operate under any assumptions of data distribution, and decision tree is computationally fast for a supervised classification method. Even more, software to implement decision tree is readily available over the Internet. Other researchers agree on the advantage of using decision tree indicating that ‘pruning of decision tree can make them smaller and more easily interpretable, while the use of boosting techniques can improve performance’ (Pal and Mather Citation2003). A probability map is generated as part of the decision tree process.
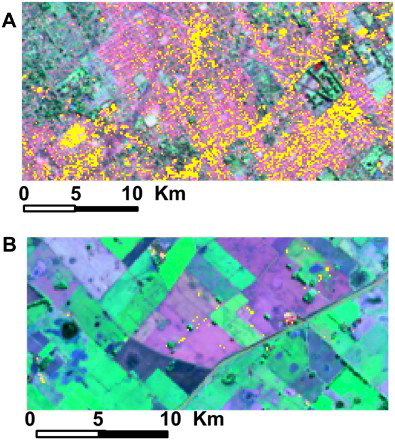
Before classifying, import image to ArcMap and set the combination of spectral bands to Band 1 (Blue), 4 (Near Infrared), and 5 (Shortwave Infrared). Since blue discriminates soil from vegetation, near infrared distinguish vegetation varieties and conditions; this also distinguishes water bodies (lakes and sinkholes), dry and moist soils (urban land and croplands), and shortwave infrared can separate forestlands, croplands, water body distinctly. To classify urban and non-urban for both 1985 and 2015 images ((A)), use (A) as reference. It will be clear where the urban grew and where the cropland is converted when comparing both images ((B)). Select around 20 training sites first and reiterate to correct misclassified areas to improve accuracy. Many iterations are done and hundreds of training sites are selected to improve accuracy by reducing omission error and commission error. After this, cropland that were replaced by urban lands can be identified within the urbanized land, thus finding how much urbanized lands were at cost of croplands.
Figure 4. Decision tree analysis. (A) Classify the BAMR region into urban and non-urban land. (B) Use bands from both images to classify cropland loss.
2.1. Accuracy assessment
The purpose of accuracy assessment is to identify how much of the classification is error-free. In most cases, the entire population of data is too time-consuming to validate, thus sample data are used for estimating accuracy. In the geography major, it is well known to conduct and often required to do an accuracy assessment (Foody Citation2002; Strahler et al. Citation2006). However, most accuracy assessment result of remotely sensed images for land change detection are vague, insignificant and ‘routinely fail to assess the accuracy of the final change maps’; thus little of the published papers on change detection ‘make full use of the information obtained from accuracy assessments’ (Olofsson et al. Citation2013).
This research used random sampling as accuracy assessment. Random sampling is a method of selecting n units (a sample of the population data, N) such that ‘every one of the NCn distinct samples has an equal chance of being drawn’ (Cochran Citation1953). This method guarantees that whenever selecting a sample after any sample(s) have already been selected, there will be equal possibility for any remainders in the population to be selected as sample.
3. Results
3.1. Urban land expansion from 1985 to 2015
Buenos Aires Province is the most developed province of Argentina that has an area of 118,754 mi2 (307,571 km2) (). Although Buenos Aires City, the capital and primary city of Argentina, is also located in the north of Buenos Aires Province, it only covers 0.1% area of the entire province. By contrast, 99.9% of the Buenos Aires Province land is composed of non-urban land including grassland (73.0%), cropland (24.4%), and water body (2.6%) (Baldi, Guerschman, and Paruelo Citation2006). Meanwhile, almost all of the grassland are predicted to be converted to croplands in the future (Baldi, Guerschman, and Paruelo Citation2006). Thus, little information could be found if Buenos Aires Province is studied as a whole for urban expansion. To concentrate on the impact of urbanization, the metropolitan region around Buenos Aires City, defined as Buenos Aires Metropolitan Region (BAMR, 32,400 km2) in this study, is chosen to investigate the amount of croplands lost due to urbanization between 1985 and 2015, and related ecological and social impact (, dashed box). By focusing on this region, the ratio of urban land increases from 0.1% (of Buenos Aires Province) to 3% (of BAMR) as of 1985, which significantly improves the resolution to examine impact of urbanization.
Urban land is defined by different features and patterns. As the most urbanized region in Argentina, the most common urban feature in BAMR is housing which can be characterized into different types: urban centers of provincial departments, slums or informal settlements, and disperse housing (). Other urban land features include parks, parking lots, roads, airports, etc. (). These urban patterns have different impacts on the territory and are also affected by climate change and shaped by socioeconomic dynamics. Small urban areas, especially the most recently developed regions such as informal settlements, disperse housing, and expansion of suburban area, are not as easy to classify as the clustered large urban centers and major roads. This is because small urban areas are generally surrounded by non-urban features that have similar reflectance (i.e. bare ground, rocks) on an unprocessed Landsat image. For these hard to distinguish areas, no training data (site selection for automatic decision tree process) were selected. The decision tree process itself can do a better analysis on these uncertain areas and separate them into their own class than the human eyes. It is critical to focus on these regions when identifying cropland conversion to urban land because they are also the most active urbanizing places in BAMR undergoing dramatic LCLU changes that have profound socioeconomic impact. Therefore, only certain training samples were selected for urban, non-urban, and non-change for both 1985 and 2015 in BAMR. Following iterations were performed by evaluating omission error and commission error rates, correcting misclassified regions and adding more training sites. More than 100 training sites were used for classification of urban area and cropland to reach sufficient accuracy (81%, see Accuracy Assessment). The classified Landsat images were then utilized to examine the impact of urban expansion on land loss.
Classification of urban land expansion in BAMR shows that urban land area was 937.16 km2 and non-urban land area was 31,462.84 km2 in 1985. In 2015, urban land area was increased to 1835.47 km2 and non-urban land area was decreased to 30,564.53 km2 (). This translates to 3% urban land in 1985 and doubled to 6% in 2015.
Table 1. Urban and non-urban area statistics (Calculated with Landsat image footprint).
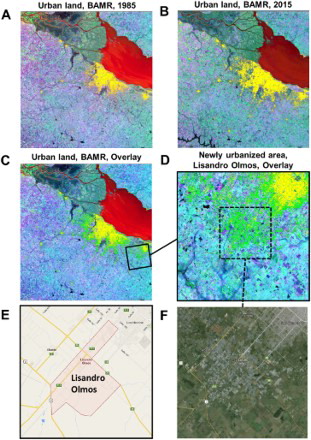
To illustrate the extent of urbanization, visual maps of urban expansion from 1985 to 2015 are generated (). (A) shows the classified urban land in 1985 (yellow). (B) shows the classified urban land in 2015 (yellow). By merging the classification results together, (C) illustrates the urban region has extensively grown from 1985 (yellow) to 2015 (green), and the urban expansion occurred predominately near existing urbanized areas. There is also a noticeable rapid development of Lisandro Olmos town in the BAMR area ((D–F)). In 1985, the urbanization level in Lisandro Olmos was extremely low that little urban land can be detected. However, as of in 2015, this region became profoundly urbanized ((D)). Historic data shows that Lisandro was an intensive horticultural area since 1939. It only had 100 inhabitants in 1950, but later on became urbanized. The inhabitants increased to 17,872 in 2001 (Censuses Citation2001) and there were more than 5000 households in 2012 (Wikipedia Citation2016). The rapid urbanization of this town and associated area sets an excellent example of how urban expansion has occurred in the BAMR area within the study period.
Figure 5. Urban land expansion in BAMR. (A) Urban land classification of Landsat image (path 225 row 084, BAMR) for June 1985 from USGS Glovis. (B) Urban land classification of Landsat image (path 225 row 084, BAMR) for July 2015 from USGS Glovis. (C) (A) merged with 5B. Yellow: 1985 urban land; Green: 2015 urban land. (D) Lisandro Olmos (dashed box) is a newly urbanized area in BAMR. (E) Google Map image showing the boundary of Lisandro Olmos. (F) Google Earth satellite image showing the urban extent of Lisandro Olmos in July 2015. (Color online.)
3.2. Cropland loss due to urban land expansion between 1985 and 2015
When urbanization happens, non-urban lands are converted into urban lands. This research examines how much cropland is lost due to urbanization. (A) shows loss of cropland (yellow) due to urbanization on 1985s satellite image. Then the same cropland loss result is displayed on the 2015 image ((B)). From (A), with cropland loss classification, it indicates the croplands yet to be converted into urban areas by 2015. From (B), it indicates the urban areas where they used to be croplands in 1985. To clearly demonstrate cropland loss in BAMR during this period, all the area where no cropland loss is assigned blue, thus only the cropland loss due to urban expansion (yellow) between 1985 and 2015 is presented ((C)). A probability map is generated to evaluate and predict cropland loss due to urbanization in BAMR ((D)). Regions that are actively undergoing massive urbanization are highlighted; whereas areas labeled no change or have low potential of cropland loss in the near future are eliminated from the images. As expected, the urbanized area did not increase much inside the center of the Buenos Aires City since it is already heavily urbanized even before the study period. By contrast, regions that are far from the city also have low possibility or no possibility of cropland conversion to urban land primarily due to their distance from the center of urbanization. By comparing (C,D), it is clear that the most of the cropland loss occurs at suburban areas between 1985 and 2015, and this trend of cropland loss will continue as the urban areas keep expanding in the future.
Figure 6. Cropland loss in BAMR. (A) Cropland loss shown on 1985 Landsat image of BAMR. (B) Cropland loss shown on 2015 Landsat image of BAMR. (C) Cropland loss classification analysis. Yellow: lost area of cropland; Blue: non-change area of cropland. (D) Probability map of cropland loss results. Black: 0%; Blue: 50%; Green: 100%. (Color online.)
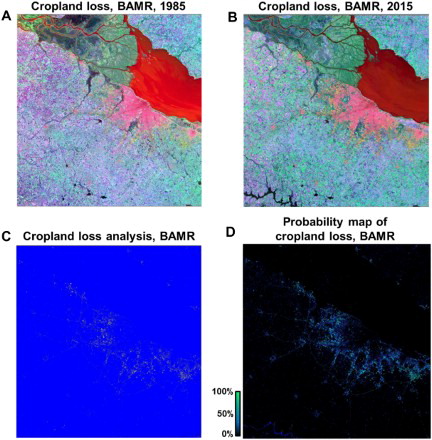
Quantification of classified Landsat images shows that the total urban expansion in BAMR from 1985 to 2015 is 898.31 km2 ((C)). During the same period, total cropland loss due to urban expansion is 272 km2 ((C)). Therefore, 30.28% of land loss between 1985 and 2015 due to urban expansion is cropland ((A)). Considering the acceleration of urbanization rate and land type composition change near the newly form urban/suburban areas, this ratio might further increase as urban expansion extend into the vast majority of cropland in BAMR.
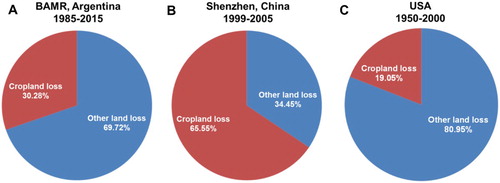
Figure 7. Comparison of cropland loss due to urbanization between different cities. (A) Cropland loss during urban expansion from 1985 to 2015 in BAMR, Argentina. (B) Cropland loss during urban expansion from 1999 to 2005 in Shenzhen, China. (C) Cropland loss during urban expansion from 1950 to 2010 in USA.
3.3. Accuracy assessment result
There were 100 random points generated and projected onto the classified image to test accuracy for this research on BAMR. Using google track, point locations can be directly linked to google earth. (A) was used to do accuracy assessment because land types are distinguishable by their shapes, location, and features by direct observation. Knowing the original land type of 1985, then use google earth to check the land type in 2015 and to determine if the classification is accurate. After assessing 100 points, the result of overall accuracy of cropland loss is 81%. This is a relatively desirable accuracy for classification. Some published literatures’ accuracy assessment have 48% (Olofsson et al. Citation2013), or 58% and 72% (Hugenholtz et al. Citation2013) to sufficiently prove a correlation.
4. Discussion and analysis
For thousands of years, ‘cities have expanded into neighboring fields and orchards as the population required more space for’ residential, agricultural, industrial, and cultural uses (Gardner Citation1996). This continuous human population growth and modifying LCLU increases ‘global demand for ecosystem services’ which are mainly provided by non-urban lands (Setälä et al. Citation2014). Urbanization was easily accommodated at early stages since undeveloped land was plenty, increased population could simply occupy new areas that were previously non-urban lands. However, as land availability decreases, different land uses will start competing for the limited space. Different theories and strategies have been proposed to solve these conflicting interests. The central challenge is to find the best way to weigh these conflicts in order to achieve an optimal solution that not only satisfies the demand of various land uses but also maintains social-ecological sustainability (Setälä et al. Citation2014). The most apparent land use conflicting regions are suburban areas. The feature of this type of soil usually consists of sparse housing units and some croplands to those cultivators (Setälä et al. Citation2014). Rapid urbanization has occurred during the past two centuries in developed countries and accelerated significantly within the last few decades globally, which is especially active in the suburban areas, resulting in net cropland loss due to the limited availability of new land (Gardner Citation1996). Same scenario could be placed on BAMR that the massive city expansion between 1985 and 2015 is in the cost of remarkable and potentially irreversible cropland loss.
4.1. Urbanization pattern
The urbanization type of this study is concentric. The concentric zone model is first created by a sociologist named Ernest Burgess in 1925. It suggests the urban growth can be ‘best illustrated … by a series of concentric rings’ (Burgess Citation2008). BAMR’s urban expansion pattern matches with this type of expansion because the comparison between 1985 and 2015 shows that the city kept growing around the city center. It is a typical processes of the expansion of a city with ‘The Loop’ (downtown), ‘zone in transition’, ‘zone of workingmen’s homes’, ‘residential zone’, and ‘commuters zone’ (Park, Burgess, and McKenzie Citation1984).
4.2. Drivers of cropland loss
Understanding the drivers of cropland loss can help prevent future cropland loss and help decision-makers make better choices. Political decisions are the main cause of cropland loss. The best agricultural lands are often replaced by cities (Pimentel and Pimentel Citation1980). This is because humans choose to settle close to ‘river basin areas where fertile, deep soils’ are good for agriculture and being close to large or multiple waterbodies reduces water transportation costs (Pimentel and Pimentel Citation1980). When policy-makers decide to improve transportation, agricultural lands are liable to disturbance. This is due to the fact that road infrastructures are near cropland and river basins for easy accessibility (Pimentel and Pimentel Citation1980). Cropland loss may accelerate grassland to cropland conversion. Native grasslands are excellent breeding habitat for birds, mammals, and other animals. Loss of native grassland is irreversible and will result in severe ecological problems. Many native animals will lose their habitat and animal farmers will lose precious grazing lands.
New classical economic theory can be one of the reasons for cropland loss. According to this theory, land use change is the result of land managers to pursue the maximum profit (Liu et al. Citation2005). When city size increase, there will be more residents. More people create more employment opportunities thus increase the GDP of that area. This triggers a chain reaction: with more employments, there will be more service sector developed. More commodities in turn would attract even more residents and may lead to much more economical income than agricultural lands.
4.3. Social-ecological resilience
Social resilience is the ability of human communities to cope with externalities, no matter beneficial or stressful, as a result of social, political, and environmental change. Ecological resilience is the ability of the living things within that environment to maintain their original characteristics when faced with a disturbance. The fundamental idea is that human society and natural environmental systems interact and co-evolve as time elapses. Social ecology is related to land use and agricultural production, and the environmental impacts of human activities. It examines the past and present transitions, and projects the future of society–nature coevolution (Fischer-Kowalski Citation2015). A resilient social-ecological systems incorporate ‘diverse mechanisms for living with’, and learning from, ‘change and unexpected shocks’ (Adger et al. Citation2005).
To support the increasing human population, agricultural activities and urbanization have caused broad and intense changes in the ecosystems, in the perspective of both structure and function (Ellis and Ramankutty Citation2008). Different original land use types have been changed or diminished due to intensification or extensification of land uses (Plieninger, Höchtl, and Spek Citation2006). Urbanization and its induced cropland loss is a test for social-ecological resilience. Sometimes, highly resilient is not necessarily good. It can even prevent desirable outcome from happening when changes occur. Although there is reduction of cropland, if the urban expansion can lead to higher income and better life quality the residents as well as out-weighting the cost of agricultural land loss, then this would be a positive change overall. In addition, agricultural landscape is a substantial component of ecosystem by itself and has profound influences on ecosystem services including carbon sequestration, water recycling, and greenhouse gas emission, which also need to be taken into consideration (Turbé et al. Citation2010; Mitchell and Popham Citation2007).
4.4. Alternatives
On the other hand, even though cropland have reduced in area, it could have become more productive with today’s technology. Because economies of scale and technical skills became very important with the new technologies involved in the production of crops, many owners chose to rent out their land rather than cultivate it (Matteucci Citation2012). Survey data indicates nearly 60% of agricultural land is under non-owner operator management (Matteucci Citation2012).
4.5. Comparison between countries and patterns
The economy structure of Argentina heavily relies on agriculture, which has deep impact on its government policy and urbanization process. However, this economy structure may change overtime as Argentina is trying to escape from the middle-income trap – China could be an example to follow. To compare, a recent study in China indicated that urbanization is the most significant landscape change in Shenzhen City and has irreversibly transformed about 20.21% of Shenzhen’s surface during 1999–2005, of which, 65.55% is cropland ((B)) (Deyong et al. Citation2009). Both Argentina and China are developing countries undergoing rapid urbanization, yet there are intrinsic differences between these countries regarding government policy, industrial structure, population stress, and other factors. Therefore, comparing the results from this study with previous research conducted on other regions would help understand the drivers and eco-social impact of cropland loss due to urbanization. Although agriculture plays a critical role in both Argentina and China, in the near future, the economy of Argentina will continue heavily rely on primary products. Meanwhile, Shenzhen, as a representative city of the Reform and Opening policy in China, has experienced rapid industrial restructuring and become less dependent on agriculture. This difference could very well explain the higher portion of cropland loss during urban expansion observed in Shenzhen, compared to BAMR.
By contrast, urbanization has been well established in developed countries throughout the past a few centuries, and will have less impact on cropland loss compared to developing countries. For instance, during the decade 1990–2000 in the European Union, the area converted to housing, industrial, transportation, and commercial uses was only around 1 M ha. Therefore, to evaluate the impact of urban expansion on cropland loss in developed countries, and set it as an example to forecast the impact of land change for developing countries, we need to examine earlier periods. In the USA, urban, suburban, and exurban areas increased from 6% in 1950 to 27% in 2000, and now cover an estimated 148 M ha. Creation of these urbanized area caused an 11% decline in cropland area: dropped from 35% in 1950 to 31% in 2000. Overall, 19.05% of land loss due to urbanization is cropland (Brown et al. Citation2005) ((C)). This is lower than the two developing areas: 30.28% in BAMR, Argentina and 65.55% in Shenzhen, China. However, it implies that cropland loss due to urbanization is a continuous and inevitable process even in developed countries, raising the concern of global cropland scarcity in the near future.
In 2002, researchers estimated that during the next three decades 30–60 Mha cropland will be taken out of production in the developing countries due to demands for urban space (Döös Citation2002). Recent study further suggests that different land uses will be competing for the available land: compared to 2000, there will be a total 81–147 Mha cropland demand for 2030; meanwhile, urban areas will continue to expand by 48–100 Mha globally (Lambin and Meyfroidt Citation2011). Although urban areas only occupy less than 0.5% of the total land surface, it is predicted that urbanization causes 1.6–3.3 Mha of cropland loss annually (Lambin and Meyfroidt Citation2011). The threat to cropland can be substantial, especially in BAMR. Buenos Aires Province is one of the most productive province in Argentina. Losing valuable cropland has the potential to effect the region’s environment in the long-run since development of agricultural land is rarely reversed.
Comparing my results with previously published analysis on a urbanization pattern of developed country and a developing country would not only help understand the intrinsic drivers that cause the differences of cropland loss during urbanization, but also predict potential cropland loss trend of Argentina in the future.
4.6. Limitations
There are few limitations to classifying urban land and cropland loss. This study assume that a water body (Rio Salado) in 1985 will stay in that size for 2015 so it does not affect total land area. However, when a dam was built between 1985 and 2015 to controls the flow of Rio Salado (Salty River), the land area around the river filled with water so it is classified as non-urban. Rio Salado was a much smaller river in 1985 ((A)) than what it became in 2015 ((B)). Another potential error is with image classification. Even after more than 100 training sites, there were still omission and commission errors. (A) shows omission error where urban lands were under-classified. There are some commission errors where cropland was identified as urban land ((B)). Additional iteration is helpful to further diminish these errors.
Figure 8. Limitations in detecting land cover changes. Rio Salado (Salty River) is a river that crosses several provinces of Argentina and its flow is regulated by the Los Figueroa Reservoir, and by a Derivation Dam (Dique Derivador). (A) Rio Salado dried out in June 1985. (B) Rio Salado formed a wide river in July 2015.
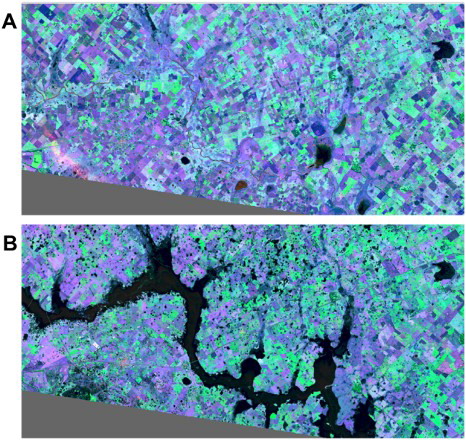
Figure 9. Potential errors in detecting land cover changes. (A) Omission error where urban lands were under-classified. (B) Commission errors where cropland were identified as urban land.
4.7. Making connections and future works
As global population keeps growing and urbanization continues to expand, the competition of the available land by cities and agricultural land will be more intensive in the future. Therefore, it is critical to assess trade-off of ecosystem services caused by the conversion of prime agricultural landscape to urban land. Particularly, the competition of different land use may causes severe ecological consequences (Raudsepp-Hearne, Peterson, and Bennett Citation2010). For example, as the global population keeps growing and the trend of urbanization has not been attenuated, more and more land (including cropland) are transformed into urban area. Meanwhile, the growing population has an apparently increasing demand of agricultural products, resulting in expansion of cropland in the cost of natural ecosystems. And the conversion of natural ecosystem has been considered as irreversible (Palmer and Filoso Citation2009).
For future work, multi-temporal images can be considered as they give more detail to what has happened over a period of time. Another one is to use explicit change-detection method such as 3D change detection using LIDAR instead of a post-classification approach to improve change characterization. Finally, make statistical connection to socioecological and socioeconomical drivers such as system resilience, ecological well-being, population growth, and economic development.
5. Conclusion
This research has investigated in a unique designated region, BAMR, that is significant and suitable for urban and cropland loss study. Although many researchers had studied multiple aspects of ecological systems, none had quantitative result using remote sensing techniques and GIS data to conduct the effect of urban land expansion on cropland. This study used supervised decision tree classification method to detect urban and non-urban land for satellite image from 1985 and 2015, then overlaying both images to detect cropland loss due to urban expansion. Results shows that the urban land area has nearly doubled from 937.16 km2 to 1835.47 km2 during 1985 to 2015. Of the area that has expanded (1835.47 km2−937.16 km2 = 898.31 km2 ), 272 km2 comes from existing cropland which is 30.28%. An accuracy assessment test using random sampling was following to validate the result of the decision tree classifications. The accuracy of the result is 81% which proves the method is a significant and valid.
Settlements often begin at somewhere with close to water bodies so it can be easily transported. As urbanization occurs, some fertile croplands holding high socioeconomic profits are urbanized too only because it is convenient to expand into neighboring fields. Replacing cropland and relocating cropland elsewhere less fertile is doing the exact opposite of what was desired in the first place. Alternatives should consider discovering other ways or urbanization that is less disturbance to the current ecological system. However, not all urbanization is negative. If the per unit socioeconomic value is greater than the one that is being replaced, people will be better off. Inevitably, population will keep growing. It will be more feasible and more environmentally friendly to increase the concentration of the population rather than spreading out and developing new lands. This research provides useful information for policy-makers due its quantitative results and the analysis of ecological consequences when croplands are lost.
Acknowledgement
I would like to thank my advisor, Dr Christ Justice, chair and professor of the geographical sciences department at University of Maryland, for his comments that greatly improved this manuscript.
I would also like to show my gratitude to Dr Xiaopeng Song who gave critical comments to improve the methodology of this paper.
I thank Brian Barker for supervising me on Argentina winter wheat global agriculture monitoring project, which provided me the ground for developing my own research.
Disclosure statement
No potential conflict of interest was reported by the author.
References
- Adger, W. N., T. P. Hughes, C. Folke, S. R. Carpenter, and J. Rockström. 2005. “Social-ecological Resilience to Coastal Disasters.” Science 309 (5737): 1036–1039.
- Baldi, G., J. P. Guerschman, and J. M. Paruelo. 2006. “Characterizing Fragmentation in Temperate South America Grasslands.” Agriculture, Ecosystems & Environment 116 (3–4): 197–208. doi:10.1016/j.agee.2006.02.009.
- Bastawesy, M. E. 2014. “Hydrological Scenarios of the Renaissance Dam in Ethiopia and its Hydro-Environmental Impact on the Nile Downstream.” Journal of Hydrologic Engineering 20 (7): 04014083.
- Biodiesel Magazine Editorial Staff. 2010. Global Biodiesel Production and Market Report. http://www.biodieselmagazine.com/articles/4447/global-biodiesel-production-and-market-report.
- Brown, D. G., K. M. Johnson, T. R. Loveland, and D. M. Theobald. 2005. “Rural Land-use Trends in the Conterminous United States, 1950–2000.” Ecological Applications 15 (6): 1851–1863.
- Burgess, E. W. 2008. “The Growth of the City: An Introduction to a Research Project.” In Urban Ecology: An International Perspective on the Interaction Between Humans and Nature, edited by J. M. Marzluff, E. Shulenberger, W. Endlicher, M. Alberti, G. Bradley, C. Ryan, U. Simon, and C. ZumBrunnen, 71–78. Boston, MA: Springer US.
- Cadenasso, M. L., S. T. Pickett, and K. Schwarz. 2007. “Spatial Heterogeneity in Urban Ecosystems: Reconceptualizing Land Cover and a Framework for Classification.” Frontiers in Ecology and the Environment 5 (2): 80–88.
- Censuses, N. I. o. S. a. 2001. 2001 Population Census. http://www.indec.gob.ar/.
- Chakravarty, S., S. Ghosh, C. Suresh, A. Dey, and G. Shukla. 2012. “Deforestation: Causes, Effects and Control Strategies.” Global Perspectives on Sustainable Forest Management 1: 1–26.
- Chander, G., B. L. Markham, and D. L. Helder. 2009. “Summary of Current Radiometric Calibration Coefficients for Landsat MSS, TM, ETM+, and EO-1 ALI Sensors.” Remote Sensing of Environment 113 (5): 893–903.
- Cochran, W. G. 1953. Sampling Techniques. New York: John Wiley & Sons.
- Deyong, Y., S. Hongbo, S. Peijun, Z. Wenquan, and P. Yaozhong. 2009. “How Does the Conversion of Land Cover to Urban Use Affect Net Primary Productivity? A Case Study in Shenzhen City, China.” Agricultural and Forest Meteorology 149 (11): 2054–2060.
- Döös, B. R. 2002. “Population Growth and Loss of Arable Land.” Global Environmental Change 12 (4): 303–311.
- Ellis, E. C., and N. Ramankutty. 2008. “Putting People in the Map: Anthropogenic Biomes of the World.” Frontiers in Ecology and the Environment 6 (8): 439–447.
- Fischer-Kowalski, M. 2015. Social Ecology A2 – Wright, James D International Encyclopedia of the Social & Behavioral Sciences, Second ed., 254–262. Oxford: Elsevier.
- Foody, G. M. 2002. “Status of Land Cover Classification Accuracy Assessment.” Remote Sensing of Environment 80 (1): 185–201. doi:10.1016/S0034-4257(01)00295-4.
- Fritsche, U. R., U. Eppler, L. Iriarte, S. Laaks, S. Wunder, T. Kaphengst, F. Wolff, D. Heyen, and A. Lutzenberger. 2015. “GLOBALANDS: Resource-efficient Land Use – Towards a Global Sustainable Land Use Standard: Synthesis Report.” Darmstadt, Berlin.
- Fu, P., and Q. Weng. 2016. “A Time Series Analysis of Urbanization Induced Land use and Land Cover Change and Its Impact on Land Surface Temperature with Landsat Imagery.” Remote Sensing of Environment 175: 205–214.
- Gardner, G. 1996. Shrinking Fields: Cropland Loss in a World of Eight Billion. Washington, DC: Worldwatch Paper.
- Herold, M., N. C. Goldstein, and K. C. Clarke. 2003. “The Spatiotemporal Form of Urban Growth: Measurement, Analysis and Modeling.” Remote Sensing of Environment 86 (3): 286–302.
- Hester, D. B. 2008. Land Cover Mapping and Change Detection in Urban Watersheds Using QuickBird High Spatial Resolution Satellite Imagery. Raleigh, NC: ProQuest.
- Hugenholtz, C. H., K. Whitehead, O. W. Brown, T. E. Barchyn, B. J. Moorman, A. LeClair, K. Riddell, and T. Hamilton. 2013. “Geomorphological Mapping with a Small Unmanned Aircraft System (sUAS): Feature Detection and Accuracy Assessment of a Photogrammetrically-derived Digital Terrain Model.” Geomorphology 194: 16–24. doi:10.1016/j.geomorph.2013.03.023.
- Jensen, J. R. 2005. “Thematic Map Accuracy Assessment.” In Introductory Digital Image Processing–A Remote Sensing Perspective, 3rd ed., edited by C. C. Keith, 495–515. Upper Saddle River, NJ: Prentice Hall Series in Geographic Information Science.
- Kuffer, M., and J. Barrosb. 2011. “Urban Morphology of Unplanned Settlements: The Use of Spatial Metrics in VHR Remotely Sensed Images.” Procedia Environmental Sciences 7: 152–157.
- Lambin, E. F., and H. Geist. 2001. “Global Land-use and Land-Cover Change: What Have We Learned So Far.” Global Change Newsletter 46 (6): 27–30.
- Lambin, E. F., and P. Meyfroidt. 2011. “Global Land use Change, Economic Globalization, and the Looming Land Scarcity.” Proceedings of the National Academy of Sciences 108 (9): 3465–3472.
- Liu, X., J. Wang, M. Liu, and B. Meng. 2005. “Spatial Heterogeneity of the Driving Forces of Cropland Change in China.” Science in China Series D 48 (12): 2231–2240.
- Liu, T., and X. Yang. 2015. “Monitoring Land Changes in an Urban Area Using Satellite Imagery, GIS and Landscape Metrics.” Applied Geography 56: 42–54.
- Lu, D., P. Mausel, E. Brondizio, and E. Moran. 2004. “Change Detection Techniques.” International Journal of Remote Sensing 25 (12): 2365–2401.
- Luck, M., and J. Wu. 2002. “A Gradient Analysis of Urban Landscape Pattern: A Case Study from the Phoenix Metropolitan Region, Arizona, USA.” Landscape Ecology 17 (4): 327–339.
- Matteucci, S. D. 2012. “Human-Natural System Sustainability in Buenos Aires Province, Argentina.” Journal of Geography and Geology 4 (4): 76.
- Mitchell, R., and F. Popham. 2007. “Greenspace, Urbanity and Health: Relationships in England.” Journal of Epidemiology and Community Health 61 (8): 681–683.
- Morello, J., G. D. Buzai, C. A. Baxendale, A. F. Rodríguez, S. D. Matteucci, R. E. Godagnone, and R. R. Casas. 2000. “Urbanization and the Consumption of Fertile Land and Other Ecological Changes: The Case of Buenos Aires.” Environment and Urbanization 12 (2): 119–131.
- Nori, W., E. Elsidding, and I. Niemeyer. 2008. “Detection of Land Cover Changes Using Multi-Temporal Satellite Imagery.” The International Archives of the Photogrammetry, Remote Sensing and Spatial Information Sciences 37 (B7): 947–952.
- Olofsson, P., G. M. Foody, S. V. Stehman, and C. E. Woodcock. 2013. “Making Better Use of Accuracy Data in Land Change Studies: Estimating Accuracy and Area and Quantifying Uncertainty Using Stratified Estimation.” Remote Sensing of Environment 129: 122–131. doi:10.1016/j.rse.2012.10.031.
- Pal, M., and P. M. Mather. 2003. “An Assessment of the Effectiveness of Decision Tree Methods for Land Cover Classification.” Remote Sensing of Environment 86 (4): 554–565. doi:10.1016/S0034-4257(03)00132-9.
- Palmer, M. A., and S. Filoso. 2009. “Restoration of Ecosystem Services for Environmental Markets.” Science 325 (5940): 575–576.
- Park, R. E., E. W. Burgess, and R. D. McKenzie. 1984. The City. Chicago, IL: University of Chicago Press.
- Patino, J. E., and J. C. Duque. 2013. “A Review of Regional Science Applications of Satellite Remote Sensing in Urban Settings.” Computers, Environment and Urban Systems 37: 1–17. doi:10.1016/j.compenvurbsys.2012.06.003.
- Petrişor, A. 2010. “The Theory and Practice of Urban and Spatial Planning in Romania: Education, Laws, Actors, Procedures, Documents, Plans, and Spatial Organization. A Multiscale Analysis.” Serbian Architectural Journal 2 (2): 139–154.
- Petrişor, A.-I., and L. E. Petrişor. 2013. “The Shifting Relationship Between Urban and Spatial Planning and the Protection of the Environment: Romania as a Case Study.” Present Environment and Sustainable Development 7 (1): 268–276.
- Pimentel, D., and S. Pimentel. 1980. “Ecological Aspects of Agricultural Policy.” Natural Resources Journal 20: 555.
- Plieninger, T., F. Höchtl, and T. Spek. 2006. “Traditional Land-use and Nature Conservation in European Rural Landscapes.” Environmental Science & Policy 9 (4): 317–321. doi:10.1016/j.envsci.2006.03.001.
- Ramankutty, N., J. A. Foley, and N. J. Olejniczak. 2002. “People on the Land: Changes in Global Population and Croplands During the 20th Century.” AMBIO: A Journal of the Human Environment 31 (3): 251–257.
- Raudsepp-Hearne, C., G. D. Peterson, and E. Bennett. 2010. “Ecosystem Service Bundles for Analyzing Tradeoffs in Diverse Landscapes.” Proceedings of the National Academy of Sciences 107 (11): 5242–5247.
- Rawat, J., and M. Kumar. 2015. “Monitoring Land use/Cover Change Using Remote Sensing and GIS Techniques: a Case Study of Hawalbagh Block, District Almora, Uttarakhand, India.” The Egyptian Journal of Remote Sensing and Space Science 18 (1): 77–84.
- Satterthwaite, D., G. McGranahan, and C. Tacoli. 2010. “Urbanization and Its Implications for Food and Farming.” Philosophical Transactions of the Royal Society B: Biological Sciences 365 (1554): 2809–2820.
- Setälä, H., R. Bardgett, K. Birkhofer, M. Brady, L. Byrne, P. De Ruiter, F. T. de Vries, et al. 2014. “Urban and Agricultural Soils: Conflicts and Trade-offs in the Optimization of Ecosystem Services.” Urban Ecosystems 17 (1): 239–253.
- Seto, K. C., M. Fragkias, B. Güneralp, and M. K. Reilly. 2011. “A Meta-analysis of Global Urban Land Expansion.” PloS One 6 (8): e23777.
- Seto, K. C., and R. K. Kaufmann. 2003. “Modeling the Drivers of Urban Land Use Change in the Pearl River Delta, China: Integrating Remote Sensing with Socioeconomic Data.” Land Economics 79 (1): 106–121.
- Seto, K. C., and W. Liu. 2003. “Comparing ARTMAP Neural Network with the Maximum-likelihood Classifier for Detecting Urban Change.” Photogrammetric Engineering & Remote Sensing 69 (9): 981–990.
- Strahler, A. H., L. Boschetti, G. M. Foody, M. A. Friedl, M. C. Hansen, M. Herold, J. T. Morisette, S. V. Stehman, and C. E. Woodcock. 2006. “Global Land Cover Validation: Recommendations for Evaluation and Accuracy Assessment of Global Land Cover Maps.” European Communities, Luxembourg 51: 4.
- Turbé, A., A. De Toni, P. Benito, P. Lavelle, P. Lavelle, N. Ruiz, W. H. Van der Putten, E. Labouze, and S. Mudgal. 2010. “Soil Biodiversity: Functions, Threats and Tools for Policy Makers.” Bio Intelligence Service, IRD, and NIOO, Report for European Commission (DG Environment).
- U.S. Department of the Interior. 2016. USGS Global Visualization Viewer. March 31. http://glovis.usgs.gov/index.shtml.
- United Nations. 2014. World Urbanization Prospects 2014: Highlights. New York: United Nations.
- Vallejos, M., J. N. Volante, M. J. Mosciaro, L. M. Vale, M. L. Bustamante, and J. M. Paruelo. 2014. “Transformation Dynamics of the Natural Cover in the Dry Chaco Ecoregion: A Plot Level Geo-database from 1976 to 2012.” Journal of Arid Environments 30: 109.
- Wikipedia. 2016. Lisandro Olmos (La Plata). January 11. https://es.wikipedia.org/w/index.php?title=Lisandro_Olmos_(La_Plata)&oldid=88370367.
- Zagare, V. M. 2011. “Natural Territory, Urban Growth and Climate Change in the Parana River Delta and Rio de la Plata Estuarine System.”