
ABSTRACT
With regard to a multi-dimensional and multi-facetted implementation of the vision of a Digital Earth, capabilities to combine and analyze heterogeneous spatial data sources on the web are becoming increasingly important. In this article, an online system is conceptualized and implemented to facilitate spatial data analysis and decision making specifically for environmental applications. It supports a dynamic search and binding of suitable geoprocessing functionality with respect to the given input data and target description. Geoprocessing patterns are used to create an application-oriented abstraction layer on top of generic geoprocessing services available on the web. As an application scenario the determination and quality assessment for water body structures is taken. For this use case authoritative data, remote sensing imagery and citizen science data gets combined to gain a comprehensive picture of the various spatial, temporal and thematic aspects influencing the quality of inland waters. The prototypical implementation makes use of open standards to facilitate the integration with existing spatial data infrastructures.
1. Introduction
The multitude of spatial data sources that is nowadays more and more openly available on the web plays a significant role in shaping the Digital Earth. Beside national Spatial Data Infrastructures (SDI) providing mostly administrative data, this diversity encompasses the various data offerings from remote sensing and especially addresses voluntarily collected spatial data, commonly denoted as Volunteered Geographic Information (Goodchild Citation2007). On the downside, the plethora of distributed, mostly disconnected data sources still makes spatial data analysis and decision making a tedious task. Thus, the fusion of heterogeneous spatial data sources in a dynamic and responsive manner is required across different scales, geographic borders, organizations and domains. The vision of a Digital Earth aims to overcome data centric infrastructures, such as driven by GEOSS or the various governmental SDI initiatives, toward an open framework that effectively supports collaboration and participation. It especially highlights the need for dynamic and quality-aware processes adapting to actual user and application needs (Craglia et al. Citation2012; Bernard et al. Citation2014).
The demand for online geoprocessing has already been identified by many GIS software vendors, offering comprehensive functionality via specialized server products, such as ArcGIS Server or FME Server. This usually comes at the cost of vendor lock-in with limited interoperability and access. However, as argued by Goodchild et al. (Citation2012), ‘ … access to scientifically grounded information about the planet’s future is a basic human right; … it should be available to all, independent of national policies and strategies, and in a form that is readily understood and absorbed’. The establishment and maintenance of open and interoperable geoprocessing functionality on the web is thus considered an important means to transpose the wealth of spatial data available on the web into useful spatial information.
A promising example for the future application of online geoprocessing is the support for an ad hoc reporting about the status in reaching the United Nations Sustainable Development Goals (SDG) using a set of well-defined indicators (Economic and Social Council Citation2015). Taking water-related SDG indicators as an example, the application developed in the course of this article relates to the determination of water body structures in support for the sustainable management of inland water resources, in particular the ‘Percentage of bodies of water with good ambient water quality’ (Economic and Social Council Citation2015, indicator 6.3.2). Information on the quality of water bodies are of great value to both administration and citizens, especially in areas prone to flooding or environmental hazards. The overall goal is to achieve free and instantaneous access to information on water quality in a comprehensive, interoperable and flexible manner, preferably on a global scale. This goes in hand with a transition from supply oriented to demand-oriented information infrastructures. This also means shifting from traditional partly long-term reporting cycles, resulting in static monitoring reports and maps, to providing means for an ad-hoc combination and integration of distributed, most up-to-date data sources, allowing for a transparent and ideally reproducible analysis of the current environmental status and changes. Possible data sources include both field and remote sensing data provided by governmental agencies, research institutions or citizen science. However, its availability, accessibility and quality varies widely by geographical location. Therefore, indicators on water quality should best be deducible from any data source, but are expected to be improvable by the combination of multiple sources.
The web-based solution for the ad hoc analysis and combination of distributed spatial data sources described in this article is intended to assist decision makers in gaining a comprehensive view on the various spatial, temporal and thematic aspects of a real-world phenomenon. It is prototypically implemented for the determination, enrichment and update of indices linked to the ecological status of rivers. While Section 2 briefly reviews the state-of-the-art for both existing river monitoring strategies and geoprocessing on the web, Section 3 focuses on the core objectives of this article: (a) a process suggestion system for the analysis and combination of heterogeneous spatial data sources on the web, (b) the enrichment of geoprocessing capabilities in current SDIs by the application of geoprocessing patterns and (c) the specification and formal description of data and process constraints. In Section 4, the prototypical implementation of the system is described and evaluated. The conclusion in Section 5 summarizes the contributions and poses further research challenges toward achieving the vision of Digital Earth.
2. State-of-the-art
The determination and improvement of the ecological quality of water bodies is often associated with common conservation objectives (Pedroli et al. Citation2002; de Nooij et al. Citation2004) and the risk and potential impact of flood events (Disse and Engel Citation2001; Hooijer et al. Citation2004; Reinhardt et al. Citation2011; Thieken et al. Citation2016). Regular monitoring and reporting cycles for the ecological water quality have been implemented around the globe. Prominent legal foundations include the European Water Framework DirectiveFootnote1 (WFD) and the Clean Water ActFootnote2 in the United States. The final ecological rating of a water body is usually derived from a number of biological, hydromorphological and physicochemical measurements. However, as shown in Raven et al. (Citation2002), Šípek, Matoušková, and Dvořák (Citation2010) and Karrasch et al. (Citation2015) for the hydromorphological assessment of rivers, results may significantly vary with the underlying classification strategy and scale.
In addition to field observations, remote sensing has a long tradition and will continue to play a significant role in the regular monitoring of water bodies (Palmer, Kutser, and Hunter Citation2015). This is particularly true for areas with less advanced monitoring programs and structures and accordingly low administrative data coverage. For the determination of hydromorphological parameters, various sensor types have already been applied, including optical sensors (Karrasch et al. Citation2015), radar (Klemenjak et al. Citation2012) and airborne laser scanning (Demarchi, Bizzi, and Piégay Citation2016). In addition, remote sensing can be used to monitor certain chemical and biological characteristics (Palmer, Kutser, and Hunter Citation2015). Hence, it is no surprise that the combination of in situ and remote sensing data is considered very important (Schaeffer et al. Citation2013).
In addition and complementary to existing field and remote sensing data on water quality, citizen participation and low cost sensors gain increasing attention as a means to complement regular monitoring in the spatial and temporal dimension (Dworak et al. Citation2005; Lowry and Fienen Citation2013; Buytaert et al. Citation2014). This is mainly due to the fact that local characteristics of water bodies are on the one hand very important to implement reasonable strategies on biodiversity conservation and flood risk reduction (Blöschl, Viglione, and Montanari Citation2013), but on the other hand hard or costly to achieve and maintain in the traditional manner.
For the analysis and combination of the above mentioned data sources on the web in an ad hoc fashion, a service-based solution seems to be most promising. Standardized geoprocessing on the web has already been promoted by a series of initiatives and projects. First application scenarios using the OGC WPS standards were developed by Friis-Christensen et al. (Citation2007), Kiehle, Greve, and Heier (Citation2007) and Lanig et al. (Citation2008). A corresponding research agenda was set up by Brauner et al. (Citation2009). Since then, various aspects of service-based geoprocessing have been further developed by researchers, including the wrapping of legacy software (Müller, Bernard, and Brauner Citation2010; Hinz et al. Citation2013), service orchestration (Müller, Bernard, and Brauner Citation2010; Bensmann et al. Citation2014; Meek, Jackson, and Leibovici Citation2016) and semantic service descriptions (Fitzner, Hoffmann, and Klien Citation2011; Müller Citation2015; Hofer et al. Citation2017a). However, despite those efforts, standardized and open geoprocessing on the web is still considered to be in its early stages, with a particular need for institutional and community engagement (Hofer Citation2015). Moreover, mediating services, comprising pre-processing, connective operations and post-processing, are required for workflow generation, in particular for handling heterogeneous data sources (Hofer et al. Citation2017a).
Besides the generic geoprocessing functionality offered by established WPS frameworks, for example, buffer computation, line simplification or basic raster operations, the majority of online platforms for geoprocessing are theme-specific (Hofer Citation2015). This underlines the demand for pragmatic developments, offering solutions to actual real-world questions and problems. This requires means to abstract from technical service descriptions and provide well-defined, reusable and application-oriented functional descriptions instead. One approach to achieve this are geoprocessing patterns, which are descriptions of common processes within a certain domain with only a loose coupling to the underlying software or service infrastructure (Brauner Citation2015; Wiemann Citation2017).
3. An information system for the analysis and comparison of spatial data
Today’s governmental SDI, as well as volunteered, commercial or scientific initiatives, already offer a vast amount of spatial data on the web. In addition, numerous software tools provide processing functionality related to the determination of water quality. However, the composition of geoprocessing workflows for the analysis or combination of spatial data usually requires specialized software and expert knowledge. Therefore, the main target of the information system proposed here is to assist users in finding and executing appropriate workflows that fulfill their particular need for information.
3.1. Application scenario: assessing the quality of water bodies
With respect to the determination and assessment of the quality of water bodies, three potential stakeholders are identified: the responsible governmental authority, the decision maker and the regular citizen (), each of them with different requirements and objectives. The authority is primarily bound to legislation, for example the national implementation of the EU Water Frame Work Directive in the EU member states, and is required to satisfy the imposed reporting obligations. The decision maker, for instance an environmental planner, a risk manager or an assurance officer, uses existing data to extract most up-to-date information for decision making, for example, in the case of flood events, environmental damage or to calculate insurance rates. Finally, citizens are often interested in gathering information on the water quality in their area, for example, for personal interest or educational purposes (Higgins et al. Citation2016).
Figure 1. Requirements and data sources for the determination of the ecological water quality.
There are three input data sources from which information on water body quality can be derived: data provided by governmental authorities, remote sensing data and data obtained from citizen science projects. Administrative data mainly refer to data from land surveying and environmental authorities as data recorded in compliance with legal reporting activities. The recording and provision of those datasets are required by law and usually characterized as quality-checked and consolidated datasets with long-term maintenance. However, they also come with long update cycles. Remote sensing data refer to both airborne and satellite imagery and are provided by either the relevant competent authorities or private aviation and aerospace companies. Depending on mission, flight path and measurement configuration, remote sensing image data come at various spatial, radiometric, spectral and temporal resolutions. The third input, data from the citizen science, is much more versatile in terms of content, structure, quality and resolution than the previous two. However, this versatility makes it a promising complementary source of information, especially for local characteristics of the environment.
Besides the existence of spatial data, the actual access to raw data is required to allow for spatial data processing. This requires well-defined interfaces and data specifications as well as the willingness to actually provide data on the web. For the public benefit, this should preferably be achieved by the facilitation of open data initiatives, but may as well include proper systems for authentication, authorization and accounting for commercial data sources.
3.2. A suggestion system for the analysis and combination of heterogeneous spatial data sources
Appropriate methods for the analysis of water quality based on single feature objects (e.g. rivers, dams, flood plains, built-up areas, catchments) essentially depend on its spatial representation. For feature objects, with either point, curve or surface geometry, valuable information can be read from the attributes attached to it. This comprises previously determined characteristics of an object, such as conducted measurements on the hydromorphological or the bio-chemical quality. Additional information can be extracted directly from the feature geometry. Whereas this information is limited to a single coordinate for points, a curve representation of a river centerline can be used to derive important information on the hydromorphological quality of a river, most notably the river sinuosity (Karrasch et al. Citation2015). The longitudinal profile of a river can be derived, if three-dimensional coordinates are provided. In the case of a surface representation of a river, it is possible to measure the river width and its variation (Karrasch and Hunger Citation2016). Moreover, the river centerline and the structure of the riverbank line can be extracted. Considering a continuous representation of a river, such as extracted from remote sensing imagery, radiometric information can be used to estimate certain bio-chemical characteristics, such as phytoplankton and water clarity (Olmanson, Brezonik, and Bauer Citation2013). In addition to feature objects directly representing the water body, features in its direct proximity provide information about environmental conditions that potentially affect the water quality. For example, land use or land cover information gives indications on the quality and quantity of pollutant entries, for example from agriculture or mining industries (Smith and Owens Citation2014).
If multiple input features are selected, either within or across spatial datasets, there are two options for further processing. First, the analysis processes described above can be applied either sequentially or in parallel to the selected features; second, the combination of selected features can exploit relationships between them. This is exemplarily shown in , with the identification of suitable processes again relying on the spatial representation of input features.
Table 1. Example processes suitable for the combination of two features depending on their spatial representation.
Beside the spatial representation, the semantics of the input data ultimately determines the meaningfulness of a combined analysis. This is demonstrated by Stasch et al. (Citation2014) for the applicability of geostatistical analysis processes depending on the inherent characteristics of a represented phenomenon. In Scheider and Tomko (Citation2016), this is solved by comprehensive semantic annotations that are used to reason on the applicability of certain operations. Accordingly, semantic information plays a decisive role, for example, for identifying the kind of phenomenon (e.g. river, pipeline, center or flow line), the underlying representational model (invariant/object or continuous/field), the applied attribute value scales (nominal, ordinal, interval or ratio) or the kind of measurement (discrete or integral). However, explicit formalized semantics are rarely found for existing spatial datasets; it still lacks consolidated description formalisms and encoding mechanisms for these semantic aspects. The same applies to the description and handling of spatial and thematic accuracies, especially on the feature level. This leaves a certain degree of responsibility for the selection of appropriate data and processes as well as for the interpretation of the results to the user.
For the combination of spatial data on water body structures, there are a number of frequently used processes relevant to the quantification and assessment of quality characteristics. Distance measurements are quite common, for example, between a river and a source for environmental pollution in order to estimate its potential to have an impact on the water quality. Others are the measurement of the topological relationship between features, which for example can select objects affected by a certain water level, or rather its surface representation, in a flood scenario. A combination of features with raster data from remote sensing can be applied to determine certain characteristics of the water body based on their particular spectral signature. The combination with digital elevation models is of particular interest to derive longitudinal profiles, catchment areas or objects prone to flooding. If the input data represent the same phenomenon at different timestamps, a change detection can be conducted for multi-temporal analysis, for example, of the area covered by water or the surrounding land cover types. This may as well be done for more than two inputs, which can provide valuable insights into the spatiotemporal dynamics and variability of water body structures (Karrasch et al. Citation2015).
In comparison to administrative and remote sensing data sources, the majority of citizen science data is characterized as irregularly distributed point-based observations addressing specific aspects of a water body and its surrounding area. This may include width and water level measurements, the sighting of a certain species, a classification of surrounding land use or potential floating thrash. Depending on its quality and information content, citizen science data can be used to complement and validate existing data sources. As an example, Comber et al. (Citation2013) report on the successful application of citizen science in a comprehensive ground truthing campaign for land cover data.
In summary, capabilities for both the analysis and the combination of data are required in order to achieve a comprehensive view on a targeted feature, that is, a water body, including its current, past and potential future state. Whereas the analysis primarily addresses the processing of inherent characteristics of a feature, such as its geometry and thematic properties, the comparison exploits existing relationships to other features, either within or across datasets. Thus, the overall workflow to be implemented consists of four steps ():
The selection of input features (≥1) by the user.
The identification of suitable processes for further processing.
The selection and parametrization of a desired process.
The execution of that process.
Figure 2. Schematic workflow for the analysis and combination of spatial data.
3.3. Data and operation constraints
Upon the selection of input data by the user, suitable operations for further processing should be identified in order to assist the user. This suggestion system can utilize data and operation constraints, which are specified by an operation description. In order to successfully perform an operation, all relevant constraints must be fulfilled. Data constraints can be evaluated based on the metadata of inputs during workflow composition or based on the actual feature objects at runtime. Examples for the first are constraints on the data domain, the data and geometry type, the spatial reference system or the spatiotemporal extent. The latter includes required computational resources, processing timeouts or the structural consistency of input data. However, whereas metadata constraints can be evaluated upon workflow creation and accordingly be addressed by user interaction, violations of a runtime constraint are hard to mitigate and ultimately result in the termination of the workflow. On the other side, operation constraints can be specified to define required input states or processing environments that are required by certain operations. Those can also be evaluated either during workflow composition, for example, based on a set of input metadata elements, or during workflow execution, for example, based on specified computational resources or processing timeouts. For the first type of constraints, that is, constraints that can be evaluated during workflow composition, a rule-based formalism and common examples are described by Hofer et al. (Citation2017a), but are not yet implemented.
For service-based spatial data processing using the WPS standard, a number of data constraints can already be evaluated based on the mandatory process description document, including the number, cardinality and size of inputs as well as the range of supported data formats. However, the default description does neither address relationships between inputs nor semantic restrictions. Therefore, we propose to express additional constraints within the generic profile of a process, which can be referenced by the process description (Müller Citation2015; OGC Citation2015). Whereas a generic WPS client would simply ignore that profile, a profile-aware client is able to parse, interpret and evaluate data and operation constraints formulated therein. A corresponding example, specifying the need for a shared spatial extent of inputs in a feature matching process, is shown in . It specifies a condition (overlap) that must be evaluated and a subject (bounding box), for which the condition must hold true to satisfy the constraint. To facilitate usability and interoperability, each definition and term links to a corresponding Semantic Web description. As shown by Hofer, Papadakis, and Mäs (Citation2017b), such descriptions can later be exploited for the interactive search and suggestion of required operations during workflow creation.
Listing 1. Generalized process description example with constraint on a shared spatial extent.
3.4. Application patterns for geoprocessing on the web
In addition to geoprocessing services offering generic or specific functionality on the web, geoprocessing patterns can be used to describe more abstract application-oriented workflows, that is, a meaningful orchestration of services (Brauner Citation2015; Wiemann Citation2017). If applied on the web, they combine a human-readable description of a domain-specific problem to be solved with a workflow composed of links to an underlying service infrastructure (). In the first instance, those links point at process descriptions that need to be resolved into processing services upon execution of the pattern by a service orchestration engine. There are two ways to do this: first, a process description can directly link to an implementing service instance; second, a well-defined description of both interface and functionality, such as proposed by Fitzner, Hoffmann, and Klien (Citation2011)and Müller (Citation2015), can be used to find and bind suitable implementing services within a processing service registry. However, the reproducibility of results, for both single services and patterns, must be assured by either formal specification (Fitzner, Hoffmann, and Klien Citation2011) or convention (Müller Citation2015). The creation of processing patterns requires extensive domain knowledge and is thus a task for domain experts. Following the descriptions of Brauner (Citation2015) and Wiemann (Citation2017), typical characteristics of a geoprocessing pattern on top of a service infrastructure can be summarized as follows:
The behavior is similar to high-level services, with the exception that it is not an instance, but a description of a processing workflow; accordingly it does not depend on actual processing capabilities of its creator or provider.
For the creation, registration, search and invocation of a geoprocessing pattern, a standardized set of metadata elements is required to describe its functional principle as well as constraints on the data inputs and outputs.
Each pattern may include other patterns in order to solve well-defined domain-specific subtasks; generic patters are not excluded per se, but are not expected to be of use to domain users.
It can be exchanged across the network and executed by a workflow engine at an appropriate position, for example, close to the input data (moving code) or close to the referenced processing services (moving data).
For each task, a range of applicable patterns may exist, each with different advantages and disadvantages; a user rating of a pattern should be based on its performance and its appropriateness with respect to previous applications of that pattern.
It must be subject to regular functional evaluations, with particular focus on the availability and accessibility of underlying service instances.
Figure 3. Creation and application of domain (geo)processing patterns.
Since the external view on a pattern is similar to that on a geoprocessing service, it is reasonable to assume that a similar description, that is, the same set of metadata elements and profiles described in the previous section, can be applied. However, additional elements are required to describe workflow components and interactions. To allow for a standardized description, encoding, exchange and interpretation of the workflow encapsulated by a geoprocessing pattern, it is appropriate to apply a workflow description language for this purpose. At this point, the use of the Business Process Model and Notation (BPMN) standard is suggested, because it specifies both a human-readable graphical representation and a machine-readable XML encoding. However, upon invocation of the workflow this only applies with the restriction of a customized BPMN engine required to support the invocation of OGC web services (Meek, Jackson, and Leibovici Citation2016; Wiemann Citation2017).
To illustrate the structure and application of geoprocessing patterns, shows an example related to the determination of water body structures. It shows three different patterns for the same objective, which is the estimation of a river surface representation from either remote sensing imagery, the river centerline or both. To achieve this, a number of generic and domain-specific processing services are selected and composed into meaningful workflows. As can be seen from the figure, a data constraint on the spatial representation of input data decides on the applicability of a certain pattern. Moreover, the process constraint on a shared spatial extent described in can be applied to the second pattern, as it should take two spatially overlapping data inputs.
Figure 4. Three different geoprocessing patterns for the estimation of a river surface based on different inputs.
4. Implementation and application of the information system
As a proof-of-concept, the core of the information system has been implemented in support for the ad hoc analysis and combination of spatial data on the web.Footnote3 It primarily uses OGC standards for client–service and service–service communication and, thus, aligns with current SDI developments. However, due to the current lack of available and accessible spatial data and, in particular, geoprocessing services on the web, a testing environment has been set up, comprising a number of useful services with respect to the application scenario. The Free State of Saxony in Germany was selected as a test area, due to a number of readily available spatial data services and datasets related to the quality of water bodies. The following datasets are registered in the client for visual analysis and potential further processing:
Environmental data provided by the LfULG (Saxon State Office for Environment, Agriculture and Geology); it comprising WFS data for major catchment areas, river geometries and areas prone to flooding as well as an existing official classification for water body structures dated 2007, which was downloaded and set up as a WFS using GeoServer.Footnote4
Data from land surveying, including a digital elevation model at a resolution of 5 m and a number of orthoimages, both obtained from the GeoSN (Saxon State Office for Land Surveying) and set up as a WCS using Geoserver.
Preprocessed remote sensing data collected by the LANDSAT satellite system (cf. Karrasch et al. Citation2015) as well as CORINE Land Cover data provided by the Copernicus Programme, both set up as a WCS again using Geoserver.
Field observations for certain biological, hydromorphological and physicochemical parameters describing the quality of water bodies collected by school classes in the course of the citizen science project COBWEB (Citizen Observatory Web, Higgins et al. Citation2016).
Data collected by volunteers contributing to the OpenStreetMapFootnote5 project are obtained via the Overpass API, which provides read-only access to the database together with a custom query language; the Overpass API is a prominent example for open, well-established, but non-standardized interface specifications frequently applied on the web.
In addition to the spatial data services set up to test and evaluate the information system, geoprocessing capabilities are required to facilitate the ad hoc analysis and combination of the provided spatial data. Thus, a number of geoprocessing services are registered:
The demonstration instance of the 52n WPS frameworkFootnote6 offers basic geoprocessing functionality to the system; the service provides a number of basic operations, for example, buffer and coordinate transformation, as well as processes from GRASS GIS and the SEXTANTE library, which are encapsulated by the WPS framework.
Existing functionality for the matching and fusion of spatial data developed in Wiemann and Bernard (Citation2016) is reused and set up as geoprocessing services using the 52n WPS framework.
In order to address domain-specific functionality, a number of processes related to the quality of water bodies are developed and provided via the WPS interface using again the 52n WPS framework; it comprises sinuosity measurements (cf. Karrasch et al. Citation2015) and the determination of the chemical status of a waterbody based on the measurement of relevant substances.
In addition to the above mentioned spatial data and geoprocessing services, there are three further components of the information system ():
The pattern registry is a website that provides the capabilities to upload, search and download geoprocessing patterns; each pattern is composed of a process description, which basically follows the WPS process description document, and a BPMN file with a formal description of the pattern workflow; single workflow components are directly linked to implementing WPS instances.
An orchestration service is used to execute the geoprocessing patterns; it parses the BPMN workflow description, composes the required processing service instances, executes the workflow and finally returns the result; the service offers a WPS interface and is implemented using the 52n WPS framework.
The client application is the main entry point for users interested in the determination of the quality of water bodies and supports the visualization and the retrieval of spatial data via OGC services; the client is connected to the pattern registry and the orchestration service and thus allows for the execution of previously designed geoprocessing patterns.
Figure 5. Main components of the implemented information system.
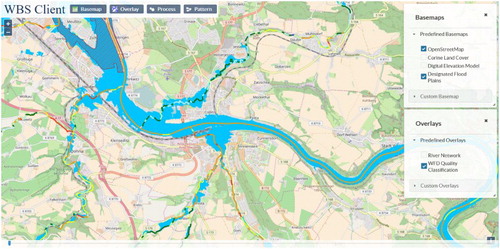
When accessing the web client application (), a basemap is shown for orientation. Additional overlays can be selected by the user as input for geoprocessing. Therefore, spatial data services are selected from either the initial list of data services registered to the client or a user-defined WFS service endpoint. Moreover, additional WPS instances and processing patterns can be registered to broaden the range of available functionality. However, only such processes and patterns are shown that fulfill the constraints set by the selected input data, for example, concerning the number, format or spatial representation.
Figure 6. Screenshot of the web client application.
Upon selection of a process or pattern by the user, a pop-up window is used to parameterize the process or pattern respectively. Whereas feature inputs are chosen from the active map overlays, literal inputs are separately listed and requested from the user. Subsequently, processes can be invoked and patterns be sent to the connected orchestration engine. The results of a process are temporarily stored on the application server. It can be added as an overlay and accordingly be used for visualization and further processing. If the result is no feature data, for example, in the case of literal outputs, or feature relations, they are provided as downloads.
4.1. Application for the determination of water body structures
The goal of the developed information system is to support users in fulfilling their particular information needs with respect to the characterization of water bodies. The offered processes and patterns essentially depend on the number and type of datasets selected by the user. Thus, if all data and operation constraints of a process or pattern are fulfilled by the user’s data selection, it is offered for execution. Hereinafter, an application is described for each of the stakeholder groups shown in : the governmental authority, the decision maker and the regular citizen.
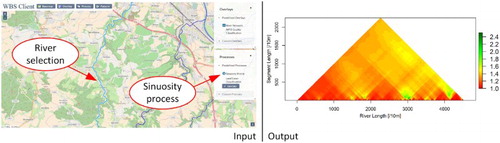
The first application targets at governmental authorities with reporting obligations on the ecological quality of water bodies, for example, in the context of the EU WFD. The determination of the river sinuosity, basically an indicator on its curvature dividing the curve length by the basis length, is chosen as an important hydromorphological parameter with significant influence on the potential biological status of a river. The implemented sinuosity process takes a single geometry, that is, the spatial representation of a river, as input and returns information on the sinuosity for each point on the line considering various possible segment lengths (Karrasch et al. Citation2015). Thus, technically, the process is only constrained by the selection of at least one feature with linear geometry type. The service response contains a link to the result image, which can be downloaded and used for a detailed inspection and interpretation of the river sinuosity. The corresponding inputs and output of the application are depicted in .
Figure 7. Inputs and output of the sinuosity measurement process.
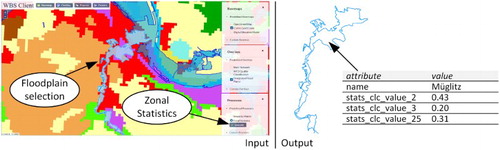
The second application is targeted on decision makers dealing with information on urban areas potentially affected by flood events. This could be used, for example, for the estimation of real estate values or insurance rates in areas prone to flooding. As input data, existing flood plains for each river are taken and combined with CORINE Land Cover data. For that purpose, a computation of the zonal statistics is conducted for each flood plain and appended as attributes to the original dataset. The result accordingly contains the number of pixels contained by a flood plain for each of the CORINE classes. The result is returned to the user for visualization and further analysis. The respective inputs and the schematic output are shown in . Technically, the zonal statistics process is offered to a user, if at least one vector feature with polygon geometry type and one raster dataset are selected.
Figure 8. Inputs and schematic output of the zonal statistics process.
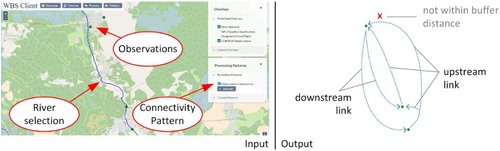
The third application addresses regular citizens taking observations alongside a certain river, which are interested in comparing related observations. Therefore, a geoprocessing pattern with four consecutive processes is designed: first, the considered river is selected by a closest distance operation; second, a buffer is calculated around the river centerline; third, all observations within that buffer are assigned to the corresponding river; and fourth, each observation is connected with available upstream and downstream observations. Those links are appended as attributes and can be used to traverse and compare observations alongside the selected river. The pattern is offered, if a river network, that is, a set of directed linear geometries, and a set of point-based observations is selected by a user. A schematic output for a river network and a number of sampled observations is depicted in .
Figure 9. Inputs and schematic output of the connectivity analysis for observations.
The conceptualized and implemented process suggestion system is primarily based on specified data and process constraints, which are embedded in processing profiles. This combination is considered a good starting point for the further development and provision of a harmonized set of process descriptions, in particular for workflow composition. The development of geoprocessing patterns complements this approach by providing an additional abstraction to complex application-oriented workflows. In the current stage of development, the application has been tested by a number of domain experts in a controlled environment. However, it is planned to open the application to a broader audience to facilitate the analysis and combination of spatial data on the web, with particular focus on the monitoring of the ecological quality of water bodies.
5. Conclusion
The information system developed in this article provides the opportunity to achieve a comprehensive view on a spatial domain, with particular focus on water quality. It does not only represent an approach to access the wealth of spatial data on the web, but also provides capabilities to derive actual information from that data. It allows for the integration of distributed spatial data and geoprocessing services in an ad hoc manner, without the need for comprehensive GIS knowledge and resources. The generic infrastructure can be adopted to serve other domains for the general validation, enrichment and combination of spatial data on the web.
Whereas the collection of appropriate spatial data within a domain is already well-supported by existing SDI, capabilities for geoprocessing still need to be enhanced. This particularly addresses the semantic description of data and processes, which play a significant role in the determination and composition of suitable processing workflows. In the presented approach, a significant proportion of the required logic is implemented by domain experts creating domain-specific geoprocessing patterns based on a number of underlying processing services. Thus, a regular user familiar with the domain is still capable to perform more or less complex workflows. However, future work should not only focus on additional geoprocessing functionality, but also on the creation and description of reasonable geoprocessing patterns that provide well-established and frequently applied functionality to a larger group of users. Once a sufficient number of patterns are available, a rating mechanism seems reasonable to further specify their applicability for a specific problem. Moreover, a number of benchmarks should be established to regularly test the accessibility, performance and quality of existing processes and patterns.
The current prototype focuses on a small geographic area with a good data coverage. However, to be universally applicable, and ultimately support the determination of global water quality indices for the evaluation of the UN SDGs, an extension to other areas with less data coverage is intended. This especially requires approaches to derive the same information from a wide range of different data sources. This also poses additional challenges for the valorization of citizen support on the technical, organizational, legal and social level.
Disclosure statement
No potential conflict of interest was reported by the authors.
ORCID
Stefan Wiemann http://orcid.org/0000-0002-3937-7927
Pierre Karrasch http://orcid.org/0000-0001-5285-8920
Lars Bernard http://orcid.org/0000-0002-3085-7457
Additional information
Funding
Notes
1. Directive 2000/60/EC of the European Parliament and of the Council of 23 October 2000 establishing a framework for Community action in the field of water policy.
2. Federal Water Pollution Control Act, 33 U.S.C. 1251 et seq.
6. http://geoprocessing.demo.52north.org/latest-wps/WebProcessingService (WPS endpoint)
References
- Bensmann, Felix, Dorian Alcacer-Labrador, Dennis Ziegenhagen, and Rainer Roosmann. 2014. “The RichWPS Environment for Orchestration.” ISPRS International Journal of Geo-Information 3 (4): 1334–1351. Multidisciplinary Digital Publishing Institute. doi:10.3390/ijgi3041334.
- Bernard, Lars, Stephan Mäs, Matthias Müller, Christin Henzen, and Johannes Brauner. 2014. “Scientific Geodata Infrastructures: Challenges, Approaches and Directions.” International Journal of Digital Earth 7 (7): 613–633. doi:10.1080/17538947.2013.781244.
- Blöschl, G., A. Viglione, and A. Montanari. 2013. “Emerging Approaches to Hydrological Risk Management in a Changing World.” Climate Vulnerability 22: 3–10. Elsevier. doi:10.1016/B978-0-12-384703-4.00505-0.
- Brauner, Johannes. 2015. Formalizations for Geooperators-Geoprocessing in Spatial Data Infrastructures. Technische Universität Dresden. http://www.qucosa.de/recherche/frontdoor/?tx_slubopus4frontend[id]=18250].
- Brauner, Johannes, Theodor Foerster, Bastian Schaeffer, and Bastian Baranski. 2009. “Towards a Research Agenda for Geoprocessing Services.” Paper presented at the 12th AGILE international conference on geographic information science, 1–12. http://plone.itc.nl/agile_old/Conference/2009-hannover/pdfs/124.pdf.
- Buytaert, Wouter, Zed Zulkafli, Sam Grainger, Luis Acosta, Tilashwork C. Alemie, Johan Bastiaensen, Bert De Bièvre, et al. 2014. “Citizen Science in Hydrology and Water Resources: Opportunities for Knowledge Generation, Ecosystem Service Management, and Sustainable Development.” Frontiers in Earth Science 2 (October): 1–21. doi:10.3389/feart.2014.00026.
- Comber, Alexis, Linda See, Steffen Fritz, Marijn Van der Velde, Christoph Perger, and Giles Foody. 2013. “Using Control Data to Determine the Reliability of Volunteered Geographic Information about Land Cover.” International Journal of Applied Earth Observation and Geoinformation 23 (1): 37–48. Elsevier B.V. doi:10.1016/j.jag.2012.11.002.
- Craglia, Max, Kees de Bie, Davina Jackson, Martino Pesaresi, Gábor Remetey-Fülöpp, Changlin Wang, Alessandro Annoni, et al. 2012. “Digital Earth 2020: Towards the Vision for the Next Decade.” International Journal of Digital Earth 5 (1): 4–21. doi:10.1080/17538947.2011.638500.
- Demarchi, Luca, Simone Bizzi, and Hervé Piégay. 2016. “Hierarchical Object-Based Mapping of Riverscape Units and in-Stream Mesohabitats Using LiDAR and VHR Imagery.” Remote Sensing 8 (2). doi:10.3390/rs8020097.
- Disse, Markus, and Heinz Engel. 2001. “Flood Events in the Rhine Basin: Genesis, Influences and Mitigation.” Natural Hazards 23 (2/3): 271–290. doi:10.1023/A:1011142402374.
- Dworak, Thomas, Catherine Gonzalez, Cornelius Laaser, and Eduard Interwies. 2005. “The Need for New Monitoring Tools to Implement the WFD.” Environmental Science & Policy 8 (3): 301–306. doi:10.1016/j.envsci.2005.03.007.
- Economic and Social Council. 2015. Report of the Inter-Agency and Expert Group on Sustainable Development Goal Indicators. UN Economic and Social Council, report nr. E/CN.3/2016/2. https://unstats.un.org/unsd/statcom/47th-session/documents/2016-2-IAEG-SDGs-E.pdf.
- Fitzner, Daniel, Jörg Hoffmann, and Eva Klien. 2011. “Functional Description of Geoprocessing Services as Conjunctive Datalog Queries.” GeoInformatica 15 (1): 191–221. doi:10.1007/s10707-009-0093-4.
- Friis-Christensen, Anders, Nicole Ostländer, Michael Lutz, and Lars Bernard. 2007. “Designing Service Architectures for Distributed Geoprocessing: Challenges and Future Directions.” Transactions in GIS 11 (6): 799–818. doi:10.1111/j.1467-9671.2007.01075.x.
- Goodchild, Michael F. 2007. “Citizens as Sensors: The World of Volunteered Geography.” GeoJournal 69 (4): 211–221. doi:10.1007/s10708-007-9111-y.
- Goodchild, M. F., H. Guo, A. Annoni, L. Bian, K. de Bie, F. Campbell, M. Craglia, et al. 2012. “Next-Generation Digital Earth.” Proceedings of the National Academy of Sciences 109 (28): 11088–11094. doi:10.1073/pnas.1202383109.
- Higgins, Christopher I, Jamie Williams, Didier G Leibovici, Ingo Simonis, Mason J. Davis, C. Muldoon, Paul van Genuchten, Gregory O’Hare, and Stefan Wiemann. 2016. “Citizen OBservatory WEB (COBWEB): A Generic Infrastructure Platform to Facilitate the Collection of Citizen Science Data for Environmental Monitoring.” International Journal of Spatial Data Infrastructures Research 11: 20–48. doi:10.2902/1725-0463.2016.11.art3.
- Hinz, Matthias, Daniel Nüst, Benjamin Proß, and Edzer Pebesma. 2013. “Spatial Statistics on the Geospatial Web.” 16th AGILE conference on geographic information science, Leuven, May 14–17.
- Hofer, Barbara. 2015. “Uses of Online Geoprocessing Technology in Analyses and Case Studies: A Systematic Analysis of Literature.” International Journal of Digital Earth 8 (11): 901–917. doi:10.1080/17538947.2014.962632.
- Hofer, Barbara, Stephan Mäs, Johannes Brauner, and Lars Bernard. 2017a. “Towards a Knowledge Base to Support Geoprocessing Workflow Development.” International Journal of Geographical Information Science 31 (4): 694–716. Taylor & Francis. doi:10.1080/13658816.2016.1227441.
- Hofer, Barbara, Emmanuel Papadakis, and Stephan Mäs. 2017b. “Coupling Knowledge with GIS Operations: The Benefits of Extended Operation Descriptions.” ISPRS International Journal of Geo-Information 6 (2): 40. doi:10.3390/ijgi6020040.
- Hooijer, Aljosja, Frans Klijn, G. Bas, M. Pedroli, and Ad G. Van Os. 2004. “Towards Sustainable Flood Risk Management in the Rhine and Meuse River Basins: Synopsis of the Findings of IRMA-SPONGE.” River Research and Applications 20 (3): 343–357. doi:10.1002/rra.781.
- Karrasch, Pierre, Daniel Henzen, Sebastian Hunger, and Max Hörold. 2015. “Determination of Water Body Structures for Small Rivers Using Remote Sensing Data.” In Remote Sensing for Agriculture, Ecosystems, and Hydrology XVII, edited by Christopher M. U. Neale and Antonino Maltese, 9637:96370W. Proceedings of SPIE. doi:10.1117/12.2194891.
- Karrasch, Pierre, and Sebastian Hunger. 2016. “Determination of Bank Structures and River Width Variations Using Remote Sensing Data.” In SPIE 9998, Remote Sensing for Agriculture, Ecosystems, and Hydrology XVIII, edited by Christopher M. U. Neale and Antonino Maltese. doi:10.1117/12.2239943.
- Kiehle, Christian, Klaus Greve, and Christian Heier. 2007. “Requirements for Next Generation Spatial Data Infrastructures-Standardized Web Based Geoprocessing and Web Service Orchestration.” Transactions in GIS 11 (6): 819–834. doi:10.1111/j.1467-9671.2007.01076.x.
- Klemenjak, Sascha, Björn Waske, Silvia Valero, and Jocelyn Chanussot. 2012. “Automatic Detection of Rivers in High-Resolution SAR Data.” IEEE Journal of Selected Topics in Applied Earth Observations and Remote Sensing 5 (5): 1364–1372. doi:10.1109/JSTARS.2012.2189099.
- Lanig, Sandra, Arne Schilling, Beate Stollberg, and Alexander Zipf. 2008. “Towards Standards-Based Processing of Digital Elevation Models for Grid Computing through Web Processing Service (WPS).” Lecture Notes in Computer Science (Including Subseries Lecture Notes in Artificial Intelligence and Lecture Notes in Bioinformatics), 5073 LNCS:191–203. Lecture Notes in Computer Science. Springer Berlin Heidelberg. doi:10.1007/978-3-540-69848-7_17.
- Lowry, Christopher S., and Michael N. Fienen. 2013. “CrowdHydrology: Crowdsourcing Hydrologic Data and Engaging Citizen Scientists.” Ground Water 51 (1): 151–156. doi:10.1111/j.1745-6584.2012.00956.x.
- Meek, Sam, Mike Jackson, and Didier G. Leibovici. 2016. “A BPMN Solution for Chaining OGC Services to Quality Assure Location-Based Crowdsourced Data.” Computers & Geosciences 87 (February): 76–83. doi:10.1016/j.cageo.2015.12.003.
- Müller, Matthias. 2015. “Hierarchical Profiling of Geoprocessing Services.” Computers & Geosciences 82: 68–77. doi:10.1016/j.cageo.2015.05.017.
- Müller, Matthias, Lars Bernard, and Johannes Brauner. 2010. “Moving Code in Spatial Data Infrastructures – Web Service Based Deployment of Geoprocessing Algorithms.” Transactions in GIS 14 (Suppl 1): 101–118. doi:10.1111/j.1467-9671.2010.01205.x.
- de Nooij, R. J. W., H. J. R. Lenders, R. S. E. W. Leuven, G. de Blust, N. Geilen, B. Goldschmidt, S. Muller, I. Poudevigne, and P. H. Nienhuis. 2004. “BIO-SAFE: Assessing the Impact of Physical Reconstruction on Protected and Endangered Species.” River Research and Applications 20 (3): 299–313. doi:10.1002/rra.779.
- OGC. 2015. “OGC WPS 2.0 Interface Standard.” Open Geospatial Consortium. http://docs.opengeospatial.org/is/14-065/14-065.html.
- Olmanson, Leif G., Patrick L. Brezonik, and Marvin E. Bauer. 2013. “Airborne Hyperspectral Remote Sensing to Assess Spatial Distribution of Water Quality Characteristics in Large Rivers: The Mississippi River and Its Tributaries in Minnesota.” Remote Sensing of Environment 130 (March): 254–265. Elsevier Inc. doi:10.1016/j.rse.2012.11.023.
- Palmer, Stephanie C. J., Tiit Kutser, and Peter D. Hunter. 2015. “Remote Sensing of Inland Waters: Challenges, Progress and Future Directions.” Remote Sensing of Environment 157 (February): 1–8. Elsevier Inc. doi:10.1016/j.rse.2014.09.021.
- Pedroli, Bas, Geert de Blust, Kris van Looy, and Sabine van Rooij. 2002. “Setting Targets in Strategies for River Restoration.” Landscape Ecology 17 (Suppl. 1): 5–18. doi:10.1023/A:1015221425315.
- Raven, P. J., N. T. H. Holmes, P. Charrier, F. H. Dawson, M. Naura, and P. J. Boon. 2002. “Towards a Harmonized Approach for Hydromorphological Assessment of Rivers in Europe: A Qualitative Comparison of Three Survey Methods.” Aquatic Conservation: Marine and Freshwater Ecosystems 12 (4): 405–424. doi:10.1002/aqc.536.
- Reinhardt, Christian, Jens Bölscher, Achim Schulte, and Robert Wenzel. 2011. “Decentralised Water Retention along the River Channels in a Mesoscale Catchment in South-Eastern Germany.” Physics and Chemistry of the Earth 36 (7–8): 309–318. Elsevier Ltd. doi:10.1016/j.pce.2011.01.012.
- Schaeffer, B. A., K. G. Schaeffer, D. Keith, R. S. Lunetta, R. Conmy, and R. W. Gould. 2013. “Barriers to Adopting Satellite Remote Sensing for Water Quality Management.” International Journal of Remote Sensing 34 (21): 7534–7544. Taylor & Francis. doi:10.1080/01431161.2013.823524.
- Scheider, Simon, and Martin Tomko. 2016. “Knowing Whether Spatio-Temporal Analysis Procedures Are Applicable to Datasets.” Frontiers in Artificial Intelligence and Applications 283: 67–80. doi:10.3233/978-1-61499-660-6-67.
- Šípek, Václav, Milada Matoušková, and Martin Dvořák. 2010. “Comparative Analysis of Selected Hydromorphological Assessment Methods.” Environmental Monitoring and Assessment 169 (1): 309–319. doi:10.1007/s10661-009-1172-6.
- Smith, Tyler B., and Philip N. Owens. 2014. “Individual and Cumulative Effects of Agriculture, Forestry and Metal Mining Activities on the Metal and Phosphorus Content of Fluvial Fine-Grained Sediment; Quesnel River Basin, British Columbia, Canada.” Science of The Total Environment 496 (October): 435–442. Elsevier B.V. doi:10.1016/j.scitotenv.2014.07.014.
- Stasch, Christoph, Simon Scheider, Edzer Pebesma, and Werner Kuhn. 2014. “Meaningful Spatial Prediction and Aggregation.” Environmental Modelling & Software 51: 149–165. Elsevier Ltd. doi:10.1016/j.envsoft.2013.09.006.
- Thieken, Annegret H., Sarah Kienzler, Heidi Kreibich, Christian Kuhlicke, Michael Kunz, Bernhard Mühr, Meike Müller, et al. 2016. “Review of the Flood Risk Management System in Germany after the Major Flood in 2013.” Ecology and Society 21 (2). art51. doi:10.5751/ES-08547-210251.
- Wiemann, Stefan. 2017. “Formalization and Web-Based Implementation of Spatial Data Fusion.” Computers & Geosciences 99 (February): 107–115. doi:10.1016/j.cageo.2016.10.014.
- Wiemann, Stefan, and Lars Bernard. 2016. “Spatial Data Fusion in Spatial Data Infrastructures Using Linked Data.” International Journal of Geographical Information Science 30 (4): 613–636. doi:10.1080/13658816.2015.1084420.