
ABSTRACT
Landsat data are the longest available records that consistently document global change. However, the extent and degree of cloud coverage typically determine its usability, especially in the tropics. In this study, scene-based metadata from the U.S. Geological Survey Landsat inventories, ten-day, monthly, seasonal, and annual acquisition probabilities (AP) of targeted images at various cloud coverage thresholds (10% to 100%) were statistically analyzed using available Landsat TM, ETM+, and OLI observations over mainland Southeast Asia (MSEA) from 1986 to 2015. Four significant results were found. First, the cumulative average acquisition probability of available Landsat observations over MSEA at the 30% cloud cover (CC) threshold was approximately 41.05%. Second, monthly and ten-day level probability statistics for the 30% CC threshold coincide with the temporal distribution of the dry and rainy seasons. This demonstrates that Landsat images acquired during the dry season satisfy the requirements needed for land cover monitoring. Third, differences in acquisition probabilities at the 30% CC threshold are different between the western and eastern regions of MSEA. Finally, the ability of TM, ETM+, and OLI to acquire high-quality imagery has gradually enhanced over time, especially during the dry season, along with consequently larger probabilities at lower CC thresholds.
1. Introduction
Mainland Southeast Asia (MSEA) has developed into a key area of geopolitical influence and geo-economic cooperation from a geopolinomical perspective. Since the 1990s, more than 30 bilateral and multilateral geopolinomical cooperative mechanisms, and sub-regional groupings, have been established amongst MSEA nations and contiguous regions (e.g. China and India), demonstrating that this region has perhaps the highest economic vigor worldwide. As a result, this area has undergone, and will continue to experience, extensive and rapid land cover and land use change in metropolitan centers, hinterlands, and borderlands. However, before addressing and analyzing land cover and land use changes, as well as its drivers, impacts, and resultant adaptations, it is necessary to evaluate the ‘observability’ of various types of remote sensing data, as well as their applicability and limitations, especially historical Landsat data.
Currently, remote sensing of land cover change involves the application of optical, microwave, radar, and LIDAR products, or combinations thereof (Aplin Citation2004). Of these, optical remote sensing data are the mostly commonly used, although they are usually contaminated by cloud cover (CC) and its shadows. Historical Landsat archive products, in particular Thematic Mapper (TM, 1982–2013), Enhanced Thematic Mapper Plus (ETM+, 1999-), and Operational Land Imager (OLI, 2013-), encompass the most appropriate and widely used optical satellite remote sensing data since the late 1980s for vegetation, land cover, and environmental monitoring (Hansen and Loveland Citation2012; Loveland and Dwyer Citation2012). Nevertheless, in the course of these data applications, the presence of CC and its shadows complicate data use (Zhu and Woodcock Citation2012), which is especially problematic when monitoring land cover and land use changes over large areas (Hansen and Loveland Citation2012), or monitoring global agricultural (Whitcraft et al. Citation2015), particularly in the tropics (Asner Citation2001). Recently, a few studies have shown that Landsat observations are only slightly cloud-contaminated during the MSEA dry season (Li et al. Citation2014), and the period controlled by the subtropical high-pressure belt in the subtropics (Li et al. Citation2016). MSEA, stretching across both tropical and subtropical zones in northern Myanmar, has experienced rapid and extensive land cover and land use changes driven by increasing geo-economic cooperation since the 1990s. However, one unanswered question is the amount of usable data for the past three decades with cloud coverage less than 10%, 20%, or 30% or thin CC (Liu et al. Citation2014) over this region from the Landsat family of sensors. Indeed, the issue of the ‘observability’ of Landsat-like optical data remains unaddressed globally (Goward et al. Citation2006; Sano et al. Citation2007), especially as an increasing amount of data becomes publicly available (Woodcock et al. Citation2008). Thus, statistical analyses of CC in Landsat historical archive data are fundamental prerequisite for monitoring patterns of regional land surface change in many parts of the world (Asner Citation2001). Such analyses have been reported for CC distribution in NOAA/AVHRR (Advanced Very High Resolution Radiometer) data globally (Stowe et al. Citation1991), probability of CC in TM and ETM+ data for the Amazon basin (Asner Citation2001; Sano et al. Citation2007), availability of cloud-free ETM+ data over the conterminous United States and globally (Ju and Roy Citation2008), global monthly probabilities of cloud-free Landsat TM and ETM+ observations during two epochs (Kovalskyy and Roy Citation2013), probability of MODIS data CC over global agricultural areas (Whitcraft et al. Citation2015), and Landsat-8 OLI only at country level (Laborde et al. Citation2017). However, cloud coverage analysis of all available Landsat data (TM, ETM+ and OLI in particular) has not been reported to date, especially for MSEA (including Yunnan Province, China); TM and ETM+ has not collected the theoretical number of images, despite the modern Landsat Global Archive Consolidation (LGAC) effort after 2010.
In this study, nearly three decades of Landsat-4/5/7/8 TM, ETM+, and OLI historical metadata (a total of 93,234 scenes) over MSEA were used to evaluate the ten-day, monthly, seasonal, and yearly availability of Landsat data, and the suitability and limitation for land cover changes studies. The objective of this study is twofold: (1) to understand the spatial and temporal differences in acquisition probability of Landsat TM, ETM+, and OLI observations with different CC thresholds in MSEA during the period 1986–2015 and; (2) to investigate the differences in performance in the acquisition for TM, ETM+ and OLI data. The results of this study will contribute to monitoring land surface changes and ecosystem dynamics based on the Landsat data source.
2. Materials and methods
2.1. Study area
In this study, MSEA refers to Cambodia, Laos, Myanmar, Thailand, Vietnam, and Yunnan Province, China () (Fox et al. Citation2012; Ziegler et al. Citation2009). MSEA is located to the southeast of ‘Chindia’ (Ramesh Citation2005), or the amalgamation of China and India, two emerging global economies. This region has a tropical monsoonal climate encompassing a distinct dry season (from November to April) and a dramatic rainy season (from May to October) due to the seasonal changes in monsoonal circulation in wind direction. MSEA is also characterized by pronounced seasonality in temperature, rainfall, and dry spells (Chuan Citation2005). The mean monthly temperature of this region usually exceeds 10°C, with limited variance in mean yearly temperature, and the driest month generally has less than 60 mm precipitation. Landforms in MSEA include numerous large mountains, plateaus, and hills in the northern and northwestern regions, and alluvial plains and estuarine deltas in the southern and eastern coastal regions (Gupta Citation2005a).
Figure 1. Map to show the location of the study area and the 141 Landsat footprints (path/row) over MSEA and Yunnan Province, China.
The northern upland region of MSEA is dominated by natural forest cover (Corlett Citation2005), and was traditionally settled by a number of cross-border minority groups engaged in subsistence agriculture, for example, swidden, or rotational, farming (Li, Jiang, and Feng Citation2014). However, industrial tree plantations, including rubber, teak, and eucalyptus, as well as market-oriented crops, including tea, banana, sugar cane, and coffee, have been widely introduced and cultivated across this region in the last two decades (Corlett Citation2005). The southern and eastern coastal lowlands of MSEA are comprised of primary agricultural zones that are fed by five large rivers, the Irrawaddy, Nu-Salween, Lancang-Mekong, Ping-Chao Phraya, and Red (Gupta Citation2005b). This region is characterized by paddy rice agriculture and aquaculture (e.g. fish and shrimp), and contains major population centers, including the urban areas of Bangkok, Ho Chi Minh, Yangon, and Hanoi. Since the 1990s, a number of geo-economic cooperation mechanisms, including India’s Look East policy in 1991 (later changed to Act East policy in 2014) and the 1992 ‘Greater Mekong Subregion Cooperation’ mechanism (later updated to ‘Lancang-Mekong Cooperation’ in 2015), enacted among the five MSEA countries and China or India have accelerated land cover and land use changes across borderlands and hinterlands.
2.2. Landsat cloud coverage data and pre-processing
The Worldwide Reference System (WRS) is a global cataloging system for Landsat data. As Landsat 4, Landsat 5, Landsat 7 and Landsat 8 all follow the WRS-2, a total of 141 WRS-2 path-rows are required to fully cover MSEA (). Information on the percentage of cloud coverage in Landsat TM, ETM+, and OLI images for all path/row combinations over MSEA for 1986–2015 was freely acquired from the Landsat scene metadata inventory, the Landsat Bulk Metadata Service (http://landsat.usgs.gov//consumer.php). These metadata provide Landsat sensors (TM, ETM+, and OLI), acquisition dates, paths, rows, CC level (0–9), and the full CC in each scene (0–100%). The percentage of CC in the Landsat 4/5/7 scenes was calculated using the automatic cloud cover assessment (ACCA) algorithm (Irish Citation2000; Irish et al. Citation2006; Shao et al. Citation2017). The Landsat 8 cloud cover assessment (CCA) uses multiple algorithms to detect clouds in scene data (U.S. Geological Survey Citation2016). Currently, there are four CCA algorithms, including ACCA, See-5 CCA, Cirrus CCA, and Artificial Thermal ACCA.
In total, there were 93,234 scenes available over MSEA from 1986 to 2015, comprising 53,989 TM scenes (1986–2011), 31,033 ETM+ scenes (1999–2015), and 8212 OLI scenes (2013–2015). It should be noted that the Landsat 4/5 TM and Landsat 7 ETM+ sensors did not collect all images out of the US (including MSEA), despite the Landsat Global Archive Consolidation (LGAC) effort since 2010. The cloud coverage indicated in the Landsat metadata ranges from 0% to 100%, categorized into ten levels (0–9) at 10% intervals (Kontoes and Stakenborg Citation1990), where level 0 represents the full CC of a scene less than or equal to 10% (or 0% ≤ CC (or cloud cover) ≤ 10%), level 1 represents the range greater than 10%, but less than or equal to 20% (or 10% < CC ≤ 20%), and level 9 represents the final ten percent (or 90% < CC ≤ 100%). CC thresholds are referred to as 0%, 10% to 100% or level 0, level 1 to level 9 in this study.
2.3. Acquisition probability calculation of different CC thresholds
Acquisition probabilities per Landsat footprint (path/row, 141 in total) with different CC thresholds ranging from level 0 (or 0% ≤ CC ≤ 10%) to level 9 (or 90% < CC ≤ 100%) were calculated for all available Landsat observations over MSEA during 1986–2015. Cumulative average of acquisition probabilities at the 10%, 20%, and 30% CC thresholds were also calculated to display the differences in mean annual statistical results. Then, analogous calculation of acquisition probabilities was carried out at two levels: monthly and ten-day (early, mid, and late month) per Landsat footprint at the 30% CC threshold. Finally, the monthly acquisition probabilities for Landsat 4/5 TM, Landsat-7 ETM+ and Landsat-8 OLI sensors with different CC thresholds were calculated to compare seasonal (both dry and rainy season) differences among the three sensors. The seasonal and annual average acquisition probabilities were calculated based on the monthly results. In addition, the national and regional average acquisition probabilities were calculated based on the results of the Landsat footprints (path/row). All CC probabilities for certain targeted or successful acquisition dates were calculated using Equation (1) (Asner Citation2001), and all statistical analyses were computed using the Microsoft Visual Basic application. Metadata for cloud coverage from the 93,234 Landsat images and all derived results were spatially organized by path/row (e.g. 135/045) in the ArcGIS platform (Version 10.2).(1) where t denotes the different CC thresholds (i.e. from 0%, 10% to 100% or level 1, level 2 to level 9, as described above), m denotes the month (e.g. from January, February to December), y represents the year between 1986 and 2015,
denotes the number of targeted or successful acquisitions of various CC thresholds in a month per Landsat footprint (path/row), and N denotes the total number of Landsat observations in a month (m) between 1986 and 2015 or a Landsat footprint (141 path/row in total).
refers to the acquisition probability of targeted or successful acquisition of various CC thresholds in a month per Landsat footprint (path/row).
3. Results and discussion
3.1. Appropriate cloud coverage threshold determination for acquisition probability analysis
As noted, one important issue for using satellite images from optical sensors is the percentage of CC. In general, the less CC in an image, the more useful it will be for clearly and accurately monitoring land surface changes. Generally, previous studies have used a threshold less than or equal to 30% CC to ascertain usability of a scene (Asner Citation2001; Goward et al. Citation2006; Kontoes and Stakenborg Citation1990), although many recent works have used images with CC more than 30% (Potapov, Turubanova, and Hansen Citation2011; Potapov et al. Citation2012). Our statistical analysis ((a–c)) with the three thresholds of CC, for example, 10%, 20%, and 30%, showed that the cumulative average of acquisition probabilities of annual Landsat observations were approximately 22.73%, 32.69%, and 41.05% during 1986–2015, respectively. The annual coverage with the CC threshold of 30% in MSEA is much larger than the global estimate (only 37%) (Goward et al. Citation2006).
Figure 2. Yearly average of acquisition probabilities (AP) of Landsat historical data (93,234 scenes) over MSEA and Yunnan Province, China between 1986 and 2015, including data from TM, ETM+, and OLI sensors at 10%, 20%, and 30% CC thresholds.
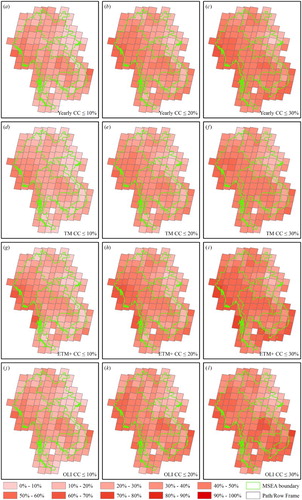
Next, from the perspective of each sensor, analogous statistical results were computed for TM ((d–f)), ETM+ ((g–i)), and OLI images ((j–l)) at the 10%, 20%, and 30% CC thresholds. In these cases, cumulative yearly average acquisition probabilities were 20.84%, 30.03%, and 37.69% for TM, 25.76%, 36.77%, and 46.39% for ETM+, and 24.21%, 35.40%, and 43.53% for OLI, respectively. The results showed that the Landsat-7 ETM+ sensor has the highest acquisition probability for good images for all 141 image footprints in MSEA, as reported in other studies (Ju and Roy Citation2008). This occurs because the cloud-avoidance strategy greatly reduces the incidence of cloudy ETM+ observations (NASA Goddard Space Flight Center Citation2011), while both TM and OLI do not. However, comparative analyses showed that the percentages of usable images (CC less than or equal to 30%) from TM and ETM+ in MSEA, a tropical region, are lower than global averages, or 52% and 57%, respectively (Goward et al. Citation2006). Furthermore, the permanent failure of the Scan Line Corrector (SLC) after 31 May 2003 significantly undermines the usability of Landsat ETM+ imagery.
Nevertheless, the amount of usable images from Landsat sensors at the 30% CC threshold have great potential for assessing annual land cover and land use changes in MSEA. Larger CC thresholds translate into higher acquisition probabilities; however, more cloud coverage implies the ineffectiveness of an image. This is corroborated by the several recent National Aeronautics and Space Administration (NASA) supported synthetic studies and regional initiative in South and Southeast Asia considering ongoing land cover and land use change (NASA Citation2015). As a great deal of efforts has been afforded to detecting clouds and cloud shadows (Irish et al. Citation2006; Zhu, Wang, and Woodcock Citation2015; Zhu and Woodcock Citation2012), acquisition probability analysis can contribute to the assessment of Landsat image usefulness, both spatially and temporally. In the following sections, the 30% CC threshold (0 ≤ CC ≤ 30) was used to analyze monthly, seasonal, and annual differences in acquisition probabilities at the footprint, country, and regional scales.
3.2. Spatio-temporal differences in average acquisition probability with a 30% cloud coverage threshold
3.2.1. Temporal comparison analysis
Latitudinally, MSEA comprises a small proportion of the northern subtropical region (northern Myanmar) as well as a vast part of the southern tropical region (Corlett Citation2005) with greater climate seasonality (Chuan Citation2005). Because of the environmental gradient, differential analyses of CC probabilities on a monthly basis aids in monitoring land surface changes, and especially for delineating vegetation dynamics with regards to phenology. Therefore, in this study, the 30% CC threshold was applied to determine the acquisition probability of Landsat imagery in the context of land cover changes and vegetation biophysical analyses. The results showed that the monthly probability variances of Landsat observations with a 30% or less CC threshold coincide well with the temporal division between dry and rainy season (). Indeed, the results also showed that Landsat has higher probabilities of acquiring high-quality images during the dry season, with a seasonal average of 60.40%. Specifically, the monthly acquisition probability averages were 66.74% in February, 64.00% in January, followed by 61.37% in March, 59.98% in December, 55.30% in November, and 54.99% in April. However, the related acquisition probabilities of all available Landsat images over MSEA from 1986 to 2015 declined sharply to a 21.27% average during the rainy season. Among them, the acquisition probabilities in four months were below the average level, 13.28% in July, 14.18% in August, 15.22% in June, and 18.95% in September, while both the beginning (May) and end (October) of the rainy season had larger average values, that is, 31.52% and 34.47%, respectively. also shows that either May or October act as a transition stage for cloud coverage changes in the shift between southwest and northeast monsoonal wind systems, or between the dry and rainy seasons. Furthermore, analogous statistical analyses over ten-day periods, or divided by early, mid, and late month, showed that these variations were minor within the dry or rainy season. However, seasonal variances of ten-day patterns of cloud coverage were just as clear as those in the monthly analysis (). It can be concluded that monthly differences of acquisition probability of Landsat historical data best reflect temporal changes.
Figure 3. Monthly average of AP of Landsat historical data (93,234 scenes) over MSEA and Yunnan Province, China between 1986 and 2015 at 30% or less CC thresholds.
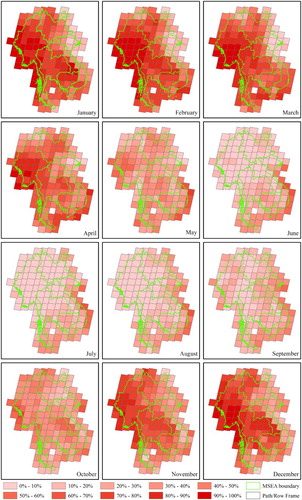
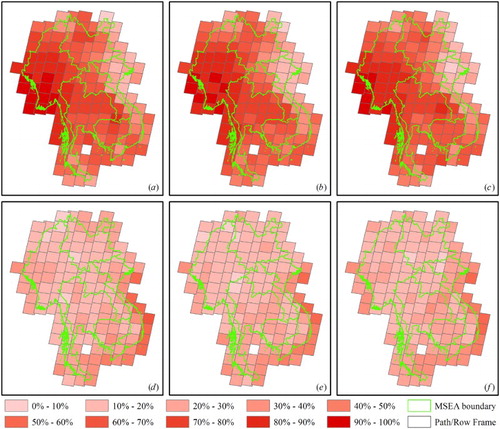
Figure 4. Differences in seasonal average of AP of Landsat historical data (93,234 scenes) over MSEA and Yunnan Province, China between 1986 and 2015 with 30% or less CC for a ten-day range during the dry season: (a) early month, (b) mid-month, and (c) late month, and during the rainy season: (d) early month, (e) mid-month, and (f) late month.
3.2.2. Spatial comparison analysis
Spatially, differences in Landsat acquisition probability between northern and southern MSEA at the 30% CC threshold were slight. However, differences were distinct between the western and eastern regions in both the dry and rainy season (), typically divided by the Annam Cordillera range in Indochina. The acquisition probabilities of Landsat footprints in the vast, western MSEA were much larger than those in the narrow, eastern coastal region during the dry season. The spatial differences were just the opposite during the peak (June, July, August, and September) rainy season. Because of the monsoon transitions in MSEA, the spatial variability of acquisition probability in May and October was unremarkable.
At national and regional scales, Myanmar, Thailand, and Cambodia had larger yearly average acquisition probabilities (over 40%) at the 30% CC threshold (), when compared to Laos (36.30%), Vietnam (35.46%), and Yunnan Province (31.89%). Seasonal variance comparisons showed that Myanmar had the largest percentage (76.27%) in the dry season and second smallest percentage (16.79%) in the rainy season in MSEA, while this relationship was reversed for Vietnam (42.76% and 27.94%) during the dry and rainy season, respectively. In addition, Thailand (67.91%), Cambodia (60.10%), and Laos (53.11%) all had higher acquisition probabilities, over 50%. The acquisition probabilities of the five countries and Yunnan province ranged from 15.45% (Yunnan) to 27.94% (Vietnam) during the rainy season. The cloud-avoidance strategy of the Landsat-7/8 Long Term Acquisition Plan (LTAP) may well explain the spatial differences, because coastal areas, such as Vietnam’s long coastal zone, that are known for increased CC are not collected, and may influence the number of scenes that can be acquired. The ratio of acquisition probabilities between the dry and rainy season ranged from about twofold for Vietnam, threefold for Thailand, Cambodia, Laos, and Yunnan, up to five-fold for Myanmar. The national and regional differences in acquisition probabilities have similar trends for each sensor (TM, ETM+ and OLI, ). However, the acquisition probabilities simultaneously increased for both the dry and rainy season from Landsat TM and its successors with declining seasonal ratios. There, Landsat TM, ETM+, and OLI images acquired during 1986–2015 are more capable of monitoring land surface biophysical changes in Myanmar than Vietnam, especially within the dry season.
Figure 5. National and regional differences in seasonal and annual average of AP at 30% or less CC threshold for all Landsat scenes during the dry and rainy seasons. KHM: Cambodia; LAO: Laos; MMR: Myanmar; THA: Thailand; VNM: Vietnam; and YN (CHN): Yunnan Province, China.
3.3. Average acquisition probability differences among TM, ETM+, and OLI sensors with the 30% cloud coverage threshold
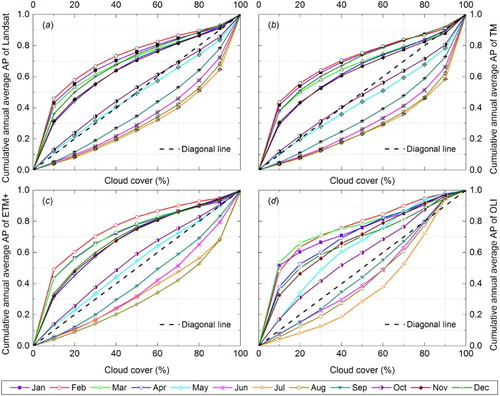
To understand the effects of increasing CC thresholds on average probability, the total dataset of Landsat images, as well as those from TM, ETM+, and OLI were further analyzed. The results showed that the average monthly probability curves plotted with increasing CC thresholds conform to a ‘shuttle’ shape ((a–d)). This demonstrates that the chances of positive acquisition during the four months (December to March) of the dry season increased significantly, while the corresponding probabilities decreased between June and September. The highest probability of positive Landsat image acquisition during the dry season occurred in February, followed by January, March, and December, while both the beginning (November) and end (April) of the dry season had similarly low probabilities (the lowest in the period). In the rainy season, July had the lowest probability, followed by August, June, and September. Thus, the results again demonstrated the role of the transition that results from the shift between the northeast and southeast trade-wind zones, exhibiting a gradual change in acquisition probability. Indeed, the related probabilities were almost linear in their rate of change.
Figure 6. Cumulative effects of increasing CC thresholds on monthly average AP for all Landsat scenes, as well as those from only the TM, ETM+, and OLI sensors in MSEA and Yunnan Province, China: (a) annual, (b) TM, (c) ETM+, and (d) OLI.
Comparative analyses indicated that Landsat family of sensors (in the sequence of TM, ETM+, and OLI) increasingly performed better in acquiring images with less cloud coverage. This hypothesis was tested by gradually increasing CC thresholds from 10%, 20% to 100% ((a–d)). In particular, the probability of useful Landsat 8 OLI image acquisition increased more dramatically than its two predecessors, especially at lower cloud coverage levels. Indeed, image acquisition from the beginning (May) to end (October) of the rainy season increased more clearly compared to both ETM+ and TM data. These changes imply that more usable Landsat scenes, with lower cloud coverage, will be available following the launch and operation of Landsat 8 in the near future. Finally, to demonstrate the differences in availability among Landsat sensors, average acquisition probability for TM, ETM+, OLI, and all Landsat observations at each threshold level, from 0 (0% ≤ CC ≤ 10%), 1 (10% < CC ≤ 20%) to 9 (90% < CC ≤ 100%), were examined during the dry season ((a)), rainy season ((b)), annually ((c)), and in the month with the highest acquisition probability, February ((d)). Using annual acquisition probability as confidence values, one noticeable change across the sensors from TM, to ETM+, and OLI was a gradual increase in acquisition probability at lower CC thresholds, particularly at level 0. The other noticeable change was the opposite effect at higher CC thresholds, especially at level 9. In contrast, variations in acquisition probability were much smaller for the other categories of CC. The concentrated distribution of larger acquisition probability at cloud coverage levels 0, 1, and 2 during the dry season ((a)), including February ((d)), showed that a 30% or less CC threshold was appropriate for analyzing the available Landsat images.
Figure 7. Differences in monthly average AP at various CC thresholds for all Landsat scenes, as well as those from TM, ETM+, and OLI sensors in MSEA and Yunnan Province, China: (a) dry season, (b) rainy season, (c) annual, and (d) February.
4. Conclusions
CC metadata from the currently available Landsat TM, ETM+, and OLI historical images for MSEA (including Yunnan Province, China) over the period 1986–2015 were statistically analyzed at various cloud coverage thresholds (0–100%). This metadata analysis of CC is a prerequisite for future remote sensing monitoring using Landsat products in MSEA, a region which has undergone rapid and extensive land cover and land use changes.
This study leads to four main conclusions. First, the cumulative average acquisition probability of the available Landsat observations over MSEA at the 30% CC threshold was approximately 41.05%. Based on sensor type, Landsat-7 ETM+ had higher acquisition probability (46.39%) because of the cloud-avoidance strategy, followed by Landsat-8 OLI (43.53%) and Landsat-4/5 TM (37.69%). Second, ten-day and monthly level probability statistics of the 30% CC threshold coincide well with the temporal distribution of the dry and rainy seasons. Landsat data acquired during the dry season (especially between December and March) in our 30-year sample were usable for time-series analyses of bio-geophysical properties (e.g. vegetation biomass, water moisture, and land surface temperature) to investigate phenological features using combined TM and ETM+ or ETM+ and OLI images. In contrast, images acquired during the rainy season were barely usable. This situation emphasizes the need for the introduction and use of non-optical data in support of regional remote sensing studies. Third, differences in acquisition probability at the 30% or less cloud coverage threshold were quite distinct between the western and eastern regions of MSEA, typically divided by the Annam Cordillera range in Indochina. In terms of rankings, Myanmar had the largest availability of useful data while Vietnam possessed the least. Finally, the Landsat family of sensors, in the sequence of TM, ETM+, and OLI, has gradually improved their performance in acquiring images that are of high quality with lower cloud coverage. Thus, it can be expected that additional high-quality Landsat 8 OLI scenes with lower CC will be available in the near future. In light of the scan line corrector failure of Landsat 7 and its operation beyond design lifetimes, the next Landsat mission (Landsat 9) is also expected to take place soon.
The distinct seasonal variance in acquisition probability at the 30% or less CC threshold will have a significant impact on land surface biophysical monitoring. In particular, the landscape patterns in MSEA are diverse and complex during the dry season, but tend to homogenize between natural vegetation and artificially planted crops in the rainy season. For example, swidden agriculture in the uplands goes through a number of different development phases between November and April, including vegetation felling/slashing, sun–air drying, field burning, and post-burn (Li and Feng Citation2014). Similarly, deciduous rubber trees experience leaf senescence and withering, defoliation, and foliation from February to April (Li, Zhang, and Feng Citation2015). In contrast, paddy rice cultivation experiences various growth stages, including land preparation and flooding, seedling transplantation, growing (i.e. vegetative, reproductive, and ripening phases) and fallow periods seen after harvest in the lowland (Li et al. Citation2016; Xiao et al. Citation2006). The most important factor for successful local paddy rice cultivation is stable irrigation in the dry season. As a result, the larger acquisition probability by the Landsat sensors during the dry season are more conducive for supporting regional land surface changes monitoring, such as swidden agriculture, rubber plantation expansion, and forest degradation, related to the Reducing Emissions from Deforestation and Forest Degradation plus (REDD+) program. In addition, the seasonal observational abilities of Landsat images may well serve to illustrate the related performance of other Landsat-like satellite sensors. As MSEA countries are developing countries (especially Vietnam, Cambodia, Laos, and Myanmar), the combination of aspirations for economic progress and increased geo-economic cooperation has driven vast and extensive land cover changes over recent decades via the development of alternatives to opium poppies (Cohen Citation2009), cross-border free trade (Su Citation2013), infrastructural construction (i.e. roads, railways, and hydropower stations) (Chen Citation2016), and mining. Therefore, more endeavors to reveal and understand ongoing changes and their related effects on livelihoods and the environment using Landsat imagery are needed in MSEA.
Acknowledgements
Cloud coverage metadata extracted from Landsat-5/7/8 TM, ETM+, and OLI images are available from the US Geological Survey (USGS) EROS Data Center (http://landsat.usgs.gov//consumer.php). The authors extend their thanks to the USGS EROS User Services Department for guidance on the use of cloud coverage metadata, to Dr Han Yan from the Institute of Geographic Sciences and Natural Resources Research, for his guidance on statistical analyses using the Visual Basic application, and to Gregory P. Asner from the Carnegie Institution for Science for his guidance on manuscript revision through Email. The authors also thank the anonymous reviewers and editors for their comments that helped to improve this manuscript.
Disclosure statement
No potential conflict of interest was reported by the authors.
ORCID
Additional information
Funding
References
- Aplin, P. 2004. “Remote Sensing: Land Cover.” Progress in Physical Geography 28 (2): 283–293. doi: 10.1191/0309133304pp413pr
- Asner, G. P. 2001. “Cloud Cover in Landsat Observations of the Brazilian Amazon.” International Journal of Remote Sensing 22 (18): 3855–3862. doi: 10.1080/01431160010006926
- Chen, L. 2016. “Acceleration in Interconnectivity Construction in Southwest China Boosts the Development of the ‘Belt and Road’.” In Annual Report on the Development of the Indian Ocean Region, edited by R. Wang and C. Zhu, 89–110. Singapore: Springer.
- Chuan, G. K. 2005. “The Climate of Southeast Asia.” In The Physical Geography of Southeast Asia, edited by A. Gupta, 80–93. Oxford: Oxford University Press.
- Cohen, P. T. 2009. “The Post-Opium Scenario and Rubber in Northern Laos: Alternative Western and Chinese Models of Development.” International Journal of Drug Policy 20 (5): 424–430. doi: 10.1016/j.drugpo.2008.12.005
- Corlett, R. T. 2005. “Vegetation.” In The Physical Geography of Southeast Asia, edited by A. Gupta, 105–119. Oxford: Oxford University Press.
- Fox, J., J. B. Vogler, O. L. Sen, T. W. Giambelluca, and A. D. Ziegler. 2012. “Simulating Land-Cover Change in Montane Mainland Southeast Asia.” Environmental Management 49 (5): 968–979. doi: 10.1007/s00267-012-9828-3
- Goward, S., T. Arvidson, D. Williams, J. Faundeen, J. Irons, and S. Franks. 2006. “Historical Record of Landsat Global Coverage.” Photogrammetric Engineering & Remote Sensing 72 (10): 1155–1169. doi: 10.14358/PERS.72.10.1155
- Gupta, A. 2005a. “Landforms of Southeast Asia.” In The Physical Geography of Southeast Asia, edited by A. Gupta, 38–64. Oxford: Oxford University Press.
- Gupta, A. 2005b. “Rivers of Southeast Asia.” In The Physical Geography of Southeast Asia, edited by A. Gupta, 65–79. Oxford: Oxford University Press.
- Hansen, M. C., and T. R. Loveland. 2012. “A Review of Large Area Monitoring of Land Cover Change Using Landsat Data.” Remote Sensing of Environment 122: 66–74. doi: 10.1016/j.rse.2011.08.024
- Irish, R. R. 2000. “Landsat 7 Automatic Cloud Cover Assessment.” Proc. SPIE 4049, Algorithms for Multispectral, Hyperspectral, and Ultraspectral Imagery VI, 348. Orlando, FL: SPIE – The International Society for Optical Engineering. doi:10.1117/12.410358.
- Irish, R. R., J. L. Barker, S. N. Goward, and T. Arvidson. 2006. “Characterization of the Landsat-7 ETM+ Automated Cloud-Cover Assessment (ACCA) Algorithm.” Photogrammetric Engineering & Remote Sensing 72 (10): 1179–1188. doi: 10.14358/PERS.72.10.1179
- Ju, J., and D. P. Roy. 2008. “The Availability of Cloud-Free Landsat ETM+ Data over the Conterminous United States and Globally.” Remote Sensing of Environment 112 (3): 1196–1211. doi: 10.1016/j.rse.2007.08.011
- Kontoes, C., and J. Stakenborg. 1990. “Availability of Cloud-Free Landsat Images for Operational Projects. The Analysis of Cloud-Cover Figures Over the Countries of the European Community.” International Journal of Remote Sensing 11 (9): 1599–1608. doi: 10.1080/01431169008955117
- Kovalskyy, V., and D. P. Roy. 2013. “The Global Availability of Landsat 5 TM and Landsat 7 ETM+ Land Surface Observations and Implications for Global 30 m Landsat Data Product Generation.” Remote Sensing of Environment 130: 280–293. doi: 10.1016/j.rse.2012.12.003
- Laborde, H., V. Douzal, H. A. Ruiz Piña, S. Morand, and J.-F. Cornu. 2017. “Landsat-8 Cloud-Free Observations in wet Tropical Areas: a Case Study in South East Asia.” Remote Sensing Letters 8 (6): 537–546. doi: 10.1080/2150704X.2017.1297543
- Li, P., and Feng, Z. 2014. “Monitoring Phenological Stages of Swiddening in Northern Laos During the Dry Season.” Proc. SPIE 9260, Land Surface Remote Sensing II. Beijing: International Society for Optics and Photonics. doi:10.1117/12.2068822.
- Li, P., Z. Feng, L. Jiang, C. Liao, and J. Zhang. 2014. “A Review of Swidden Agriculture in Southeast Asia.” Remote Sensing 6 (2): 1654–1683. doi: 10.3390/rs6021654
- Li, P., L. Jiang, and Z. Feng. 2014. “Cross-Comparison of Vegetation Indices Derived From Landsat-7 Enhanced Thematic Mapper Plus (ETM+) and Landsat-8 Operational Land Imager (OLI) Sensors.” Remote Sensing 6 (1): 310–329. doi: 10.3390/rs6010310
- Li, P., L. Jiang, Z. Feng, S. Sheldon, and X. Xiao. 2016. “Mapping Rice Cropping Systems Using Landsat-Derived Renormalized Index of Normalized Difference Vegetation Index (RNDVI) in the Poyang Lake Region, China.” Frontiers of Earth Science 10 (2): 303–314. doi: 10.1007/s11707-016-0545-8
- Li, P., J. Zhang, and Z. Feng. 2015. “Mapping Rubber Tree Plantations Using a Landsat-Based Phenological Algorithm in Xishuangbanna, Southwest China.” Remote Sensing Letters 6 (1): 49–58. doi: 10.1080/2150704X.2014.996678
- Liu, J., X. Wang, M. Chen, S. Liu, X. Zhou, Z. Shao, and P. Liu. 2014. “Thin Cloud Removal from Single Satellite Images.” Optics Express 22 (1): 618–632. doi: 10.1364/OE.22.000618
- Loveland, T. R., and J. L. Dwyer. 2012. “Landsat: Building a Strong Future.” Remote Sensing of Environment 122 ( Landsat Legacy Special Issue): 22–29. doi: 10.1016/j.rse.2011.09.022
- NASA. 2015. NASA Land Cover/Land Use Change (LCLUC) Program: LCLUC Projects. Accessed December 24, 2015. http://lcluc.umd.edu/projects.php.
- NASA Goddard Space Flight Center. 2011. “Landsat 7 Science Data Users Handbook.” http://landsathandbook.gsfc.nasa.gov/pdfs/Landsat7_Handbook.pdf.
- Potapov, P., S. Turubanova, and M. C. Hansen. 2011. “Regional-Scale Boreal Forest Cover and Change Mapping Using Landsat Data Composites for European Russia.” Remote Sensing of Environment 115 (2): 548–561. doi: 10.1016/j.rse.2010.10.001
- Potapov, P. V., S. A. Turubanova, M. C. Hansen, B. Adusei, M. Broich, A. Altstatt, L. Mane, and C. O. Justice. 2012. “Quantifying Forest Cover Loss in Democratic Republic of the Congo, 2000–2010, with Landsat ETM+ Data.” Remote Sensing of Environment 122: 106–116. doi: 10.1016/j.rse.2011.08.027
- Ramesh, J. 2005. Making Sense of Chindia: Reflections on China and India. New Delhi: India Research Press.
- Sano, E. E., L. G. Ferreira, G. P. Asner, and E. T. Steinke. 2007. “Spatial and Temporal Probabilities of Obtaining Cloud-Free Landsat Images Over the Brazilian Tropical Savanna.” International Journal of Remote Sensing 28 (12): 2739–2752. doi: 10.1080/01431160600981517
- Shao, Z., J. Deng, L. Wang, Y. Fan, N. S. Sumari, and Q. Cheng. 2017. “Fuzzy AutoEncode Based Cloud Detection for Remote Sensing Imagery.” Remote Sensing 9 (4): 311. doi: 10.3390/rs9040311
- Stowe, L. L., E. P. McClain, R. Carey, P. Pellegrino, G. G. Gutman, P. Davis, C. Long, and S. Hart. 1991. “Global Distribution of Cloud Cover Derived From NOAA/AVHRR Operational Satellite Data.” Advances in Space Research 11 (3): 51–54. doi: 10.1016/0273-1177(91)90402-6
- Su, X. 2013. “From Frontier to Bridgehead: Cross-Border Regions and the Experience of Yunnan, China.” International Journal of Urban and Regional Research 37 (4): 1213–1232. doi: 10.1111/j.1468-2427.2012.01191.x
- U.S. Geological Survey. 2016. “Landsat 8 (L8) Data Users Handbook.” https://landsat.usgs.gov/sites/default/files/documents/Landsat8DataUsersHandbook.pdf.
- Whitcraft, A. K., E. F. Vermote, I. Becker-Reshef, and C. O. Justice. 2015. “Cloud Cover throughout the Agricultural Growing Season: Impacts on Passive Optical Earth Observations.” Remote Sensing of Environment 156: 438–447. doi: 10.1016/j.rse.2014.10.009
- Woodcock, C. E., R. Allen, M. Anderson, A. Belward, R. Bindschadler, W. Cohen, F. Gao, et al. 2008. “Free Access to Landsat Imagery.” Science 320 (5879): 1011–1012. doi: 10.1126/science.320.5879.1011a
- Xiao, X., S. Boles, S. Frolking, C. Li, J. Y. Babu, W. Salas, and B. Moore III. 2006. “Mapping Paddy Rice Agriculture in South and Southeast Asia Using Multi-Temporal MODIS Images.” Remote Sensing of Environment 100 (1): 95–113. doi: 10.1016/j.rse.2005.10.004
- Zhu, Z., S. Wang, and C. E. Woodcock. 2015. “Improvement and Expansion of the Fmask Algorithm: Cloud, Cloud Shadow, and Snow Detection for Landsats 4-7, 8, and Sentinel 2 Images.” Remote Sensing of Environment 159: 269–277. doi: 10.1016/j.rse.2014.12.014
- Zhu, Z., and C. E. Woodcock. 2012. “Object-Based Cloud and Cloud Shadow Detection in Landsat Imagery.” Remote Sensing of Environment 118: 83–94. doi: 10.1016/j.rse.2011.10.028
- Ziegler, A. D., T. B. Bruun, M. Guardiola-Claramonte, T. W. Giambelluca, D. Lawrence, and N. T. Lam. 2009. “Environmental Consequences of the Demise in Swidden Cultivation in Montane Mainland Southeast Asia: Hydrology and Geomorphology.” Human Ecology 37 (3): 361–373. doi: 10.1007/s10745-009-9258-x