
ABSTRACT
The quality of GIServices (QoGIS) is an important consideration for services sharing and interoperation. However, QoGIS is a complex concept and difficult to be evaluated reasonably. Most of the current studies have focused on static and non-scalable evaluation methods but have ignored location sensitivity subsequently resulting in the inaccurate QoGIS values. For intensive geodata and computation, GIServices are more sensitive to the location factor than general services. This paper proposes a location-aware GIServices quality prediction model via collaborative filtering (LAGCF). The model uses a mixed CF method based on time zone feature from the perspectives of both user and GIServices. Time zone is taken as the location factor and mapped into the prediction process. A time zone-adjusted Pearson correlation coefficient algorithm was designed to measure the similarity between the GIServices and the target, helping to identify highly similar GIServices. By adopting a coefficient of confidence in the final generation phase, the value of the QoGIS most similar to the target services will play a dominant role in the comprehensive result. Two series of experiments on large-scale QoGIS data were implemented to verify the effectivity of LAGCF. The results showed that LAGCF can improve the accuracy of QoGIS prediction significantly.
1. Introduction
As Services of Architecture (SOA) and cloud computing continue to mature, the quality of GIServices (QoGIS) has been gaining increased attention in recent years. GIServices are a kind of web component designed to present geodata or geographical analysis function over a network. Since the emergence of the cloud computing, promoting a transformation from traditional desktop geoprocessing to web geoprocessing, the numbers of GIServices online have increased exponentially with time (Li, Yang, and Yang Citation2010; Li et al. Citation2011; Chen et al. Citation2014; Yue et al. Citation2016). Many of the GIServices hosted by different providers present similar or identical functions but vary in qualities. QoGIS is often considered as the measurement criteria to discover and select high-quality GIService from a large number of apparently identical GIServices (Halevy et al. Citation2004; Shao et al. Citation2007). Therefore, QoGIS evaluation has become a critical and urgent issue in the GIServices research realm.
QoGIS is complex and difficult to be evaluated reasonably as a consequence of the integrated impact of various factors. QoGIS description models have been defined systematically as a series of quality indicators through extending the quality model of general web services (Wu and Zhang Citation2007; Gao and Wu Citation2012). These models are based on static QoGIS indicators although in practice, most QoGIS parameters may change dynamically with the environment. Periodically monitoring GIServices is an effective method to account for the dynamic nature of QoGIS embedded in some geospatial information portals (Shen, Wu, et al. Citation2012; Gui et al. Citation2016). Such monitoring costs a certain amount of computing resources and bandwidths. Obviously, it is impractical to monitor all the QoGIS in the Internet. User feedback has been used to identify the QoGIS (Shen, Wu, et al. Citation2012), reflecting real user experiences on the GIServices to a certain extent. But, in most cases, users in different contexts may have completely different experiences when they visit the same GIServices. For an example, some users in a place may request the GIServices very quickly while users in another place often cannot invoke the same one successfully in a reasonable time period. That will cause the different user feedbacks about the same GIServices. User feedback is a biased QoGIS evaluation method.
Recently, the collaborative filtering (CF) approach has been shown to be effective in predicting the quality of web services (Cao, Tang, and Huang Citation2014; Chen et al. Citation2010; Zheng et al. Citation2011). CF was originally used in e-commerce recommendation systems (Sarwar et al. Citation2001; Linden, Smith, and York Citation2003; Huang, Zeng, and Chen Citation2007). The services quality prediction methods using the CF algorithm utilizes historical data of similar users to predict other users’ experiences on target services. The theoretical premise of the CF algorithm is that users having similar experiences in some web services will also have similar experiences in other services (Halevy et al. Citation2004; Shao et al. Citation2007; Zheng et al. Citation2011). Most often, the quality of web services may be influenced by dynamic environmental factors (such as Internet bandwidth, server performance, numbers of users, etc.). GIServices, a kind of special web service, always involve massive spatial data and are more sensitive to spatial–temporal environmental factors than general services. However, fewer researchers have paid attention to the influence of spatial features on QoGIS, leading to low accuracy of QoGIS prediction. By considering the effects of spatial distance, the accuracy of services quality prediction has been improved to some extent (Chen et al. Citation2014; Yu and Huang Citation2016). Fusing spatial features into the CF algorithm is a promising approach to enhancing the accuracy of QoGIS prediction.
This paper addresses the low accuracy of QoGIS prediction caused by the dynamic nature of GIServices, by proposing a location-aware GIServices quality prediction model via collaborative filtering (LAGCF). The proposed model is a mixed CF model based on a location feature considering the advantages of both user-based CF and item-based CF (ICF). The time zone location was selected to cluster the users and GIServices as the spatial feature. A location-optimized similarity degree calculation method was designed to enhance the accuracy in searching similar GIServices and similar users. As detailed in this paper, experiments on large-scale QoGIS data collected in real network environments were implemented in order to demonstrate the proposed LAGCF model. The LAGCF model will largely promote the sharing and reusing of GIServices.
The remainder of this paper is organized as follows. Section 2.1 reviews previous work on the evaluation of QoGIS and analyzes the location sensitivity of QoGIS. Section 2.2 introduces current CF methods and describes their application in prediction of quality of services (QoS). The LAGCF model is proposed in Section 3 with four phases: GIServices clustering, similarity calculation, user-GIServices matrix construction and comprehensive QoGIS prediction. In Section 4, experiments on real QoGIS data are conducted to validate the effectiveness of the proposed LAGCF model. Section 5 summarizes the results on comments on future prospects of implementation of this approach to QoGIS.
2. Related work
2.1. Quality evaluation of GIServices
2.1.1. Quality of GIServices
With the rapid development of SOA and cloud computing, more and more web services are available online. Since specifications of general web services do not include the metadata and standard of spatial information, the special challenges within GIS realm cannot be readily resolved. The Open Geospatial Consortium (OGC) established the OGC Web Services framework and proposed a series of GIServices implementation specifications (e.g. Web Map Services (WMS), Web Feature Services, Web Coverage Services and Web Processing Services). In this environment, a large number of GIServices from individuals and research groups appeared in the Internet providing geodata and spatial analysis algorithms to the public (Wen et al. Citation2013, Citation2017; Yue et al. Citation2015). Faced with so many near-identical GIServices with similar functionalities, users generally select a service according to QoGIS indicators. Selecting satisfactory GIServices from a massive number of providers through effectively evaluating the QoGIS is a significant and challenging task, but which will be ultimately beneficial for sharing and reusing of GIServices.
QoGIS refers to the quality of GIServices which often can reflect various aspects of GIServices covering commercial value, standardization level, commercial process, interoperability capacity, security and result (Shen, Wu, et al. Citation2012). The QoGIS indicator system contains a series of QoGIS indicators such as responding time, cost, reputation, stability, availability, load capacity and so on. For examples, the responding time is the time span of users receiving the results after requesting the GIServices; the cost indicator points out whether cheap or expensive the GIServices is; the load capacity indicator reflects the responding ability of the GIServices when it is requested simultaneously by more than one user. Each QoGIS indicator can be as the selection criteria for GIServices according to the users’ demand.
Considering the features of geodata, a QoGIS concept was proposed originally by Wu and Zhang (Citation2007) as an extension of QoS and within this work a research framework of QoGIS was presented. In order to describe the QoGIS in detail, a QoGIS model was introduced for selection of GIServices according to different users’ requirements (Shen et al. Citation2009; Gao and Wu Citation2012). Subsequent research further divided QoGIS models into nine indicators including performance, cost, reliability, availability, security and so on (Onchaga Citation2004). These studies outlined the constitution of QoGIS models based on a system of description indicators; however, methods to evaluate the quality indicators were not delivered. In SOA terms, a service-level agreement (SLA) was employed to declare the QoS which providers promise to present for users (Patel, Ranabahu, and Sheth Citation2009). In practice, the real users’ experiences always violated the quality declaration in SLA since the QoS may be influenced by dynamic environment factors including invocation time, invocation location, numbers of visiting users and so on. A study based on performance monitoring of public WMS was conducted for a global-scale resource survey and reflected the current status of WMS (Gui et al. Citation2016). Combining active service evaluation and real-time quality monitoring mechanisms can be beneficial for selecting the most satisfactory GIServices (Wu et al. Citation2011, Citation2015; Shen, Zhang, et al. Citation2012). Wu et al. (Citation2015) introduced a web portal which reported on 584 OGC services distributed globally from 17 global monitoring sites; the quality metric from both the service level and the layer level were presented for users including response time, availability, etc. Monitoring GIServices periodically helps to effectively evaluate the QoGIS indicators to a certain extent. But, some of QoGIS indicators require long-term monitoring such as stability which will consume a large amount of computation resources and network bandwidths. It is clear that it is impractical to monitor all the GIServices in the Internet due to cost considerations. User feedbacks to GIServices is another common way to measure the QoGIS (Shen, Wu, et al. Citation2012), and reflects the real experience of users on the GIServices. Wu et al. (Citation2005) constructed an adaptive architecture of GIServices based on user feedbacks on QoGIS. Wu et al. (Citation2011) and Shen, Zhang, et al. (Citation2012) combined the monitoring mechanism and user feedbacks to evaluate the QoGIS which helped users choose the GIServices more accurately. But in practice, it is usually the case that different users can have vastly different experiences on the same services, because the users’ QoGIS experience is highly relevant to the client’s context and network environments. Besides, some scholars used one integrated QoGIS evaluation value instead of all the indicators based on the analytic hierarchy method (Liu, Fang, and Liang Citation2013). This integrated evaluation model can give an overview of the QoGIS while it cannot reflect the real status of the specific indicators.
Generally, most previous studies have focused on static and non-scalable evaluation methods of QoGIS but have ignored its dynamic nature of GIServices. This has led to lack of accuracy of evaluation of QoGIS which ultimately has hindered the ability of users to select satisfactory GIServices.
2.1.2. Location sensitivity of QoGIS
Generally speaking, similar GIServices may provide similar functionalities but have different values of QoGIS indicators. QoGIS is a comprehensive indicator taking into account factors such as availability, time delay, stability, response time, extensibility and cost (Wu and Zhang Citation2007). Most of these factors are dynamic, depending on dynamic environmental factors, such as distance, Internet bandwidth, server load, invocation time, invocation location and user load (Liu Citation2011). Among those factors, location is a particularly important factor which represents a certain context at this location point (Ma, King, and Lyu Citation2007; Tang et al. Citation2012; Chen et al. Citation2014). For example, sometimes users from two different locations may get quite different QoGIS experiences when visiting the same GIService. At other times, users at one location may have similar QoGIS experiences when visiting two different GIServices in that region. Location is in essence a compound factor which can reflect the integrated impacts of multiple environmental factors, such as network status, server load, infrastructure, parallel requests and so on. GIServices are more sensitive to the location factor than general web services as a result of use of intensive geodata and computation. Consideration of the strong influence of the location factor in QoGIS evaluation methods will assist judging and distinguishing the QoGIS.
2.2. Collaborative filtering
2.2.1. Collaborative filtering
CF is a heuristic algorithm which has been employed successfully in e-commercial recommendation systems during recent years (Sarwar et al. Citation2001; Linden, Smith, and York Citation2003; Huang, Zeng, and Chen Citation2007). CF utilizes historical data from similar users and predicts the target user’s possible interests in the target product. The central premise of the CF algorithm is that the users having similar consuming behaviors will also have the same interests (Halevy et al. Citation2004; Li, Yang, and Yang Citation2010; Li et al. Citation2011). Breese et al. classified the CF algorithms into memory-based CF and model-based CF (Breese, Heckerman, and Kadie Citation1998).
Memory-based CF calculates the current user preferences through constructing the user-item data matrix based on historical data and searching neighbors who are similar to the current users or items. According to different searching neighbors, memory-based CF can be further divided into user-based CF (UCF), ICF (Sarwar et al. Citation2001; Deshpande and Karypis Citation2004) and user-item-based CF (UICF). The top-K similar users are searched as the neighbors for predicting the current user’s preferences in UCF algorithm while ICF adopts the top-K similar items. Simply using ICF or UCF algorithm may cause prediction results with low accuracy for incomplete information. Addressing this issue, UICF fuses UCF and ICF algorithms to achieve a comprehensive prediction result which improves the accuracy to some extent. Memory-based CF algorithms can be implemented readily, but have the problem of being time-consuming for the similarity computation when dealing with large user datasets.
Model-based CF algorithms are based on statistical analysis or machine learning techniques applied to historical data. Training on sample historical data to construct the model is the core of model-based CF algorithms (Liu, Zhou, and Wang Citation2009). A probability CF method based on a clustering or Bayes network model has been proposed (Breese, Heckerman, and Kadie Citation1998). To date, several models such as statistical models, k-means clustering, Gibbs abstract algorithms, the Bayes network model have been fused in model-based CF algorithms (Shani, Heckerman, and Brafman Citation2005). Since model-based CF adopts probability statistics or machine learning to construct the user models, it is more scalable than memory-based CF. However, this comes at a cost of long time in constructing the user model, especially in reconstructing or updating (Yu and Huang Citation2016).
2.2.2. CF-based quality prediction
Recently, CF approaches have been shown to be effective in predicting quality of web services (Zheng et al. Citation2009; Chen et al. Citation2010; Cao, Tang, and Huang Citation2014). Shao et al. (Citation2007) introduced a CF-based quality prediction method for different user environments which took into account the differences in server performance caused by varying context. Wu et al. (Citation2007) used web services ranking based on a Bayes network to predict quality, which ignored environmental influences. Considering the influences from user input, network condition and the server runtime environment at invocation time, Zhang et al. (Citation2013) proposed a personal services prediction method by drawing the characteristic pattern of services invocations. A model-based CF algorithm was used to mine the data on user experiences for quality prediction in which the quality dataset was obtained in the real network environment (Halevy et al. Citation2004; Shao et al. Citation2007). Jiang et al. (Citation2011) combined the personalized factors of web services into the users similarity to improve accuracy. Zhang et al. (Citation2013) not only used historical experiences data but also added environment and users factors (such as bandwidth and numbers of users) to calculate the QoS. This approach achieved a good prediction since that quality data from users with high similarity degree was computed rather than the whole dataset.
QoS is highly related to spatial features such as location, as has been discussed in Section 2.2.2. However, little attention has been paid to the influence of spatial features on QoS in current studies, which results in low accuracy of the prediction results. Considerations of the effects of geolocation, location features of users and services were united in the CF process to enhance accuracy (Ma, King, and Lyu Citation2007; Tang et al. Citation2012). From the perspectives of both users and services, Chen et al. (Citation2014) used the location as the clustering feature and proposed a fused CF method for quality prediction, resulting in some improvements in prediction accuracy. Yu and Huang (Citation2016) described a multidimensional fused CF based on spatial–temporal factors which considered both location and visiting time, while the differences between users and services were not distinguished.
In general, very few CF studies have focused on the influence of the location feature on quality prediction especially on QoGIS, which has resulted in low accuracy of prediction results. Additionally, there has been no report of CF-based QoGIS prediction experiments involving a large scale of real QoGIS datasets.
3. Methodology
The above discussion highlights the influence of location factor on QoGIS, and accordingly this paper proposes an LAGCF. The LAGCF model takes the time zone as the location feature of the users and GIServices which can indirectly reflect the spatial feature and work schedule of servers, users and the local network. The implementation of the LAGCF model contains four steps: GIServices clustering, similarity calculation, GIServices quality matrix and comprehensive prediction. The time zone is the spatial feature used to cluster the users and GIServices. A location-optimized similarity degree calculation method was designed to enhance the accuracy in searching similar GIServices and similar users. After searching similar users and GIServices, a quality matrix can be constructed to prepare for the final comprehensive computation. The LAGCF model will be an important tool to judge and distinguish GIServices according to the quality.
For more understandability, lists the basic symbols and their descriptions in the LAGCF model.
Table 1. Basic symbols and their descriptions in LAGCF.
3.1. Defining the location feature
As stated in Section 2.2, the QoGIS is highly sensitive to the location feature. Essentially, location is a compound factor which reflects the integrated impact of multiple environmental factors such as network, server load and work regularity. Two GIServices in one region are often in the network environment with the same working regularity. The influence of working regularity on the network and server load is obvious. The network is always busier in working time compared with rest time, and much of the same is true of the server load. If working regularity can be reflected in the prediction computation process, it would be beneficial for improving the accuracy of the prediction. Based on this idea, the time zone is selected as the location feature in the QoGIS prediction process.
Time zone is a special regional division unit reflecting both the geolocation and the working regularity which the administrative district units cannot reflect. The users in a time zone region have similar experiences in visiting GIServices processes. Furthermore, the GIServices in a time zone region have a similar network environment for the same working and rest regularity. Thus, taking the time zone as the clustering unit to group the users and GIServices should be a good approach for searching similar users or GIServices for QoGIS prediction.
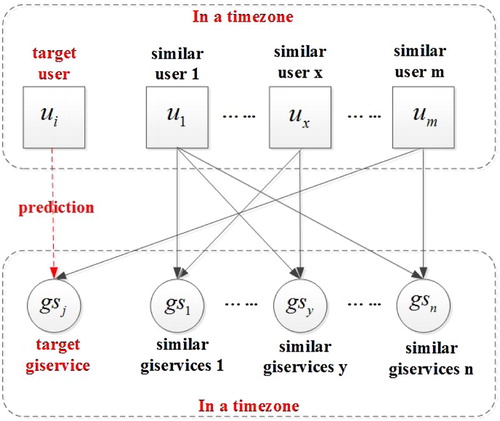
A location-aware quality prediction model for GIServices prediction is proposed, which considers time zone as the typical location feature of the users and GIServices. shows the main idea of the LAGCF. Through the historical QoGIS data of similar users visiting similar GIServices, the QoGIS experiences of target user visiting target GIServices
can be predicted. Similar users are the users group in the same time zone with the target user
. The similar GIServices are defined as the subset of the GIServices group in the same time zone with the target GIServices
. The LAGCF model is used to predict the QoGIS experience of target user
visiting the target GIServices
. The LAGCF model is an extensible method for QoGIS prediction which is not limited to the given GIServices. The target
can be any one of the GIServices no matter whether it has ever been requested. Therefore, the LAGCF model can avoid the extra assumption of the monitoring resources cost.
Figure 1. Illustration of the design of the LAGCF model.
3.2. Location-based clustering
The LAGCF model runs based on historical QoGIS data. Given an historical dataset consisting of users and
GIServices, the relationship between the users and GIServices can be denoted by a
user-GIServices matrix. In this matrix, the rows refer to the users and the columns refer to the GIServices. As shown in , the crossing grid of the row
and column
is the QoGIS value
(e.g. response time, stability) observed by user
on GIServices
. If the user
never invokes the GIServices
, then
. In the meantime, the users set
is clustered into
user groups by the time zone. Likewise, the GIServices set
is clustered into
GIServices groups.
Figure 2. Description of the historical QoGIS matrix.
A user group includes all the users who are located in a time zone region. The users in a user group easily have similar QoGIS experiences. In the same way, the GIServices in a GIServices group probably have similar QoGIS performance. Clustering the users and GIServices based on location anticipates searching for similar GIServices and shrinks the computation matrix.
3.3. Similarity computation
The similarity computation is the core of the CF algorithm and mostly influences the prediction accuracy. The common similarity computation includes the Pearson correlation coefficient (PCC), cosine similarity and adjusted cosine similarity. The traditional PCC is used to measure the similarity of two GIServices as shown in formula (1).(1)
In formula (1), the similarity of the two GIServices and
is measured based on QoGIS experiences of the common users.
is the set of the common users who invoked both
and
.
represents the average value of all the QoGIS values observed by the common users on
.
is as the same with
.
ranges from −1 to 1. The greater the similarity value is, the more similar is the QoGIS of the two GIServices. If the value is negative, the QoGIS of the two GIServices are completely different. Since occasionality has been ignored in the traditional PCC algorithm, the similarity result is always higher than the practical value (McLaughlin and Herlocker Citation2004).
In order to avoid occasionality, the number of the common users is used as the weighting coefficient to improve the PCC. If the number of the common users who invoked both and
is larger, the PCC similarity will be more reliable. Thus, a time zone-adjusted PCC (TPCC) is adopted in the LAGCF model as in formula (2).
(2)
In formula (2), represents all the users who invoked the GIServices in the same time zone with the target GIServices
.
is a subset of users set
, in which the users visited both the GIServices
and
. The length ratio of these two user sets is taken as the weight coefficient to measure the reliability of the PCC similarity. If many common users have similar experiences on both two GIServices, it means that they are really similar. The common users as a percentage of the users who invoked the GIServices in the same time zone region with
can reflect the probability of accidental similarity. The larger the ratio is, the lower is the probability. This weight coefficient adjusts the reliability of the calculation which will lead to a similarity closer to the real status. The TPCC similarity helps to identify GIServices which are really similar in QoGIS performance with the target GIServices.
3.4. Simplified matrix
Using TPCC, the similarity between the target GIServices with other GIServices in the same time zone can be measured. The top-K similar GIServices will be identified. The users in one time zone are easier to be in similar context than in a different time zone since they are at the adjacent locations. Thus, the time zone is selected as the basic clustering unit for searching similar users. The users in the same time zone with the target user
are denoted as the similar users group
. A simplified QoGIS matrix
can be constructed using the top-K similar GIServices and the users group
, which is a
matrix. The simplified matrix represents the QoGIS set observed by similar users on similar GIServices. Through the simplification of the QoGIS matrix, the size of the calculation for generation of the QoGIS will be reduced. Using this approach, many irrelevant GIServices and users are filtered out, which is beneficial for the prediction accuracy.
3.5. QoGIS generation
Now, a simplified and customized QoGIS matrix has been constructed. The QoGIS experiences of the target user
visiting the target GIServices
are denoted as
. The matrix
records all the QoGIS experiences of similar users visiting similar GIServices. Based on the matrix
,
can be generated as shown in formula (3).
(3)
is a GIServices set including the top-K similar GIServices. This paper considers that the more similar the GIServices is with
, the more credible its QoGIS is. Then the similarity value of each GIServices in
is taken as the main part of the coefficient of confidence which adjusts the occupation ratio of its QoGIS value in the final prediction result.
is the average of all the QoGIS values which users in
visited the similar GIServices
. It is possible that some similar users have never visited
, that may cause the average value
smaller.
is a user set in which users have never visited the GIServices
.
can be calculated as shown in formula (4).
(4)
4. Experiments and analysis
4.1. Experiment setup
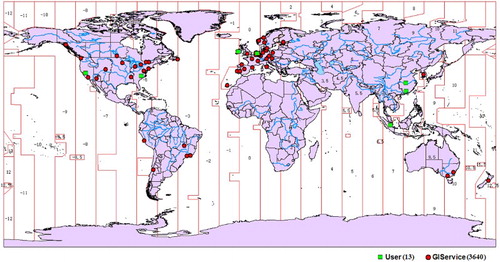
To verify the LAGCF model in this paper, a large-scale, real QoGIS dataset acquired in the real network environment was used in the experiments. To obtain the QoGIS training dataset, 3640 GIServices covering 13 time zones and 24 countries were monitored periodically. Thirteen clients distributed in different time zones including −7:00 (American 1), −04:00 (American 2), +01:00 (Ireland), +02:00 (Holland) and +08:00 (Singapore and Hong Kong). The response time is the typical QoGIS indicator and is obviously influenced by the geolocation. In this paper, the response time data of the 13 clients visiting the 3640 GIServices are collected. However, there are still situations where the server shuts down temporarily or the services could not be detected sometimes. After data preprocessing, there are in total 37,593 items of observed QoGIS records to verify the LAGCF model in this paper. lists statistical information about the observed QoGIS dataset. The minimum responsible time value is 0.01 s and maximum value is 174.09 s. The average value of response time is 1.82 s.
Table 2. Description of the QoGIS dataset.
shows a fragment of the QoGIS dataset collected in the practical monitoring process. Each row of the table is an item of the QoGIS record observed by a client invoking a GIServices. The server URL is the host server address of the GIServices collected by crawling on the Internet. During the data preprocessing, these server URLs are transformed into the Internet Protocol (IP) addresses for locating the relevant time zone. The client IP is the location in which we put the monitoring program.
Table 3. Fragment of the training QoGIS dataset.
describes the distribution of the monitoring clients and GIServices on the world time zone map. As shown in , most GIServices are located in America and Europe where the GIS researches and technologies are relatively advanced. Some GIServices are distributed in China and Australia. The areas on the map with the red outline and a number identifier are the time zone regions which are divided by the world standard. It can be seen that the GIServices are widely distributed in different time zone regions. The related observed QoGIS data can be used to explore the location sensitivity of the GIServices and verify the LAGCF model.
Figure 3. The distribution map of the clients and GIServices.
The user-based CF method using PCC (UPCF) and item-based CF method using PCC (IPCF) have been used in comparative experimental analysis with the LAGCF method. The mean absolute error (MAE) is a common index for measuring the accuracy of prediction approaches. In this paper, the MAE index is used as the evaluation index in comparing the prediction accuracy of the LAGCF and other CF models, as shown in formula (5):(5)
In formula (5), represents the observed QoGIS data in practices and
refers to the prediction result. N is the total number of prediction QoGIS values. If the value of the MAE index is small, then the prediction accuracy is high. The MAE index reflects how close the predicted QoGIS values are to the eventual outcomes on average, which gives an overview of the prediction accuracy.
4.2. Impact of the matrix density
Since the size of the observed QoGIS dataset may influence the prediction accuracy, experiments with different density of the QoGIS matrix were designed and conducted.
We varied the size of the historical observed QoGIS matrix from 10% to 80% by randomly extracting data. Fifty QoGIS values in the matrix were selected as the prediction targets to verify the LAGCF model. Two groups of experiments were implemented separately where the top-K equaled 10 and 30. When top-K is 10, the 10 most similar GIServices in the similarity ranking list will be selected to construct the simplified QoGIS matrix. In the same way, 30 similar GIServices will be selected when top-K is equal to 30.
shows the results of the two groups of experiments. (a) is the prediction performance results for the UPCF, IPCF and LAGCF methods in the context of matrix density from 10% to 80% when the top-K = 10. The horizontal axis represents the matrix density and the vertical axis is the value of the MAE. With an increase in the matrix density, the QoGIS data involving in the calculation become increasingly larger. It is obvious that the MAE index in the IPCF method decreases progressively with the increasing density from 20% to 70%, while MAE in UPCF and LAGCF is not strongly sensitive to the matrix density. When the matrix density is 20%, the accuracy of IPCF meets its lowest value. At the point of 20% matrix density, the MAE value in IPCF is far above the values in the UPCF and LAGCF methods. Since the influence of location is not considered in the searching process of the similar GIServices in IPCF, more accidentally similar GIServices may be selected in the top-K list. In addition, 10 GIServices must be selected which possibly enables the GIServices with completely different quality to join in the calculation process. Likewise, the top-K most similar users in UPCF method may include users who are accidentally similar or completely different to the target user. These may affect the prediction results in UPCF and IPCF. Since more QoGIS data are included in the prediction process with an increasing matrix density, the accuracy of the three CF methods was improved on the whole. Judging by the fluctuation range, LAGCF was more stable than IPCF and UPCF. Similar GIServices and users from the same time zone area with the target GIServices and users appeared in the LAGCF model, which cause the prediction to be better. As can be seen in (b), the same behavior was observed when top-K was 30.
Figure 4. The impact of the matrix density on prediction accuracy.
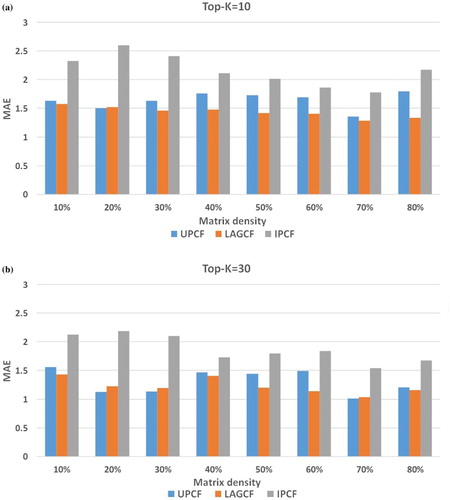
Comparison of (a and b) reveals that the overall effects of the three CF methods were improved when the top-K value increased. This resulted from more similar GIServices and users being involved in the calculation which may cause a reduction in random errors. Generally, the prediction effects of UPCF and LAGCF methods are distinctly better than the IPCF method. The accuracy of the UPCF method is close to LAGCF. The prediction accuracy of LAGCF is the best of the three CF methods as well as the most stable.
4.3. Impact of the location feature
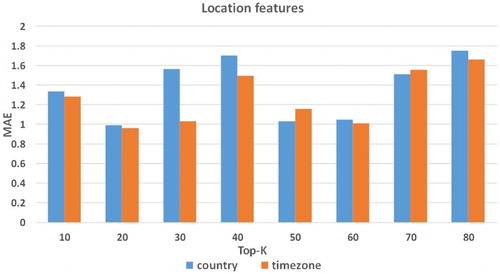
To analyze the effect of different location features, country areas were employed as the location instead of time zones in the LAGCF process. A group of experiments with country and time zone in the LAGCF model were implemented. The matrix density of the QoGIS dataset was 70%. The top-K ranged from 10 to 80 while the step length was 10.
As shows, the distribution trends of the MAE under different top-K parameters are similar between the LAGCF methods based on either country or time zone. When the top-K is 20, the prediction accuracy of the two LAGCF methods becomes the highest. With increasing top-K value, more and more similar GIServices join in the calculations. When 80 similar GIServices were selected in the process, a large number of GIServices not similar with the target influenced the accuracy of both methods. Thus, the worst prediction for both methods were obtained at top-K = 80. Overall, the prediction effect in LAGCF using the time zone feature is very close to the effect for the method with the country feature. In some instances, the time zone feature gives a lower MAE under the same conditions. In the same country, the selected similar GIServices may cross two or more time zone areas with different work regularity and dynamic environment. These factors clearly affect the prediction accuracy.
Figure 5. The impact of the location feature on prediction accuracy.
In general, experiments showed that the LAGCF model in this paper could achieve a significant improvement in accuracy. This also demonstrates that users or GIServices located in the same time zone had similar experiences more readily. By using time zone as the clustering unit of the similar users and GIServices in the process, the precision of the QoGIS prediction could be improved.
5. Conclusions and future work
QoGIS is complex and difficult to be evaluated or predicted accurately due to its dynamic nature. For intensive geodata and computation, GIServices are more sensitive to the location factor than general web services. Location is a compound factor reflecting the integrated impacts of multiple environmental factors. Based on this idea, this paper proposed a location-aware GIServices quality prediction model via CF.
The LAGCF model is a mixed CF method based on the time zone feature from the perspective of both user and GIServices. Four stages are included in the prediction process. Firstly, the time zone feature is used as the location factor to group the GIServices and users. Then, a time zone-adjusted PCC method is designed to measure the degree of similarity between the GIServices and the target, helping to identify really similar GIServices. By constructing a simplified QoGIS matrix with similar users and similar GIServices, the calculation of the QoGIS will concentrate on the similar QoGIS dataset. The comprehensive prediction based on this simplified matrix is the final phase and adopts the coefficient of confidence to adjust the occupation ratio of each related QoGIS value in the result. In order to verify the effectivity of LAGCF model, two series of experiments on a large-scale set of real QoGIS data collected from the Internet were implemented. These experiments examined the impact of matrix density and impact of location features. Experimental results show that the LAGCF model can improve the accuracy of QoGIS prediction significantly. This model is more stable than UPCF and IPCF methods.
In general, the LAGCF model proposed in this paper has been verified to be helpful for the QoGIS prediction accuracy. The basic CF algorithms need the QoGIS training dataset involving a large scale of clients and services while a limited number of the clients were engaged in this paper. That may have an impact on the prediction result. Moreover, the time feature is another important factor which may influence the users’ QoGIS experiences. The LAGCF model does not consider it. In future work, we would like to consider the time sensitivity of the QoGIS. Through using the time feature in the calculation process, the prediction accuracy may be improved further. Methods for selecting the time feature and how to map it into the prediction process need to be considered. Apart from the response time as the experiment data, other QoGIS indicators related to time and space should be also monitored and predicted. Moreover, studies of the prediction performance and timeliness in the era of geographical big data are highly anticipated.
Disclosure statement
No potential conflict of interest was reported by the authors.
Additional information
Funding
References
- Breese, J. S., D. Heckerman, and C. Kadie. 1998. “Empirical Analysis of Predictive Algorithms for Collaborative Filtering.” Proceedings of the fourteenth conference on Uncertainty in Artificial Intelligence, July 24–26, 43–52. Madison, WI: Morgan Kaufmann.
- Cao, B., M. Tang, and X. Huang. 2014. “CSCF: A Mashup Service Recommendation Approach Based on Content Similarity and Collaborative Filtering.” International Journal of Grid and Distributed Computing 7 (2): 163–172. doi:10.14257/ijgdc.2014.7.2.15.
- Chen, X., X. Liu, Z. Huang, and H. Sun. 2010. “Regionknn: A Scalable Hybrid Collaborative Filtering Algorithm for Personalized Web Service Recommendation.” Proceedings of IEEE 2010 international conference on Web Services, July 5–10, 9–16. Miami, FL: IEEE.
- Chen, X., Z. Zheng, Q. Yu, and M. R. Lyu. 2014. “Web Service Recommendation via Exploiting Location and QoS Information.” IEEE Transactions on Parallel and Distributed Systems 25: 1913–1924. doi: 10.1109/TPDS.2013.308
- Deshpande, M., and G. Karypis. 2004. “Item-based Top-n Recommendation Algorithms.” ACM Transactions on Information Systems (TOIS) 22 (1): 143–177. doi: 10.1145/963770.963776
- Gao, R., and Q. Wu. 2012. “Research on Building Model of Geographic Information Services Quality.” Geomatics & Spatial Information Technology 35 (9): 145–147.
- Gui, Z., J. Cao, X. Liu, X. Cheng, and H. Wu. 2016. “Global-scale Resource Survey and Performance Monitoring of Public OGC Web Map Services.” ISPRS International Journal of Geo-Information 5: 88. doi: 10.3390/ijgi5060088
- Dong, X., A. Halevy, J. Madhavan, E. Nemes, and J. Zhang. 2004. “Similarity Search for Web Services.” Proceedings of the thirtieth international conference on Very Large Data Bases, VLDB Endowment, Toronto, Canada, August 31–September 3, 372–383.
- Huang, Z., D. Zeng, and H. Chen. 2007. “A Comparison of Collaborative-Filtering Recommendation Algorithms for e-Commerce.” IEEE Intelligent Systems 22 (5): 68–78. doi: 10.1109/MIS.2007.4338497
- Jiang, Y., J. Liu, M. Tang, and X. Liu. 2011. “An Effective Web Service Recommendation Method Based on Personalized Collaborative Filtering.” Proceedings of 2011 IEEE international conference on Web Services, July 4–9, 211–218. Washington, DC: IEEE. doi:10.1109/ICWS.2011.38.
- Li, Z., C. Yang, H. Wu, W. Li, and L. Miao. 2011. “An Optimized Framework for Seamlessly Integrating OGC Web Services to Support Geospatial Sciences.” International Journal of Geographical Information Science 25 (4): 595–613. doi:10.1080/13658816.2010.484811.
- Li, W., C. Yang, and C. Yang. 2010. “An Active Crawler for Discovering Geospatial Web Services and Their Distribution Pattern – A Case Study of OGC Web Map Service.” International Journal of Geographical Information Science 24 (8): 1127–1147. doi:10.1080/13658810903514172.
- Linden, G., B. Smith, and J. York. 2003. “Amazon.com Recommendations: Item-to-Item Collaborative Filtering.” IEEE Internet Computing 7 (1): 76–80. doi: 10.1109/MIC.2003.1167344
- Liu, T. 2011. “Research on Key Technologies About Composite Service Dynamic Selection, Deployment Optimization and Execution.” Doctoral diss., Fudan University.
- Liu, L, J. Fang, and D. Liang. 2013. “A Model for Heterogeneous Quality Evaluation of Geographic Web Service.” IEEE 21st international conference on Geoinformatics, Kaifeng, China, 1–5.
- Liu, J., T. Zhou, and B. Wang. 2009. “Review on Personalized Recommendation System.” Progress in Natural Science 19 (1): 1–15. doi: 10.1016/j.pnsc.2008.06.004
- Ma, H., I. King, and M. R. Lyu. 2007. “Effective Missing Data Prediction for Collaborative Filtering.” Proceedings of the 30th annual international ACM SIGIR conference on Research and Development in Information Retrieval, July 23–27, 39–46. Amsterdam: ACM. doi:10.1145/1277741.1277751.
- McLaughlin, M., and J. Herlocker. 2004. “A Collaborative Filtering Algorithm and Evaluation Metric That Accurately Model the User Experience.” Proceedings of the 27th annual international ACM SIGIR conference on Research and Development in Information Retrieval, July 25–29, 329–336. Sheffield: ACM. doi:10.1145/1008992.1009050.
- Onchaga, R. 2004. “Modelling for Quality of Services in Distributed Geoprocessing.” ISPRS Proceeding, Istanbul.
- Patel, P., A. H. Ranabahu, and A. P. Sheth. 2009. Service Level Agreement in Cloud Computing. http://corescholar.libraries.wright.edu/knoesis/78.
- Sarwar, B., G. Karypis, J. Konstan, and J. Riedl. 2001. “Item-based Collaborative Filtering Recommendation Algorithms.” Proceedings of ACM 2001: the 10th international conference on World Wide Web, Hong Kong, May 1–5, 285–295.
- Shani, G., D. Heckerman, and R. I. Brafman. 2005. “An MDP-based Recommender System.” Journal of Machine Learning Research 6: 1265–1295.
- Shao, L., J. Zhang, Y. Wei, J. Zhao, B. Xie, and H. Mei. 2007. “Personalized QoS Prediction for Web Services Via Collaborative Filtering.” Proceedings of IEEE 2007 international conference on Web Services, July 9–13, 140–152. Salt Lake City, UT: IEEE.
- Shen, S., W. Liu, H. Wu, and Y. Chen. 2009. “A Multi-level Comprehensive Evaluation Method for Quality of WMS Based on Fuzzy Mathematics.” Proceedings of 2009 17th international conference on Geoinformatics, August 12–14. IEEE. doi:10.1109/GEOINFORMATICS.2009.5293530.
- Shen, S., H. Wu, T. Zhang, and Z. Liu. 2012. “Geographical Information Catalog Service Supporting Active Registry and Real-Time Quality Monitoring.” Geomatics and Information Science of Wuhan University 37 (5): 525–528.
- Shen, S., T. Zhang, H. Wu, and Z. Liu. 2012. “A Catalogue Service for Internet GIServices Supporting Active Service Evaluation and Real-Time Quality Monitoring.” Transactions in GIS 16 (6): 745–761. doi: 10.1111/j.1467-9671.2012.01363.x
- Tang, M., Y. Jiang, J. Liu, and X. Liu. 2012. “Location-aware Collaborative Filtering for QoS-based Service Recommendation.” IEEE 19th international conference on Web Services, Honolulu, June 24–29, 202–209. doi:10.1109/ICWS.2012.61.
- Wen, Y., M. Chen, G. Lu, and H. Lin. 2013. “Prototyping an Open Environment for Sharing Geographical Analysis Models on Cloud Computing Platform.” International Journal of Digital Earth 6 (4): 356–382. doi: 10.1080/17538947.2012.716861
- Wen, Y., M. Chen, S. Yue, P. Zheng, G. Peng, and G. Lu. 2017. “A Model-Service Deployment Strategy for Collaboratively Sharing Geo-analysis Models in an Open Web Environment.” International Journal of Digital Earth 10 (4), 405–425. doi:10.1080/17538947.2015.1131340.
- Wu, H., and H. Zhang. 2007. “QoGIS: Concept and Research Framework.” Geomatics and Information Science of Wuhan University 32 (5): 385–388.
- Wu, H., Z. Li, H. Zhang, C. Yang, and S. Shen. 2011. “Monitoring and Evaluating the Quality of Web Map Service Resources for Optimizing Map Composition Over the Internet to Support Decision Making.” Computers & Geosciences 37 (4): 485–494. doi: 10.1016/j.cageo.2010.05.026
- Wu, G., J. Wei, X. Qiao, and L. Li. 2007. “A Bayesian Network Based QoS Assessment Model for Web Services.” Proceedings of 2007 IEEE international conference on Services Computing, Salt Lake City, UT, July 9–13.
- Wu, S., M. Zhang, Q. Huang, C. Wan, J. Cao, Z. Gui, and K. Qin. 2015. “Design a Web Portal for Visualizing and Exploring Service Quality of Global OGC Web Map Services.” Proceedings of IEEE 2015: 23rd international conference on Geoinformatics, Wuhan, China, July 19–21, 1–5.
- Wu, H, H. Zhang, X. Liu, and X. Sun. 2005. “Adaptive Architecture of Geospatial Information Service Over the Internet with QOGIS Embedded.” Proceedings of the International Society of Photogrammetry and Remote Sensing (ISPRS) Workshop on Service and Application of Spatial Data Infrastructure, XXXVI (4/W6), Hangzhou, China, 53–57.
- Yu, C., and L. Huang. 2016. “A Web Service QoS Prediction Approach Based on Time- and Location-Aware Collaborative Filtering.” Service Oriented Computing and Applications 10: 135–149. doi: 10.1007/s11761-014-0168-4
- Yue, S., M. Chen, Y. Wen, and G. Lu. 2016. “Service-oriented Model-Encapsulation Strategy for Sharing and Integrating Heterogeneous Geo-Analysis Models in an Open Web Environment.” ISPRS Journal of Photogrammetry and Remote Sensing 114: 258–273. doi: 10.1016/j.isprsjprs.2015.11.002
- Yue, S., Y. Wen, M. Chen, G. Lu, D. Hu, and F. Zhang. 2015. “A Data Description Model for Reusing, Sharing and Integrating Geo-Analysis Models.” Environmental Earth Sciences 74 (1): 7081–7099. doi: 10.1007/s12665-015-4270-5
- Zhang, L., B. Zhang, L. Huang, and Z. Zhu. 2013. “A Personalized Web Service Quality Prediction Approach Based on Invoked Feature Model.” Journal of Computer Research and Development 50 (5): 1066–1075.
- Zheng, Z., H. Ma, M. Lyu, and I. King. 2011. “QoS-aware Web Service Recommendation by Collaborative Filtering.” IEEE Transactions on Services Computing 4: 140–152. doi: 10.1109/TSC.2010.52
- Zheng, Z., H. Ma, M. Lyu, and I. King. 2009. “WSRec: A Collaborative Filtering Based Web Service Recommender System.” Proceedings of IEEE 2009 international conference on Web Services, Los Angeles, CA, July 6–10, 437–444.