
 ?Mathematical formulae have been encoded as MathML and are displayed in this HTML version using MathJax in order to improve their display. Uncheck the box to turn MathJax off. This feature requires Javascript. Click on a formula to zoom.
ABSTRACT
Pakistan is an agriculture-based economy and major proportion of irrigation water for its cultivated lands is abstracted from the Upper Indus Basin (UIB). UIB water supplies are mostly contributed from the high-altitude snow and glacier fields situated in the Hindukush–Karakoram–Himalayan ranges. Any change in the flows of these river catchments due to climate variability may result in the form of catastrophic events like floods and droughts and hence will adversely affect the economy of Pakistan. This study aims to simulate snowmelt runoff in a mountainous sub-catchment (Shyok River basin) of the UIB under climate change scenarios. Snowmelt Runoff Model (SRM) coupled with remotely sensed snow cover product (MOD10A2) is used to simulate the snowmelt runoff under current and future climate scenarios in the study area. The results indicate that (a) SRM has efficiently simulated the flow in Shyok River with average Nash–Sutcliff coefficient value (R2) of 0.8 (0.63–0.93) for all six years (2000–2006) of basin-wide and zone-wise simulations, (b) an increase of 10% (by 2050) and 20% (by 2075) in SCA will result in a flow rise of ∼11% and ∼20%, respectively, and (c) an increase of 1°C (by 2025), 2°C (by 2050), 3°C (by 2075) and 4°C (by 2100) in mean temperature will result in a flow rise of ∼26%, ∼54%, ∼81% and ∼118%, respectively. This study suggests that SRM equipped with remotely sensed snow cover data is an effective tool to estimate snowmelt runoff in high mountain data-scarce environments.
1. Introduction and background
The developing countries having natural resource-based economy and livelihoods are most vulnerable to climate change (Shrestha and Aryal Citation2011). Fresh water resources are at a serious risk all over the world as a major consequence of climate change. A slight modification in climatic behaviour in terms of rise in temperature and unpredictable and varying rainfall will most likely influence the river flow in mountainous regions (Sharma, Mishra, and Joshi Citation2013). If these climatic trends persist, the survival of glaciers will be uncertain. The change in glacier is termed as natural indicator of warming (Naeem, Hashmi, and Shakir Citation2013).
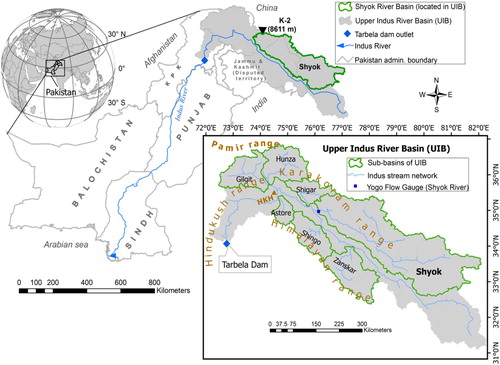
Agriculture-based economy of Pakistan depends largely on the irrigation water supply, provided by the Indus River through Indus Basin Irrigation System. Most of the Indus River flow at Tarbela is originating from the Himalaya–Karakoram–Hindukush (HKH) Mountains and carried through Upper Indus Basin (UIB). Indus River originates at altitude of 5166 m from western Tibet region, flowing in northwest direction through the mighty Himalaya and Karakoram ranges all the way to Hindukush Mountains and then takes a sharp turn towards the south entering the foothill and plains and eventually reaches into Arabian Sea (). The Indus River, one of the leading and significant rivers, serving as lifeline for a large population, is trans-boundary and enormous river in Asia with respect to its volumetric flow and sediment load on yearly basis (Mukhopadhyay and Dutta Citation2010). The sub-catchments of UIB, the area upstream Tarbela reservoir, include the Hunza, Gilgit, Astore, Shigar, Shyok, Shingo and Zanskar basins (). A significant amount of UIB annual flow results from seasonal snow and glacier melting (Bookhagen and Burbank Citation2010; W. W. Immerzeel, Pellicciotti, and Bierkens Citation2013; Immerzeel et al. Citation2012; Mukhopadhyay and Khan Citation2014) and stored in Tarbela dam (). The stocked water is then disseminated to downstream irrigated lands via composite arrangement of hydrological structures (Tahir et al. Citation2011).
Figure 1. Map of Pakistan including the UIB area, its sub-basins, Tarbela dam and study area.
Predicting the future runoff from high-altitude snow and glacier catchments is still a difficult task for the researchers mainly due to the data limitations. Many simple and complex modelling techniques have been proposed to simulate and forecast the melt runoff from mountainous catchments around the globe. Several hydrological models use a blend of the remote sensing and ground climatic observations to efficiently simulate the daily runoff in the mountainous catchments (Martinec Citation1975).
The World Meteorological Organization (WMO Citation1986) has listed almost 18 snowmelt models and 6 of these, that is, the SSARR Model, HEC-1, NWSRFS Model, PRMS Model, SRM and GAWSER Model, have been demonstrated as valuable operational models and thought to have a high potential for future operational use. At present, Snowmelt Runoff Model (SRM) developed by Martinec (Citation1975) is among few models in the world that utilizes remote sensing snow cover as a key input to simulate, forecast and studying the impact of climate change on the daily river discharge in the mountainous environments. The SRM overcomes the difficulty of precipitation under-estimation at high altitudes by using the snow cover area (SCA) whenever possible to simulate the runoff.
Tekeli et al. (Citation2005) simulated the upper Euphrates River flow efficiently by incorporating Moderate Resolution Imaging Spectroradiometer (MODIS) 8-daily satellite snow cover products for 2002–2004 into SRM. Due to its minimum data obligation and application of remote sensing to give snow cover details, SRM may be suitable to be applied in data-scarce regions, principally in remote and inaccessible high mountain watersheds such as those of UIB (Ma and Cheng Citation2003). In this regard, researchers (e.g. Tahir et al. Citation2011; Butt and Bilal Citation2011) have successfully used SRM to simulate daily discharges in different watersheds of UIB. Seidel, Martinec, and Baumgartner (Citation2000) simulated the runoff successfully in the large Himalayan basins, for example, Ganges and Brahmaputra basins, by utilizing SRM. SRM has been applied in the Gongnaisi River basin and proves to be appropriate for the simulation of daily snowmelt runoff in the western Tianshan Mountains (Ma and Cheng Citation2003). Zhang et al. (Citation2014) applied SRM to simulate snowmelt runoff within the Qinghai Lake basin using two different precipitation (in-situ and gridded APHRODITE) and snow products (MODISMC and MOD10A2). They concluded that the SRM is an effective tool for the estimation of snowmelt runoff in high mountain environments. The SRM application in Kuban river basin using MODIS 8-daily composite snow cover data showed that model can be applied for short-range runoff forecasts in the mountain and foothill areas of the Krasnodar reservoir basin (Georgievsky Citation2009).
Persistent progress in hydrological modelling of snow and glacier melt in the HKH zone generally through conceptually lumped, semi-distributed (rather than physically based models) have delivered standard configurations of spatiotemporal patterns of precipitation and runoff at very large scales (Bookhagen and Burbank Citation2010; Immerzeel, van Beek, and Bierkens Citation2010; Akyurek et al. Citation2010). Several basin-scale modelling studies have addressed the glacio-hydrological processes in the Himalayan region (Konz et al. Citation2007; Akhtar, Ahmad, and Booij Citation2008; Butt and Bilal Citation2011; Immerzeel et al. Citation2012; Tahir et al. Citation2011). Most of these studies have presumed parameter values from the literature or during calibration. Hydrological models in mountainous regions with limited observations are customarily forced with precipitation data found at lower elevations, which can lead to additional ambiguity. Satellite-derived precipitation evaluations and interpolated rain-gauge observations have been used in further studies as inputs to SRM instead of gauged precipitation. For example, Bookhagen and Burbank (Citation2010) used improved Tropical Rainfall Measuring Mission rainfall estimates to illustrate the spatiotemporal distribution of rainfall, snowfall and evapotranspiration across the Himalayan region, whereas Tahir et al. (Citation2011) used interpolated APHRODITE daily precipitation data to simulate snowmelt runoff in the Hunza River basin.
The glacial and ice masses of HKH ranges are still among the least investigated on the basis of in-situ data due to extreme weather conditions and remote access at high altitudes. This data-scarce high altitudinal heterogeneous terrain may be efficiently studied for its hydro-climatology using the coupled technique of satellite remote sensing, field observations, GIS and SRM (Sirguey, Mathieu, and Arnaud Citation2009; Tahir et al. Citation2011). Therefore, the objectives of this study are as follows:
Evaluating the SRM’s ability to simulate the daily stream flows in the snow- and glacier-fed data-scarce sub-catchment of the UIB
Studying the impacts of future climate change scenarios (in terms of mean temperature and SCA) on the river discharge for water resources management in the UIB
2. Study area: Shyok River basin
Shyok River basin, one of the UIB snow- and glacier-fed sub-catchment situated between 75° and 82° Longitude, and 32°and 36° Latitude (), is selected for this study. The total drainage area of Shyok River basin is ∼68,290 km2, as estimated from Advanced Spaceborne Thermal Emission and Reflection Radiometer (ASTER)-Global Digital Elevation Model (GDEM), version 2 (V2). The elevation of the catchment area varies from 2387 m ASL to 7724 m ASL with a mean catchment elevation (estimated from hypsometric curve; ) of 5150 m ASL. This catchment is situated in three different geographical regions, that is, northwestern part of the catchment is in Pakistan, middle part is in Ladakh (disputed territory of Jammu and Kashmir), whereas the relatively south-eastern part is situated in the Tibetan region of China. One climate station Hushey (3075 m ASL) is installed within the catchment, whereas the nearest neighbouring climate station is installed in Skardu (2317 m ASL) (). Skardu climate station is installed and managed by the PMD and has a quite long data series of ∼56 years (1952–2007). The mean total annual precipitation is 230 mm at Skardu according to the available data record. The Shyok River has a mean annual flow of 358 m3/s (i.e. 165 mm of water depth equivalent) gauged at Yogo hydrometric station (2469 m ASL) (), according to the 33-year (1974–2007) flow records of Water and Power Development Authority (WAPDA).
Figure 2. GDEM of the Shyok River basin showing five altitudinal zones, glacier coverage across them, and overlaid by the hydro-climatic gauging stations.
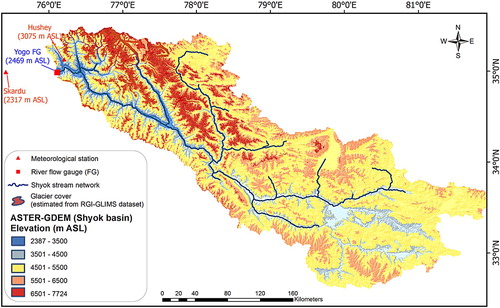
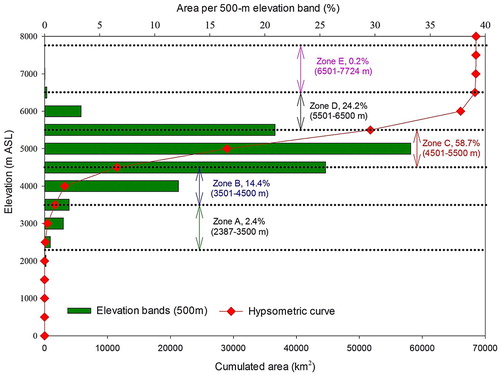
Figure 3. Hypsometric curve and the distribution of area under 500-m elevation bands for the Shyok River basin (estimated from ASTER GDEM).
Main characteristics of the Shyok River basin are presented in . The glacier concentration is much more in the central part of the catchment (Karakoram region of Ladakh and north-eastern Pakistan) where it has many peaks above an altitude of 7000 m with the well-known Siachin glacier (surface area = 1112 km²) in the same region (Roohi Citation2006).
Table 1. Key features of the study area (Shyok River basin).
3. Data sets, sources and treatment
A brief description of the satellite remote sensing data sets (ASTER and MODIS satellite products) and ground observations (stream flow and climate data) used for the snowmelt runoff modelling in the Shyok River basin is given below.
3.1. ASTER GDEM data
ASTER GDEM is used to study the topography of study area. The ASTER GDEM is offered for high-latitude and steep mountainous areas, not covered by SRTM3 (METI and NASA 2009). SRTM (Shuttle Radar Topography Mission) comprises a particularly modified radar system that hovered on board the Space Shuttle Endeavour during an 11-day mission in February of 2000. SRTM acquired elevation data on a near-global scale to produce the most complete high-resolution digital topographic database of earth. The horizontal spacing of the SRTM3 DEM is 90 × 90 m and the absolute vertical accuracy is enhanced than 9 m (Farr et al. Citation2007).
As detailed on the web page (http://www.ersdac.or.jp/GDEM/E/4.html), the ASTER GDEM was formed by processing and stereo-correlating the 1.3 million-scene ASTER archive of optical images, covering land surfaces between 83°N and 83°S and is composed of 22,600 1°-by-1° tiles. Tiles that surround at least 0.01% land area are included. The ASTER GDEM is in the GeoTIFF format with geographic lat/long coordinates and a 1-arc-second (approximately 30 m, depending on latitude) grid of elevation postings. It is referenced to the WGS84/EGM96 geoid. Pre-production estimated accuracies for this global product were 20 m at 95% confidence for vertical data and 30 m at 95% confidence for horizontal data.
GDEM data were used to delineate the river catchment area. For the zone-wise application of SRM in the Shyok River basin, five altitudinal zones (A, B, C, D and E) were extracted from the GDEM of the study area ( and ). Total catchment and zonal areas, along with hypsometric curves, were also estimated with the ASTER GDEM ( and ; ) because these characteristics are used as input to SRM. The hypsometric curves were then used to calculate the mean elevations of the river basins and their respective altitudinal zones ( and ).
Table 2. Main features of the elevation zones extracted from the ASTER GDEM.
The study utilized Randolph Glacier Inventory (RGI) Version 5 (V5) to estimate the glacier cover over the Shyok River basin ( and ). Launched in July 2015, RGI V5 has advanced reporting of most Asian glaciers (Arendt et al. Citation2015), presenting both the new and previously-published glacier outlines. Arendt et al. (Citation2015) have presented completely new glacial outlines for the HKH region in the recent version and were taken from the GAMDAM Glacier Inventory of Nuimura et al. (Citation2015) and the second Chinese Glacier Inventory of Guo et al. (Citation2015). RGI V5 is an internationally complete catalogue of glacier outlines and is incremental to the Global Land Ice Measurements from Space initiative. The RGI V5 ensures complete one-time coverage, version control and a standard set of attributes (Arendt et al. Citation2015).
3.2. MODIS (MOD10A2) snow products
MODIS/Terra Snow Cover 8-Day L3 Global 500 m Grid (MOD10A2) snow products were used in the present study to estimate the snow cover of the catchment and its five altitudinal zones over the time period of 2000–2006. MOD10A2 products provide for 8-day period maximum snow cover extent (Hall, Riggs, and Salomonson Citation2000) with a resolution of approximately 500 m (precisely, 15 arc-second) covering the entire Shyok River basin.
Numerous studies (Dorothy K. Hall and Riggs Citation2007; Pu, Xu, and Salomonson Citation2007; Liang et al. Citation2008; Wang et al. Citation2009) have revealed high accuracy (≥90% under clear sky conditions and at snow depths of ≥4 cm) of MOD10A1 and MOD10A2 data, when compared to in situ observations. Tekeli et al. (Citation2005) compared the MODIS snow cover images with ground observations and found that the MODIS estimated the snow cover efficiently even in the irregular terrain river basin. Maurer et al. (Citation2003) reported that MODIS snow cover products are more efficient as compared to the operational National Operational Hydrologic Remote Sensing Center snow cover images specifically in topographically complex portions of the Columbia River basin.
Satellite-derived snow cover is also the most efficient and readily available input for snowmelt runoff modelling (Panday et al. Citation2014; Zhang et al. Citation2014). MODIS snow cover products have wide-ranging applicability in the hydrological models for stream flow simulation and forecasting in the mountainous environments as done by various researchers (e.g. Maurer et al. Citation2003; Lee, Klein, and Over Citation2005; Tekeli et al. Citation2005; Georgievsky Citation2009; Immerzeel, van Beek, and Bierkens Citation2010; Panday et al. Citation2014; Zhang et al. Citation2014). Immerzeel et al. (Citation2009) reported that the MODIS snow cover data used in a hydrological runoff model can predict UIB discharge efficiently. Lee, Klein, and Over (Citation2005) reported that MODIS snow cover products have ample accuracy for stream flow estimation using the SRM in the snowmelt-fed basin of the Upper Rio Grande basin.
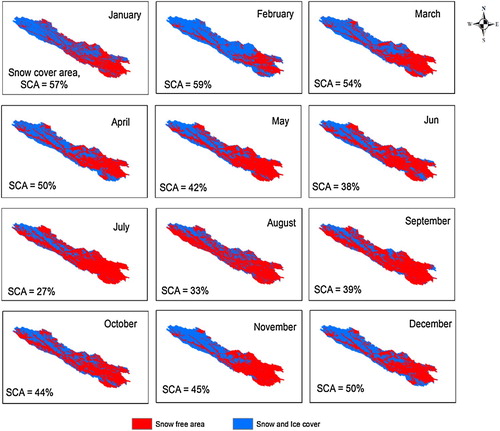
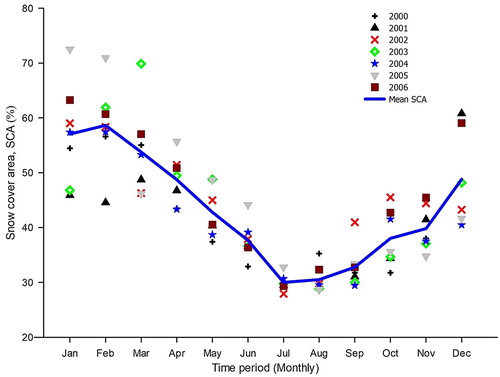
A data set of ∼320 MOD10A2 images was treated to estimate the basin-wide snow cover of Shyok River basin. The Shyok River basin area was extracted from larger tiles (h24-v05 tile; ‘h’ denotes horizontal and ‘v’ denotes vertical) to estimate the spatial extent of snow cover (%) for the entire basin over the 7-year period. A set of MODIS snow images showing mean monthly SCA variations for the Shyok River basin is presented in . The study area was extracted by mask function from treated MODIS images and projected with the WGS 1984 UTM ZONE 43N projection system. The SCA was also estimated for the different elevation zones (A, B, C, D and E; ) of the study area to use for snowmelt runoff modelling. The daily zonal SCA was estimated by the linear interpolation of the SCA calculated from 8-day composite MOD10A2 satellite images.
Figure 4. Mean monthly SCA variations in the Shyok River basin as extracted from MODIS snow products.
A constraint of using MOD10A2 is the persistent cloud cover over consecutive days, hiding the snow cover that might be existing (Hall and Riggs Citation2007). However, the reservations about this product (including the misunderstanding between the snow and cloud signals or using maximum snow covered area (SCA) over the 8-day period) are yet not well identified in high-altitude areas (Hall and Riggs Citation2007). The current study did not use the daily MODIS snow product (MOD10A1), for the reason of the significant gaps in the time series, particularly for the period of the monsoon as a consequence of cloud cover (Savéan et al. Citation2015), and furthermore, due to the poor quality of this product in the HKH area (Ragettli et al. Citation2015). MODIS snow products (MOD10A2) used in the current study were treated to avoid the inaccuracies in snow cover estimation due to cloud cover by adopting the method detailed by Tahir et al. (Citation2015). The images where the clouds cover exceeded 10% were discarded from the time series. The snow cover on that date was then estimated by linearly interpolating between the previous and next cloud free image.
3.3. Hydro-meteorological data
Stream flow measurements in Pakistan are carried out by the Surface Water Hydrology Project of WAPDA. The daily hydrological data used in this study are obtained for the Yogo hydrometric station of Shyok river available for the period of 1974–2007 (33 years); however, for the year 2005, discharge data are missing as for most of the other UIB gauges. Meteorological data (daily mean temperature and daily total precipitation) of more than 50 years (1952−2007) recorded at a neighbouring Skardu climate station (outside the catchment boundary) were obtained from Pakistan Meteorological Department (PMD). All these datasets are recorded according to the WMO standards.
4. Description and application of the SRM
SRM is developed for simulating and estimating daily streamflow in mountainous basins where snowmelt is a key runoff factor. It is now also used to evaluate the influence of a changing climate on seasonal snow cover and runoff (Rango, Martinec, and Roberts Citation2008). More than 80% of applications of SRM have been performed by independent users. SRM also successfully underwent tests by the WMO with regard to runoff simulation (WMO Citation1986). Moreover, SRM is computationally simple, in general has performed well with less data necessities (Tekeli et al. Citation2005), and has qualified rigorous testing for various environments, sizes of basins, and geographic settings (Engman, Rango, and Martinec Citation1989). Furthermore, with the use of satellite snow data, the model has been improved over a period of time for its applications to large basins in inaccessible terrain (Dey, Sharma, and Rango Citation1989).
SRM, being a conceptual degree-day model (Jaroslav Martinec et al. Citation1998; Kustas, Rango, and Uijlenhoet Citation1994), requires the daily input data on river discharge, precipitation, air temperature and SCA. Along with the input variables, several basin characteristics such as basin area, zonal area (in zone-wise application) and the hypsometric (area elevation) curve are also needed. The daily water originated from the snowmelt and rainfall is superimposed on the calculated recession flow and transformed into daily discharge from the catchment as given in the following equation:(1)
(1) where Q is the mean daily discharge (m3/s), c is the runoff coefficient expressing the losses as ratio (runoff/precipitation), with cS denoting snowmelt runoff and cR denoting rainfall-runoff coefficient, a is the degree-day factor (DDF) (cm °C–1 d–1), T is the number of degree-days (°C d), S is the ratio of the SCA to the total area, n is the sequence of days, P is the precipitation (in cm) contributing to runoff, A is the area of the basin or zone, and k is the recession coefficient (Xc and Yc).
The comprehensive explanation of the variables and parameters used in this equation is given by Martinec et al. (Citation1998). Eight parameters to be calibrated in SRM are given in .
Table 3. SRM parameters to be calibrated.
The prior studies of implementing the SRM to mountainous river catchments of Himalaya and other regions of the world advocate that the model can be used in the snow- and glacier-fed river basins of HKH to simulate the daily stream flows as well as to study the impacts of future climate change on river runoff. The other aspect that recommends the usage of SRM is its weak susceptibility towards the precipitation forcing (Tahir et al. Citation2011). Since, the precipitation data offered for the high-altitude HKH catchments are not of very good quality (due to under-catch problems) so we opt to use the SRM which is more sensitive to the daily snow cover and temperature input.
The model was run for 6 hydrological years of 2000–2006 (excluding missing data year 2005). The basic parameters of the model shown in were calibrated during the run of the model and/or extracted from previous modelling studies (Dey, Sharma, and Rango Citation1989; Hock Citation2003; Immerzeel, van Beek, and Bierkens Citation2010; Prasad and Roy Citation2005; Zhang, Liu, and Ding Citation2006) on Himalayan region. These studies present a ‘DDF’ value of 5.7–7.4 (mm °C−1 d−1) for ice and about 4–5 (mm °C−1 d−1) for snow. Model was calibrated for the time span of 2000–2002 and validated over the years 2003, 2004 and 2006, using both the ‘basin-wide’ and the ‘zone-wise’ application.
The classical efficiency criteria in hydrological modelling were used to evaluate the SRM; the Nash–Sutcliffe coefficient (NS) and the difference of volume (Dv). In addition, the Pearson correlation coefficient (Lee Rodgers and Nicewander Citation1988) and the Kendall rank correlation (Kendall Citation1975; Kendall & Gibbons, Citation1990) tests were used (significance level, 5%) to evaluate the relationship between the measured and simulated daily discharges from 2000 to 2006, in the basin-wide and zone-wise applications of the SRM.
4.1. Basin-wide application
The daily discharges of Shyok River measured at Yogo flow gauge (), daily total precipitation and daily mean temperatures recorded at Skardu climate station (), and the daily SCA () were used as input variables for the basin-wide application of the model. The total catchment area and the hypsometric (area elevation) curve for the basin were also incorporated in SRM as basin characteristics.
Figure 5. Snow cover distribution (basin-wide) in the Shyok River basin estimated from MODIS snow images over a period of 2000–2006.
4.2. Zone-wise application
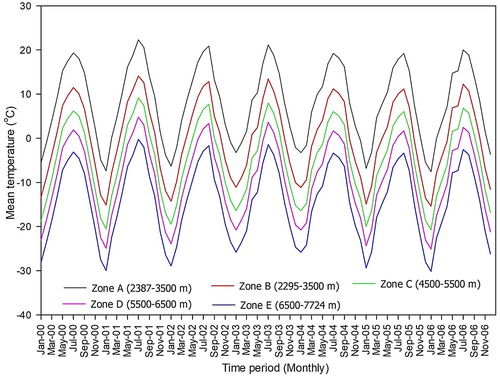
Zone-wise application of SRM requires that we divide the catchment area into different altitudinal zones (preferably each zone of 500 m). For the current study, we divided the Shyok basin into five elevation zones () with each zone of almost 1000 m. No ground observations in terms of mean daily temperature and precipitation were available above ∼2317 m ASL (elevation range of Zone A). Therefore, the mean daily temperature for all other zones (B–E) was estimated by extrapolating the data available in Zone ‘A’ using the global lapse rate value of 0.65°C 100–1 m (Barry Citation1992) over 2000–2006 period as shown in . SRM is more sensitive to the mean temperature and snow cover change than the precipitation input (Tahir et al. Citation2011), this is why daily total precipitation values recorded at Skardu climate station were used for all the elevation zones.
Figure 6. Monthly temperature variations in different elevation zones of the study area. The data for all the elevation zones are estimated from the actual data of neighbouring Skardu climate station by using the temperature lapse rate of 0.65°C/100 m.
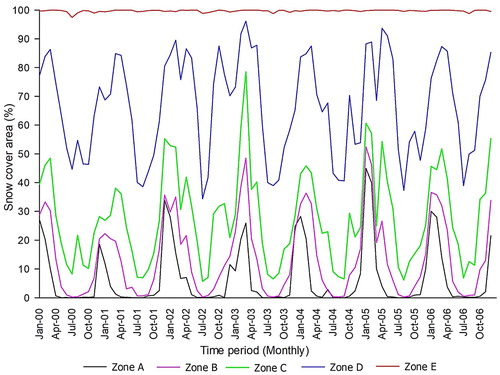
The daily SCA was estimated for all the elevation zones () as described in Section 3 to use for snowmelt runoff modelling over the period 2000–2006.
Figure 7. Snow cover distribution in five different altitudinal zones of the Shyok River basin estimated from the remotely sensed MODIS (MOD10A2) snow cover data.
4.3. Climate change scenarios
After the successful calibration and validation of the model over period 2000–2006, the SRM was applied to investigate the impact of climate variability on the Shyok River runoff by taking year 2000 as a baseline (current climate year). The different future climate scenarios for mean temperature and precipitation/SCA were used to study their impact on daily stream flow in the future for water resources management. These scenarios are selected from IPCC’s fifth assessment report (Stocker et al. Citation2013), some previous studies (Akhtar, Ahmad, and Booij Citation2008) and according to the trends found in the available climate data. These scenarios are described as follows:
The SCA is assumed to increase by 10% by 2050 and 20% by 2075 as a result of increasing winter precipitation (Akhtar, Ahmad, and Booij Citation2008) while the mean temperature of the catchment remains constant. A scenario of 10% decrease in SCA is also tested.
The mean temperature of the catchment is assumed to rise up to 1°C by 2025, 2°C by 2050, 3°C by 2075 and 4°C by 2100 (Stocker et al. Citation2013), keeping the other variables constant, particularly precipitation and the SCA. A 2°C decrease in temperature is also assumed until 2025.
Another scenario with a 3°C rise in mean temperature with a simultaneous 20% increased SCA (due to increase in winter precipitation) by 2075 is also investigated.
5. Results and discussion
The results obtained after the application of SRM to simulate the Shyok River runoff using basin-wide and zone-wise methods and to study the climate variability impacts on stream flow are presented below.
5.1. Basin-wide application of SRM
Basin-wide application of the SRM on Shyok River runoff gave satisfactory results for the hydrological years (starting on 1st April of each year) of 2000–2006 (), over the snow melt (April–September) period. Similar results for Hunza River basin have been shown by Tahir et al. (Citation2011).
Table 4. Efficiency of the basin-wide application of SRM over calibration and validation period (2000–2006) for the simulation of Shyok river discharge.
The NS coefficient values were ≥0.74 for the calibration period (2000–2002) and ≥0.63 for the validation period (2003–2006) as shown in . The Pearson and Kendall’s rank correlation coefficient values were ≥0.90 and ≥0.77, respectively, for the calibration period (2000–2002) and ≥0.86 and ≥0.67, respectively, for the validation period (2003–2006) () showing a strong correlation between the measured and simulated discharge and representing model’s capability for simulating daily discharge basin-wide for the Shyok River. Overall correlation values for the entire calibration period (2000–2002) were found to be 0.89 and 0.79 () for Pearson correlation and Kendall’s rank correlation, respectively, and these values were 0.87 and 0.72, respectively, for the validation period (2003–2006). Parametric values found when calibrating the snowmelt runoff model over the Shyok River basin are shown in .
Figure 8. Evaluation of basin-wise (BW) SRM application (2000–2006) to the Shyok River basin during the snowmelt period (April–September).
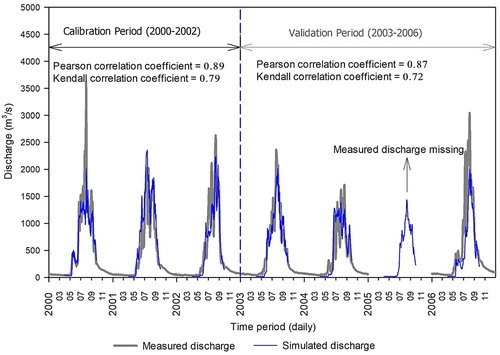
Table 5. Basin-wide parametric values for the successful simulation of Shyok river discharge for years 2000−2006.
5.2. Zone-wise application of SRM
The results obtained for the zone-wise application of SRM to simulate daily discharge of Shyok River show that the NS coefficient value was ≥0.72 and ≥0.74 () for the calibration and validation periods, respectively. The Pearson and Kendall’s rank correlation coefficient values of ≥0.86 and ≥0.76, respectively, for the calibration period (2000–2002) and ≥0.89 and ≥0.78, respectively, for the validation period (2003–2006) () showing a strong correlation between the measured and simulated discharge proving the model to have a remarkable tendency of discharge simulation for high elevation catchments where SCA has a profound impact on the river discharge.
Table 6. Efficiency of the zone-wise application of SRM over calibration and validation period (2000–2006) for the simulation of Shyok river discharge.
The Pearson and Kendall’s correlation coefficient values of measured and simulated discharge for the overall calibration period (2000–2002) () were found to be 0.90 and 0.73, respectively, and for the validation period (2003–2006) () these were found to be 0.93 and 0.80, respectively, presenting a strong correlation amongst the measured and the simulated discharge values for Shyok River. Parametric values found when calibrating the snowmelt runoff model zone-wise over the Shyok River basin are shown in .
Figure 9. Evaluation of zone-wise SRM application (2000–2006) to the Shyok River basin during the snowmelt period (April–September).
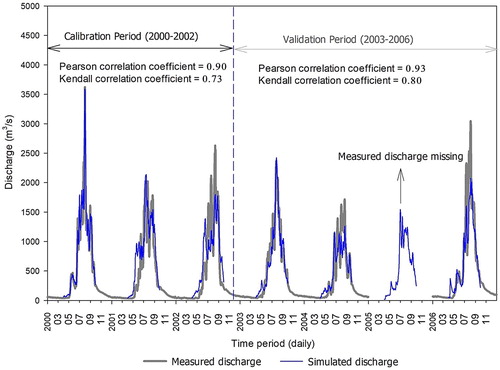
Table 7. Zone-wise parametric values for the successful simulation of Shyok river discharge for years 2000−2006.
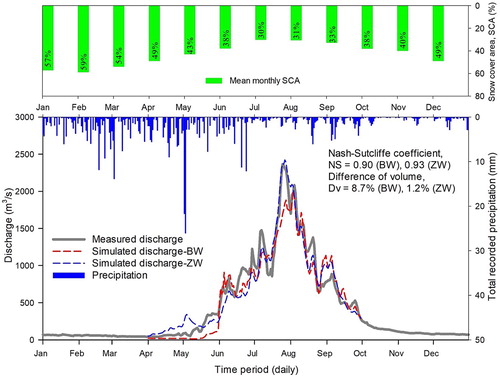
Overall efficiency of the zone-wise application () was better than the basin-wide application () on both the calibration and validation periods. The basin-wide and zone-wise simulated discharge data for the year 2003 were plotted with measured discharge to compare their efficiency () and they show NS coefficient values of 0.90 (BW) and 0.93 (ZW). Difference in the volume of discharge was 8.7% and 1.2% for basin-wide and zone-wise simulations, respectively (). It proves that the zone-wise application performs better than the basin-wide application of SRM in high-altitude catchments.
Figure 10. Evaluation of basin-wide (BW) and zone-wise (ZW) SRM application over the hydrological year 2003 in the Shyok River basin. Upper panel shows the variation in mean monthly SCA for a hydrological year in the catchment.
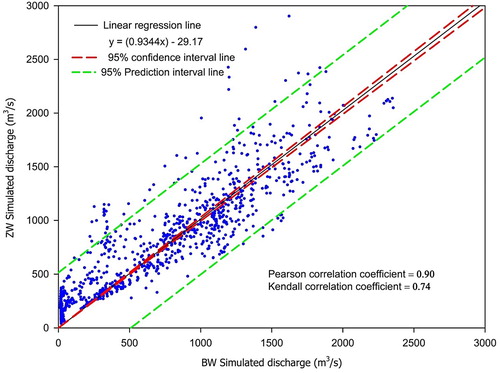
The basin-wide and zone-wise simulated discharge for the entire time period (2000–2006) was plotted against each other to estimate their agreement with each other and it shows a strong correlation with Pearson and Kendall’s correlation coefficient values of 0.90 and 0.74 (), respectively.
Figure 11. Comparison of basin-wide (BW) and zone-wise (ZW) simulated runoff by applying the SRM over the years (2000–2006).
5.3. Simulation of Shyok River runoff under future climate variability using SRM
The impact of climatic variability on the Shyok River runoff was investigated using the SRM under some future climate scenarios described in Section 4. The simulated discharge in year 2000 was used as the reference for the present climate.
According to the first scenario, the SCA was assumed to increase by 10% up till 2050 and 20% up till 2075 as a result of increasing precipitation while the mean temperature of the catchment remains constant. The impact of a 10% decrease in the SCA of the catchment on the Shyok River discharge was also studied. The obtained results reveal an increase in mean summer (April–September) stream flow with increased SCA. A 10% increase in the SCA consequences in approximately ∼11% (∼74 m3/s) rise in mean summer discharge and a 20% snow cover augment may yield a ∼20% (∼129 m3/s) mean summer discharge increase as compared to the present mean summer discharge (∼650 m3/s) ( and ). The mean summer discharge declines by ∼8% (∼53 m3/s) with an assumed 10% decrease in snow cover ( and ). This reflects that a 1% increase in SCA in the Shyok catchment can result in an increase of the mean summer discharge up to ∼1.14%, that is, ∼7.4 m3/s. Similar impact of increase in snow cover (1% increase) on the Hunza River basin studied by Tahir et al. (Citation2011) was found where an increase of 0.7% in the mean summer discharge was reported.
In the second scenario applied to the SRM, mean temperature of the catchment was assumed to rise up to 1°C by 2025, 2°C by 2050, 3°C by 2075 and 4°C by 2100, keeping the other variables constant, particularly precipitation and the SCA. A 2°C decrease in temperature was also taken into account. The results indicated that a 1°C, 2°C, 3°C and 4°C rise in temperature will cause an increase of approximately ∼26% (167 m3/s), ∼54% (349 m3/s), ∼81% (530 m3/s), and ∼114% (740 m3/s), respectively ( and ; ) in the mean summer discharge (April–September) where similar summer discharge pattern and management have been suggested in Hunza River basin by Tahir et al. (Citation2011). However, the same future climate scenario studied by Archer (Citation2003) and Akhtar, Ahmad, and Booij (Citation2008) using different statistical method and hydrological model from the present study has seen a 16% corresponding increase in summer discharge with 1°C increase in temperature in Shyok River basin. Reason for different results may be the different approach used in their study. A 2°C reduction in temperature of Shyok River catchment is observed to reduce the summer discharge by ∼36% (232 m3/s) ( and ; ). A 2°C drop off in temperature shows a coinciding decrease in the summer discharge of Shyok River which can be well-attributed to the decreased snowmelt in summer months, posing a direct impact on summer discharge of the river.
A climate change picture of 3°C rise in temperature with a simultaneous 20% increase in SCA of the catchment is also taken into account, which reveals a remarkable increase of ∼118% (768 m3/s) ( and ; ) in river discharge. The rise in temperature, if couples with an increased winter precipitation, can lead to a stability of cryosphere in the study area. In this regard, quite a few studies have shown a glacio-hydrological response along the east–west transect of the HKH related to the climatic changes where the glaciers in the Eastern Himalaya exhibit recoil and negative mass balance and glaciers in the Karakoram and northwestern Himalaya show signs of a positive mass balance over the last few decades (Bolch et al. Citation2012; Yao et al. Citation2012).
Figure 12. Mean monthly discharge simulations in the Shyok River under the SCA change scenarios. Discharge measured for year-2000 is used as current discharge.
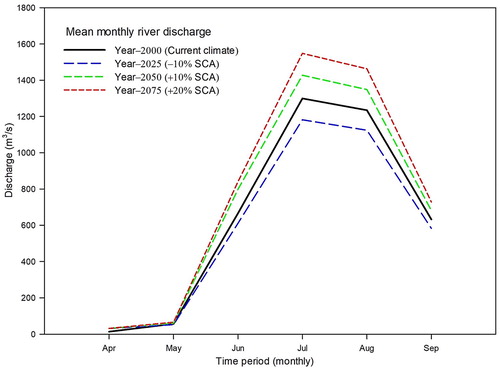
Figure 13. Monthly discharge simulations in the Shyok River for different climate change (mean temperature) scenarios. Discharge simulated for 2000 with the SRM is used as current discharge.
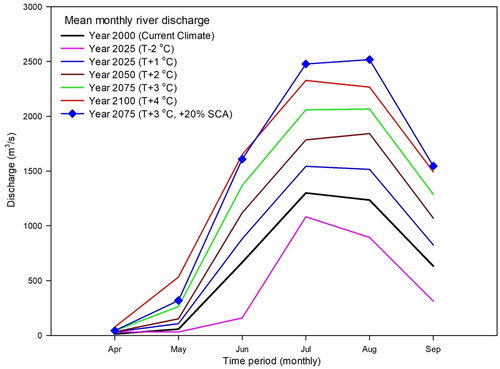
Figure 14. Change in mean seasonal (summer) discharge (δQ) under future scenarios of change in mean temperature (δTavg) and mean SCA (δSCA).
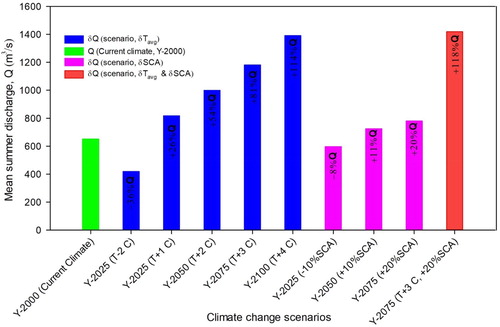
Table 8. Change in mean seasonal (summer) discharge under future scenarios of change in mean temperature (Tavg) and mean SCA.
Results of the simulated Shyok River discharge using SRM under various scenarios of climate change in this study are summarized in and .
6. Conclusion
The Shyok River, being one of the major tributary of Indus River, flows from the mighty HKH range. The primary source of discharge to the Shyok River is the melting of snow and glacial reserves lying upstream and causes a major effect on the water availability for multiple purposes downstream. Following conclusions can be found from the results of this study:
The SRM based on a DDF can efficiently simulate the daily discharge in the snow and glacier-fed catchments of the UIB. The SRM’s competence in high-altitude catchments is seen to be enhanced by using the MOD10A2 remotely sensed snow products as input to the model for water-equivalent production. SRM has revealed a potential of simulating daily discharge through both the basin-wide and zone-wise applications, but zone-wise application proves to be slightly better than the basin-wide application.
The investigation of the climate change impact on the river runoff indicates that the basin’s hydrological behaviour will modify under different climate change scenarios. Summer snowmelt runoff is likely to increase consequently with the mean temperature and snow cover increase which plays a key role for water supplies of downstream regions in Pakistan. The availability of the snowmelt runoff seems to shift earlier accordingly with the mean temperature rise in the spring. However, if the scenario of increase in mean temperature comes true, the glaciers of the region may disappear after producing huge volume of water for next few years.
If these scenarios come true, then the new reservoirs may be essential for the summer flow storage to meet the requirements for additional irrigation provisions, escalating power-generation demand, flood control and water supply in the future. Despite the fact that the climate scenarios assumed in this study were derived from prior studies, they endow with valuable information to supervise and handle water assets for the country’s future requirements. Climate change will categorically influence the temporal and spatial accessibility of water resources globally but the impacts in the UIB remain unclear. Many authors (Berthier et al. Citation2007; Immerzeel, van Beek, and Bierkens Citation2010; Shrestha and Shrestha Citation2004) have stated a substantial retreat and depletion of glacier volume across the HKH region. Immerzeel, van Beek, and Bierkens (Citation2010) indicated that upstream snow and ice reserves of the Indus basin (vital in nourishing seasonal water availability) are probably to be influenced markedly by climate change, but to what magnitude is yet undecided.
The snowmelt runoff modelling of the Shyok River discharge for flood risk assessment may prove significant for the hydrologists and risk managers for necessary planning and infrastructure development. Application of the SRM to the other snow-fed sub-catchments of the UIB may assist manage the integrated water resources of the Indus River irrigation system efficiently.
Acknowledgements
The authors extend their thanks to the WAPDA and the PMD for sharing the hydrological and meteorological data, respectively. The authors also wish to thank NASA and Japan’s Ministry of the Economy, Trade and Industry (METI) for providing ASTER GDEM.
Disclosure statement
No potential conflict of interest was reported by the authors.
ORCID
Muhammad Yasir http://orcid.org/0000-0003-0198-9044
References
- Akhtar, Muhammad, Nasir Ahmad, and M. J. Booij. 2008. “The Impact of Climate Change on the Water Resources of Hindukush Karakorum Himalaya Region Under Different Glacier Coverage Scenarios.” Journal of Hydrology 355 (1): 148–163. doi: 10.1016/j.jhydrol.2008.03.015
- Akyurek, Zuhal, Dorothy K. Hall, George A. Riggs, and Aynur Sensoy. 2010. “Evaluating the Utility of the ANSA Blended Snow Cover Product in the Mountains of Eastern Turkey.” International Journal of Remote Sensing 31 (14): 3727–3744. doi:10.1080/01431161.2010.483484.
- Archer, David. 2003. “Contrasting Hydrological Regimes in the Upper Indus Basin.” Journal of Hydrology 274 (1): 198–210. doi: 10.1016/S0022-1694(02)00414-6
- Arendt, A., A. Bliss, T. Bolch, J. G. Cogley, A. S. Gardner, J.-O. Hagen, R. Hock, et al. 2015. Randolph Glacier Inventory – A Dataset of Global Glacier Outlines: Version 5.0. Global Land Ice Measurements from Space. Boulder Colorado, USA: Digital Media.
- Barry, Roger Graham. (1992). Mountain Weather and Climate. London: Psychology Press.
- Berthier, Etienne, Yves Arnaud, Rajesh Kumar, Sarfaraz Ahmad, Patrick Wagnon, and Pierre Chevallier. 2007. “Remote Sensing Estimates of Glacier Mass Balances in the Himachal Pradesh (Western Himalaya, India).” Remote Sensing of Environment 108 (3): 327–338. doi: 10.1016/j.rse.2006.11.017
- Bolch, Tobias, Anil Kulkarni, Andreas Kääb, Christian Huggel, Frank Paul, J. G. Cogley, … Marlene Scheel. 2012. “The State and Fate of Himalayan Glaciers.” Science 336 (6079): 310–314. doi: 10.1126/science.1215828
- Bookhagen, Bodo, and Douglas W. Burbank. 2010. “Toward a Complete Himalayan Hydrological Budget: Spatiotemporal Distribution of Snowmelt and Rainfall and Their Impact on River Discharge.” Journal of Geophysical Research 115 (F3), F03019. doi:10.1029/2009JF001426.
- Butt, Mohsin Jamil, and Muhammad Bilal. 2011. “Application of Snowmelt Runoff Model for Water Resource Management.” Hydrological Processes 25 (24): 3735–3747. doi:10.1002/hyp.8099.
- Dey, B., V. K. Sharma, and A. Rango. 1989. “A Test of Snowmelt-runoff Model for a Major River Basin in Western Himalayas.” Hydrology Research 20 (3): 167–178. doi: 10.2166/nh.1989.0013
- Engman, E. T., A. Rango, and J. Martinec. 1989. “EXSRM, an Expert System for Snowmelt Runoff Model (SRM).” Paper presented at the New Directions for Surface Water Model (Proceedings of the Baltimore Symposium). Washington, DC: International Association of Hydrological Sciences.
- Farr, Tom G., Paul A. Rosen, Edward Caro, Robert Crippen, Riley Duren, Scott Hensley, … , Ladislav Roth. 2007. “The Shuttle Radar Topography Mission.” Reviews of Geophysics 45 (2), RG2004. doi:10.1029/2005RG000183.
- Georgievsky, M. V. 2009. “Application of the Snowmelt Runoff Model in the Kuban River Basin Using MODIS Satellite Images.” Environmental Research Letters 4 (4): 045017. doi: 10.1088/1748-9326/4/4/045017
- Guo, Wanqin, Shiyin Liu, Junli Xu, Lizong Wu, Donghui Shangguan, Xiaojun Yao, … , Zongli Jiang. 2015. “The Second Chinese Glacier Inventory: Data, Methods and Results.” Journal of Glaciology 61 (226): 357–372. doi: 10.3189/2015JoG14J209
- Hall, D. K., and G. A. Riggs. 2007. “Accuracy Assessment of the MODIS Snow Products.” Hydrological Processes 21 (12): 1534–1547. doi:10.1002/hyp.6715.
- Hall, D. K., G. A. Riggs, and V. V. Salomonson. 2000. MODIS/Terra Snow Cover 8-day L3 Global 500m Grid V005. Boulder, CO: National Snow and Ice Data Center Digital Media.
- Hock, Regine. 2003. “Temperature Index Melt Modelling in Mountain Areas.” Journal of Hydrology 282 (1–4): 104–115. doi: 10.1016/S0022-1694(03)00257-9
- Immerzeel, W. W., P. Droogers, S. M. De Jong, and M. F. P. Bierkens. 2009. “Large-scale Monitoring of Snow Cover and Runoff Simulation in Himalayan River Basins Using Remote Sensing.” Remote Sensing of Environment 113 (1): 40–49. doi: 10.1016/j.rse.2008.08.010
- Immerzeel, W. W., F. Pellicciotti, and M. F. P. Bierkens. 2013. “Rising River Flows Throughout the Twenty-first Century in Two Himalayan Glacierized Watersheds.” Nature Geoscience 6 (9): 742–745. doi:10.1038/ngeo1896.
- Immerzeel, W. W., L. P. H. van Beek, and M. F. P. Bierkens. 2010. “Climate Change Will Affect the Asian Water Towers.” Science 328 (5984): 1382–1385. doi:10.1126/science.1183188.
- Immerzeel, W. W., L. P. H. van Beek, M. Konz, A. B. Shrestha, and M. F. P. Bierkens. 2012. “Hydrological Response to Climate Change in a Glacierized Catchment in the Himalayas.” Climatic Change 110 (3-4): 721–736. doi: 10.1007/s10584-011-0143-4
- Kendall, M. G. 1975. Rank Correlation Methods. 4th ed. London: Charles Griffin.
- Kendall, M. G., and J. D. Gibbons. (1990). Rank Correlation Methods. 5th ed. Translated by J. D. Gibbons. London: Edward Arnold.
- Konz, M., S. Uhlenbrook, L. Braun, A. Shrestha, and S. Demuth. 2007. “Implementation of a Process-based Catchment Model in a Poorly Gauged, Highly Glacierized Himalayan Headwater.” Hydrology and Earth System Sciences Discussions 11 (4): 1323–1339. doi: 10.5194/hess-11-1323-2007
- Kustas, William P., Albert Rango, and Remko Uijlenhoet. 1994. “A Simple Energy Budget Algorithm for the Snowmelt Runoff Model.” Water Resources Research 30 (5): 1515–1527. doi: 10.1029/94WR00152
- Lee Rodgers, Joseph, and W. Alan Nicewander. 1988. “Thirteen Ways to Look at the Correlation Coefficient.” The American Statistician 42 (1): 59–66. doi:10.1080/00031305.1988.10475524.
- Lee, Songweon, Andrew G. Klein, and Thomas M. Over. 2005. “A Comparison of MODIS and NOHRSC Snowcover Products for Simulating Streamflow Using the Snowmelt Runoff Model.” Hydrological Processes 19 (15): 2951–2972. doi: 10.1002/hyp.5810
- Liang, Tian Gang, Xiao Dong Huang, Cai Xia Wu, Xing Yuan Liu, Wen Long Li, Zheng Gang Guo, and Ji Zhou Ren. 2008. “An Application of MODIS Data to Snow Cover Monitoring in a Pastoral Area: A Case Study in Northern Xinjiang, China.” Remote Sensing of Environment 112 (4): 1514–1526. doi: 10.1016/j.rse.2007.06.001
- Ma, Hong, and Guodong Cheng. 2003. “A Test of Snowmelt Runoff Model (SRM) for the Gongnaisi River Basin in the Western Tianshan Mountains, China.” Chinese Science Bulletin 48 (20): 2253–2259. doi: 10.1007/BF03182862
- Martinec, J. 1975. “Snowmelt-runoff Model for Stream Flow Forecasts.” Nordic Hydrology 6 (3): 145–154. doi: 10.2166/nh.1975.0010
- Martinec, Jaroslav, Albert Rango, Ralph Roberts, Michael F. Baumgartner, and Gabriela M Apfl. 1998. Snowmelt Runoff Model (SRM) User’s Manual. Department of Geography, University of Berne, Berne, Switzerland.
- Maurer, Edwin P., Joshua D. Rhoads, Ralph O. Dubayah, and Dennis P. Lettenmaier. 2003. “Evaluation of the Snow-covered Area Data Product from MODIS.” Hydrological Processes 17 (1): 59–71. doi:10.1002/hyp.1193.
- Mukhopadhyay, Biswajit, and Aniruddha Dutta. 2010. “A Stream Water Availability Model of Upper Indus Basin Based on a Topologic Model and Global Climatic Datasets.” Water Resources Management 24 (15): 4403–4443. doi: 10.1007/s11269-010-9666-0
- Mukhopadhyay, Biswajit, and Asif Khan. 2014. “Rising River Flows and Glacial Mass Balance in Central Karakoram.” Journal of Hydrology 513: 192–203. doi: 10.1016/j.jhydrol.2014.03.042
- Naeem, Usman Ali, Hashim Nisar Hashmi, and Abdul Sattar Shakir. 2013. “Flow Trends in River Chitral due to Different Scenarios of Glaciated Extent.” KSCE Journal of Civil Engineering 17 (1): 244–251. doi: 10.1007/s12205-013-1978-1
- Nuimura, T., A. Sakai, K. Taniguchi, H. Nagai, D. Lamsal, S. Tsutaki, and K. Fujita. 2015. “The GAMDAM Glacier Inventory: A Quality-controlled Inventory of Asian Glaciers.” The Cryosphere 9 (3): 849–864. doi:10.5194/tc-9-849-2015.
- Panday, Prajjwal K., Christopher A. Williams, Karen E. Frey, and Molly E. Brown. 2014. “Application and Evaluation of a Snowmelt Runoff Model in the Tamor River Basin, Eastern Himalaya Using a Markov Chain Monte Carlo (MCMC) Data Assimilation Approach.” Hydrological Processes 28 (21): 5337–5353. doi: 10.1002/hyp.10005
- Prasad, Vajja Hari, and Partha Sarathi Roy. 2005. “Estimation of Snowmelt Runoff in Beas Basin, India.” Geocarto International 20 (2): 41–47. doi: 10.1080/10106040508542344
- Pu, Zhaoxia, Li Xu, and Vincent V. Salomonson. 2007. “MODIS/Terra Observed Seasonal Variations of Snow Cover Over the Tibetan Plateau.” Geophysical Research Letters 34 (6), L06706. doi:10.1029/2007GL029262.
- Ragettli, S., F. Pellicciotti, W. W. Immerzeel, E. S. Miles, L. Petersen, M. Heynen, J. M. Shea et al. 2015. “Unraveling the Hydrology of a Himalayan Catchment Through Integration of High Resolution In Situ Data and Remote Sensing with an Advanced Simulation Model.” Advances in Water Resources 78: 94–111. doi:10.1016/j.advwatres.2015.01.013.
- Rango, Albert, Jaroslav Martinec, and Ralph Roberts. 2008. “Relative Importance of Glacier Contributions to Water Supply in a Changing Climate.” World Resource Review 20 (3): 233–251.
- Roohi, Rakhshan. (2006). “Glaciers and Glacial Lakes of Karakoram Range of Pakistan.” Paper presented at the GIS-IDEAS, Ho Chi Minh City, Vietnam. http://wgrass.media.osaka-cu.ac.jp/gisideas06/viewabstract.php?id=107.
- Savéan, Marie, François Delclaux, Pierre Chevallier, Patrick Wagnon, Nahossio Gonga-Saholiariliva, Rajendra Sharma, … Yves Arnaud. 2015. “Water Budget on the Dudh Koshi River (Nepal): Uncertainties on Precipitation.” Journal of Hydrology 531: 850–862. doi: 10.1016/j.jhydrol.2015.10.040
- Seidel, Klaus, Jaroslav Martinec, and Michael F. Baumgartner. 2000. “Modeling Runoff and Impact of Climate Change in Large Himalayan Basins.” Paper presented at the International Conference on Integrated Water Resources Management (ICIWRM).
- Sharma, Vaibhav, Varunendra Dutta Mishra, and Pawan Kumar Joshi. 2013. “Implications of Climate Change on Streamflow of a Snow-fed River System of the Northwest Himalaya.” Journal of Mountain Science 10 (4): 574–587. doi: 10.1007/s11629-013-2667-8
- Shrestha, Arun B., and Raju Aryal. 2011. “Climate Change in Nepal and Its Impact on Himalayan Glaciers.” Regional Environmental Change 11 (1): 65–77. doi: 10.1007/s10113-010-0174-9
- Shrestha, Madan Lall, and Arun Bhakta Shrestha. 2004. “Recent Trends and Potential Climate Change Impacts on Glacier Retreat/Glacier Lakes in Nepal and Potential Adaptation.” Paper presented at the presentation by ML Shrestha, Director of the Department of Hydrology and Meteorology of Nepal, at the OECD Global Forum on Sustainable Development, Paris.
- Sirguey, Pascal, Renaud Mathieu, and Yves Arnaud. 2009. “Subpixel Monitoring of the Seasonal Snow Cover with MODIS at 250m Spatial Resolution in the Southern Alps of New Zealand: Methodology and Accuracy Assessment.” Remote Sensing of Environment 113 (1): 160–181. doi: 10.1016/j.rse.2008.09.008
- Stocker, T. F., D. Qin, G. K. Plattner, M. Tignor, S. K. Allen, J. Boschung, … , B. M. Midgley. 2013. “IPCC, 2013: Climate Change 2013: The Physical Science Basis.” Contribution of Working Group I to the Fifth Assessment Report of the Intergovernmental Panel on Climate Change, pp. 1535.
- Tahir, Adnan Ahmad, Pierre Chevallier, Yves Arnaud, Muhammad Ashraf, and Muhammad Tousif Bhatti. 2015. “Snow Cover Trend and Hydrological Characteristics of the Astore River Basin (Western Himalayas) and its Comparison to the Hunza Basin (Karakoram Region).” Science of The Total Environment 505: 748–761. doi:10.1016/j.scitotenv.2014.10.065.
- Tahir, Adnan Ahmad, Pierre Chevallier, Yves Arnaud, Luc Neppel, and Bashir Ahmad. 2011. “Modeling Snowmelt-Runoff Under Climate Scenarios in the Hunza River Basin, Karakoram Range, Northern Pakistan.” Journal of Hydrology 409 (1–2): 104–117. doi: 10.1016/j.jhydrol.2011.08.035
- Tekeli, A. Emre, Zuhal Akyurek, A. Arda Åžorman, Aynur Åžensoy, and A. Ãœnal Åžorman. 2005. “Using MODIS Snow Cover Maps in Modeling Snowmelt Runoff Process in the Eastern Part of Turkey.” Remote Sensing of Environment 97 (2): 216–230. doi: 10.1016/j.rse.2005.03.013
- Wang, Xianwei, Hongjie Xie, Tiangang Liang, and Xiaodong Huang. 2009. “Comparison and Validation of MODIS Standard and new Combination of Terra and Aqua Snow Cover Products in Northern Xinjiang, China.” Hydrological Processes 23 (3): 419–429. doi: 10.1002/hyp.7151
- World Meteorological Organization. 1986. Intercomparison of Models of Snowmelt Runoff. Geneva: Secretariat of the World Meteorological Organization.
- Yao, Tandong, Lonnie Thompson, Wei Yang, Wusheng Yu, Yang Gao, Xuejun Guo, and Baiqing Xu. 2012. “Different Glacier status with Atmospheric Circulations in Tibetan Plateau and Surroundings.” Nature Climate Change 2 (9): 663–667. doi: 10.1038/nclimate1580
- Zhang, Guoqing, Hongjie Xie, Tandong Yao, Hongyi Li, and Shuiqiang Duan. 2014. “Quantitative Water Resources Assessment of Qinghai Lake Basin Using Snowmelt Runoff Model (SRM).” Journal of Hydrology 519: 976–987. doi:10.1016/j.jhydrol.2014.08.022.
- Zhang, Yong, Shiyin Liu, and Yongjian Ding. 2006. “Observed Degree-day Factors and Their Spatial Variation on Glaciers in Western China.” Annals of Glaciology 43 (1): 301–306. doi: 10.3189/172756406781811952