
ABSTRACT
It has been two decades since virtual geographic environments (VGEs) were initially proposed. While relevant theories and technologies are evolving, data organization models have always been the foundation of VGE development, and they require further exploration. Based on the comprehensive consideration of the characteristics of VGEs, geographic scene is proposed to organize geographic information and data. We empirically find that geographic scene provides a suitable organization schema to support geo-visualization, geo-simulation, and geo-collaboration. To systematically investigate the concept and method of geographic scene, Geographic Scenario is proposed as the theory on developing geographic scene, and corresponding key issues of the Geographic Scenario are illustrated in this article. Prospects of the proposed method are discussed with the hope of informing future studies of VGEs.
1. Data organization issues in VGEs
Cognition helps us to acquire information, form images and draw conclusions about the world around us. The cognition process divides the world into three elements: subjects, objects, and the medium, which is used to transfer information from the object to the subject. The content that a medium can load, the information organization strategy of the medium, and the expression mode are three key factors that can affect the capacity of a medium and influence the efficiency of the cognition process. Although language, characters, and gestures can be regarded as natural mediums that help humans improve their knowledge of the world, assistive tools have played an undeniably and increasingly important role in knowledge acquisition. For example, maps, geographic information systems (GISs) and virtual geographic environments (VGEs) are three typical types of mediums that are used to transfer geographic information. From maps to GISs and then to VGEs, the evolution process (see ) suggests that such types of mediums are developed to meet the increasing requirements of human cognition.
Figure 1. Geographic information mediums and the corresponding theories for human cognition.
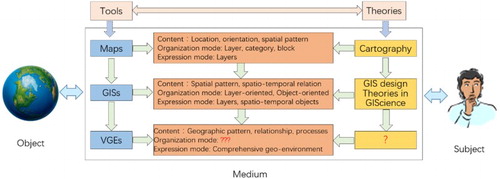
Maps, in both material and electronic form, are mainly used to describe the spatiotemporal attributes of geographic objects and their spatial patterns, while GISs employ spatial analysis to illustrate the spatiotemporal relationships among different objects, which can be regarded as a key function that beyond map. However, in addition to determining ‘where’, ‘when’, and ‘what’, establishing ‘how’ and ‘why’ has become increasingly important in analyses of the geographic world. Thus, in addition to time, location, spatiotemporal attributes, and relationships, explaining how and why the geographic world forms in a particular way has raised new challenges in the design of such mediums, and thus resulting in VGEs (Chen, Lin, and Lu Citation2017).
The development of VGEs aims at encompassing and mapping geographic information related to dynamic processes and comprehensive phenomena in virtual environments, thereby helping humans to gain a deeper understanding of the real world through virtual mirrors (Lin, Chen, and Lu Citation2013; Lin et al. Citation2013). Based on these objectives, both the content and expression modes of VGEs are expected to be more sophisticated than those of traditional maps and GISs. The development of VGEs has attracted the attention of an increasing number of geographic researchers (e.g. Konecny Citation2011; Torrens Citation2015a, Citation2015b; Rink et al. Citation2016; Batty, Lin, and Chen Citation2017). Specifically, numerous studies have focused on the interactive channels of VGEs (e.g. Batty Citation2008; Chen et al. Citation2008, Citation2013b; Che, Lin, and Hu Citation2011; Lai et al. Citation2011; Priestnall et al. Citation2012) and collaborative work modes based on VGEs (e.g. Zhu et al. Citation2007; Hui et al. Citation2010; Xu et al. Citation2011; Chen et al. Citation2012; Li et al. Citation2015; Zhu et al. Citation2016). Recently, geographic modeling and simulation using VGEs has gained considerable attention associated with rebuilding and predicting dynamic virtual geographic processes and solving the problems of traditional GISs, such as having limited capacities to support comprehensive quantitative analysis (Chen et al. Citation2015; Lin et al. Citation2015). Geographic analysis models can be imported into VGEs for such analyses. These models include Earth system models that closely couple the atmosphere, oceans, land, ice, biosphere, and other components for global assessments and forecasting applications (e.g. Flato Citation2011; Yuan et al. Citation2011; Arora et al. Citation2013; Heavens, Ward, and Mahowald Citation2013; Xia et al. Citation2014; Clark et al. Citation2015; Smith et al. Citation2016), as well as other multidisciplinary models (e.g. the Soil and Water Assessment Tool and the Weather Research and Forecasting Model), in regional and local studies. In a comprehensive simulations, the latter types of models can be integrated in a loosely coupled manner (e.g. Chen et al. Citation2011b; Granell, Schade, and Ostländer Citation2013; Laniak et al. Citation2013; Voinov and Shugart Citation2013; Wen et al. Citation2013, Citation2016; Yue et al. Citation2016). The above methods can be used in VGEs to allow both researchers and the public to analyze unknown geographic phenomena or unreached spaces and explore geographic laws and rules. However, one ‘cannot make bricks without straw’, and data preparation and organization are foundational key issues in the realization of these functions, regardless of the use of simulations, expressions, or collaborations. In VGEs, which are a new type of geographic information medium, the basic question of how to organize geographic information properly for dynamic and complex virtual environments construction and the support of geographic cognition is still being explored (Lu Citation2011; Lü et al. Citation2015).
The geographic environment can be defined based on three characteristics: (1) the terrestrial and natural environment of human society; (2) the sphere of direct interaction between nature and society; and (3) the temporal changes in the scope and content of the geographic environment (The Great Soviet Encyclopedia Citation1970–1979). The above description suggests that physical (e.g. soil and water) and human (e.g. human behavior and social activities) factors comprise a complete geographic world, and these two components are the major research subjects of geography. In addition to the locations and spatial distributions, the interactions and relationships among different elements are also important for better understanding geographic environments, especially the evolution of geographic processes and dynamic phenomena. Moreover, we normally examine geographic environments using landscapes because they are visible and easily to be described. However, in the real world, with the improvement of our cognition, sound-, light-, and even electromagnetic-scapes also surround us. All of these scapes form a complete geographic environment. Accordingly, as the scope and content of the geographic environments increases, traditional methods of information recording should be improved and extended to cover additional content when necessary. Although many GIS data models have been proposed, further discussion and analysis are required to fully satisfy the description of the geographic environment in VGEs and contribute to VGE analyses and simulations (Yue et al. Citation2015).
First, although spatiotemporal information can be defined broadly as any information in any space at any time, currently, it is generally narrowly defined as information about a specific location in space and time. Geographic information contains more information beyond just a location; thus, the content extends beyond commonly used spatiotemporal information. Current geographic data models have mainly been designed based on the abstraction of the spatiotemporal attributes and the relationships among geographic objects because the main functions of GISs are geographic expression and spatial analysis. Interactive relationships (e.g. actions and reactions or the relationship between the soil and water in an erosion process) and other attributes (e.g. physical, chemical, and biological attributes) have often been neglected in previous data models. The exclusion of these relationships has made it difficult for current GISs to support geographic simulations and computations.
Second, many geographic data models originate from cartographic representations and maps. In these cases, data are primarily organized according to different layers and attributes. Although this design philosophy is convenient for data classification and storage, it divides the geographic environments into separate pieces. Recently, object-oriented data models have been developed to describe the geographic world using different objects, but the capacity to describe the evolution processes of these objects and interaction relations must be further improved. Moreover, the storage of geographic data in layers or objects will result in the loss of efficiency when large amounts of data are required to construct comprehensive geographic environments.
Third, scale is an important issue in geographic research, especially in the development of multiscale virtual environments in VGEs (Zhang et al. Citation2014a, Citation2014b, Citation2015). Current data are often organized at a certain scale based on the collection methods, and different arithmetic and scale transformation methods (e.g. upscaling and downscaling) have been designed to prepare data at different scales. Before each application or simulation, the data preparation process in a multiscale analysis requires considerable time and resources (both human and computational resources) to generate suitable data at the corresponding scale. In the future, a unified data model that can store and describe the pan-spatial information from macrospaces to microdetails is needed to seamlessly support the geographic analysis at different scales (Zhou Citation2015).
2. From cartography to scenarios
Cartography is the study and practice of producing and using maps. Cartography adopts real geographic information and models it in maps to help humans understand where they are, how they are oriented, what objects are around them, etc. To date, methodologies such as projection, scaling, generalization, symbolic representation and visualization have been used in cartography to create different types of maps, from general to thematic, handmade to digital, and 2D to 3D. Modern cartography even constitutes many theoretical and practical foundations of GISs.
However, due to the limitations of display modes (e.g. from top to bottom) and publication mediums (e.g. in papers or planar devices), traditional maps are often used to express static spatiotemporal information and the associated patterns. With the increasing requirements of human cognition and the rapid development of data acquisition and processing methods, many people want to perceive and understand the world more deeply than ever, from visible to perceivable, from a top to bottom view to a side view or multiangle view, from outdoor to indoor, from the surface to underground, from the external form of an object to its internal structure, from 2D to 3D and even more dimensions, and from a static pattern to the dynamic processes of geographic phenomena and events. Cognition habits have changed toward to the natural mode of perception of humans in daily life, and the associated content has become much richer than that conveyed by traditional maps. Although GISs have been important in this transition, they originate from digital maps and have limited capacities to describe the dynamic aspects of the Earth’s surface that are continuously changing and evolving (Goodchild Citation2008; Bothwell and Yuan Citation2010). Moreover, GIS data models are based on a layer-oriented and object-oriented methods that cannot support the cognition of the complex world in a comprehensive way. Thus, the data organization mode and the problems discussed in Section 1 must be urgently addressed.
Here, we argue that organizing geographic information based on abstracted scenes would constitute a suitable organization mode. A scene is the result of humans perceiving the real world naturally, mainly through senses, and scenes can be used to form mental images of the world (Biederman, Mezzanotte, and Rabinowitz Citation1982; Rayner Citation1992; Henderson Citation2003). In fact, the real world is composed of different scenes that are combined with human, natural, static, dynamic, discrete, and continuous elements. For instance, when a baby is born, the first image he/she sees or feels is not a map with layer information or GISs with classified object information but several scenes with comprehensive content. For example, some people are walking around, smiling and talking to him/her; there may be a beautiful picture on a white wall; a fire is lit on the stove; and a bird is flying by a window before landing on a deciduous tree. These perceptions cannot be simply abstracted and represented by layers or static objects, which is why maps and GISs are not ideal for portraying such information. As an enhancement of the above two mediums, the main target of VGEs is to reflect the living world in a virtual way and contribute to a better understanding of the comprehensive world. Accordingly, the virtual environments in VGEs should be constructed to both satisfy natural perception habits and reflect the real world; thus, geographic scenes are the framework of such environments (Chen et al. Citation2013a).
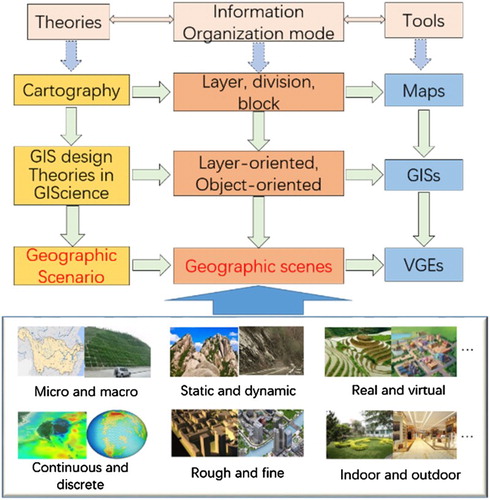
A geographic scene can be defined as a specific regional synthesis comprising both human and natural factors and their mutual relationships and interactions. A geographic scene has a specific structure and functions and is characterized by comprehensiveness (involving all types of geographic factors, such as water, soil, the atmosphere, biology, and human activities), multihierarchy (can support the description of a region at different hierarchical levels) and multidimensionality (2D, 3D, the temporal dimension, etc.). Thus, a geographic scene can convey rich geographic information to tell complete stories, including time, location, people, things, events, processes, and phenomena. There are different types of geographic scenes, including micro and macro, static and dynamic, real and virtual, 2D and 3D, continuous and discrete, rough and fine, and indoor and outdoor, etc. These scenes can be used to represent the historical, current, and even future geographic world. All of these geographic scenes are associated with information that can be further used to study spatial differentiation patterns, evolutionary processes, and the mechanisms of the interactions among various geographic elements.
In this case, as seen in , similar to the contribution of cartography to maps, foundational theories must be proposed to develop VGEs and organize geographic information by scenes. Here, we deem these foundational theories as Geographic Scenario, which can be used to develop and update cartography based on the rapid development of the latest technological innovations. Geographic Scenario is the theory of the study of geographical scenes, their construction methods, and their application. The aim of this approach is to use geographic scenes to reflect and reveal the spatial distribution/heterogeneity patterns, evolutionary processes, and relationships and interactions of natural and human factors on the Earth.
Figure 2. Geographic Scenario for current geographic information medium.
3. Key issues in the study of geographic scenario
Because geographic scenes are specific regional syntheses involving various geographic elements and processes, the associated construction theory, i.e. Geographic Scenario, may overlap and draw from multidisciplinary research fields such as geographic information science (GIScience), Earth science, biological science, and environmental science. As the scope of human cognition increases, the research objects and extents of Geographic Scenario will increasingly expand and will increase to the limits of what humans can reach and perceive, or even what cannot be perceived by humans but exists in the real world. In conclusion, based on a large number of research points in a system, this article attempts to explain Geographic Scenario theory using the following key processes.
3.1. Content classification
Geographic scenes convey and transfer information abstracted from the world to humans. Before building a geographic scene, the modeling and representation of content and objects should be thoroughly analyzed.
Historically, information used to describe the world has been generally regarded as narrow spatiotemporal information because spatiotemporal data are the main type of data that is used by maps, GISs and other information technology tools. Even in the area of GIScience, confusion exists regarding whether the content of geographic information is equal to that of spatiotemporal information (Longhorn and Blakemore Citation2008). The fact is, some types of geographic information that are not directly related to time and location are often ignored when describing the geographic world using maps or traditional GIS, including the mechanism of a landslide, the speed of a loess mud flow, and the effect of sunshine on trees during photosynthesis. In our minds, geographic information is partly, but not completely, related to spatiotemporal information. Because studies of the geographic world focus on spatial differentiation patterns, evolutionary processes, and the mechanisms of interactions, geographic information should have an implicit or explicit association with locations, times, processes, and relationships (not just spatiotemporal relationship).
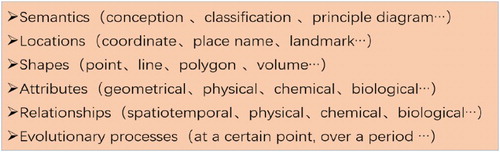
In summary, at least six elements of geographic information should be used to describe geographic scenes (): semantics, location, the shapes and attributes of geographic elements, the relationships among elements, and the related evolutionary processes.
Figure 3. A summary of the six elements of geographic information.
Semantics is the meaning of the descriptions of scenes and inner geographic elements. The term is domain related, and semantics are not field specific. Geographic semantics are concerned with providing theoretical and applied means of addressing the variations in geographic concepts and facilitating the creation and processing of information in understandable terms (Ballatore Citation2016). Thus, semantics preserve local conception across heterogeneous forms of abstracted geographic information (Janowicz, Scheider, and Adams Citation2013) and help humans to distinguish and exchange ideas related to the geographic world. Normally, conception and classification are both associated with semantics; another special schematic type is the principle diagram. Such diagrams can be represented using types of figures or tables to express the formation mechanism of a certain geographic process or phenomenon. For example, the principle diagram of a landslide includes the graphical representations of structures, influential factors, and formation mechanism of the slide.
In geography, location is used to identify a point, a polyline, or an area in the geographic world, explain where a geographic element is located, or illustrate where an event/process/phenomenon occurs. Corresponding to different coordinate systems, there are several types of locations, such as relative location, absolute location, locality location, and global location. Even the same object can be described using different locations at the same time.
The geometric shape is the geometric information that remains when location, scale, orientation, and reflection are removed from the description of a geometric element (Kendall Citation1984). Geographic elements are mainly abstracted into point, line, polygon, circle, and volume in traditional GIS when expressing and conducting spatial analyses.
A geographic attribute reflects the characteristics of a geographic element and is an important basis of element classification. In traditional GIS, the term attribute usually refers to records in a data table associated with individual features in a vector map or cells in a grid; thus, they can be used for spatial queries and analyses. To further understand how and why, attribute information must be extended in geographic simulations and modeling, and many physical, chemical, biological, and even cultural, social, and economic attributes should be used. For example, the attributes of soil may include the porosity, pH, chemical composition, microorganism populations, and pollution levels in analyses of the dynamic processes of soil pollution.
Similarly, various relationships exist among different geographic elements that are often used in traditional GIS, such as sequential, spatial, temporal, and spatiotemporal relationships. However, in the real geographic world, many other relationships exist beyond spatiotemporal relationships. For example, in a scene of a glowing sunset over a forest or glacial rivers irrigating small valley farm fields and orchards, there are physical, chemical, and biological interactions that can be regarded as relationships with directions among geographic elements. Moreover, in society, which is a component of the geographic environment, there are also relationships that record the interactions between cultural, social, and economic factors, and they can be used in geographic analyses and experiments (Bol Citation2012, Citation2013; He et al. Citation2013).
Evolutionary processes in geography describe changes or variations in geographic elements and phenomena. Every geographic element experiences an appearance, development, and extinction, and every geographic phenomenon originates, appears, develops, and ends, according to geographic laws and rules. In this case, the description of evolutionary processes naturally covers the expression of temporal information, which is regarded as another key component of geographic information. Evolutionary processes can be expressed using mathematical formulas, series of graphics and figures, or documented text. The temporal dimension is recorded and hidden in the description of processes. Among these methods, geographic process models can be regarded as extremely important because they can be used to illustrate, analyze, and predict abstract geographic processes (Torrens Citation2009; Clifford et al. Citation2016). In fact, geographic process models have long been regarded as the abstractions and representations of geographic phenomena and processes, and now, the geographic process model base, together with geographic database, have form two cores of VGEs (Lin and Xu Citation2007; Lin and Chen Citation2015). The management and usage (e.g. sharing and integration) of geographic process models will enable the construction of geographic scenes to reflect real and dynamic geographic environments. In this context, some theories and technologies can be employed as references (e.g. Wen et al. Citation2013; Zhang et al. Citation2016).
3.2. Logical abstraction
A geographic scene is a result of modeling the geographic world and its representation. Such scenes help humans to understand the world based on multiple views, scales, and themes. The logical abstraction of geographic scenes is the basic concept of Geographic Scenario and the development of VGEs.
When building a logical model of geographic scenes, the main objective is not only visually representing the geographic world in a specific manner but also performing advanced geographic modeling and simulation. Geographic characteristics and contents must be recorded in geographic scenes. Such characteristics include geofeatured classification (e.g. static or dynamic, vertical or horizontal, a specific domain, etc.), the relationships among scenes (e.g. nested relationships at different scales), the relationships between scenes and inner elements, and the evolutionary processes of both scenes and inner elements. To build such a logical model, the first step is to study the actual content and information that scenes will transfer to users. The characteristics of scenes should be analyzed, and the index system and strategies used for classification (e.g. according to the scale, structure, domain, and other properties) should be designed for the development of various scenes.
Second, a standard expression strategy should be designed to represent the contents of geographic scenes. Based on analyses of the elements, processes, and relationships in scenes, it is necessary to study the granularity of geographic elements to develop scenes at certain scales using decomposition and combing modes to improve scene transfer at different scales. The combination and decomposition of geographic scenes structures should be analyzed, and the multiscale hierarchy of different scenes at different scales thus can be defined for multilevel analysis and cognition. Logical geographic elements should be designed to describe the semantics, locations, shapes, and attributes of geographic elements; the relationships among elements; and the related evolutionary process. Based on these steps, the framework of the geographic scenes and their basic contents and associated processes can be preliminarily established.
Third, the constraint rules among scenes and various elements should be explored and summarized. In fact, in the real world, scenes and elements exist with preconditions, e.g. a door may only be installed at the entrance of a house or at the conjunction of two rooms, and a river should flow along the river banks. These constraints and preconditions are derived from the real world and reflect geographic laws and rules. Such constraints are also an important type of geographic knowledge that can be applied and imported using a geographic knowledge base when necessary. For example, a river should not flow upstream, and an underground stratum should not appear above a cloud. This information restricts the building process and layout of scenes and influences the construction of relationships in geographic scenes.
3.3. Data organization and storage strategies
A geographic scene is a familiar way for humans to understand the geographic world and exchange ideas (Davies and Peebles Citation2010). These scenes are abstractions of the real world and descriptions of similar conceptions in other related natural and social fields. Unlike traditional GIS data models that mainly focus on the organization of spatiotemporal information with related attributes, methods of organizing geographic scene data should be developed with consideration of daily cognition; thus, the time, location, people, objects, events, and processes must be recorded in the data model. Moreover, geographic laws and rules, which are essential in geographic analysis, should be seriously considered when designing the data model. Notably, five important concerns are discussed below.
First, the spatiotemporal framework should be designed. The spatiotemporal framework, which is similar to the coordinate systems, is used to determine the location and temporal information associated with geographic elements using corresponding coordinates. The determination of the spatiotemporal framework is very important for related spatiotemporal measurements and analysis (e.g. Lin Citation1997; Kwan Citation1998; Diggle Citation2013). However, in traditional spatiotemporal frameworks, spatiotemporal information is often recorded and expressed using discrete coordinates, which ignore the continuous parts. In fact, there are both discrete and continuous elements/processes/phenomena exist in geographic environments; thus, to reflect the real situation, an improved spatiotemporal framework should incorporate incorporate suitable tracking methods to enable the inclusion of both discrete and continuous content. In this case, the elements in this framework can be described as transitions between discrete and continuous processes at different scales. Therefore, the proposed geographic scenes must be organized as flexible multihierarchy structures and functions. Scenes can be grouped or coupled with other complex scenes at large scales, or they can be split into simple scenes at small scales. Here, corresponding to the contents of geographic scenes, the dimension of scale does not only rely on its geometrical features but also the associated scaled relationships and interactions (e.g. physical, chemical, and biological). In this case, although within a unified spatiotemporal framework, the organization of geographic scenes enables scenes to be split or aggregated at different scales for synthesis and comprehensive analysis. To realize this, on one hand, many coordinate systems currently exist, such as the Cartesian, polar, cylindrical and spherical coordinate systems; on the other hand, some spatiotemporal frameworks have been proposed for specific studies (i.e. Wang et al. Citation2011; Chen et al. Citation2011a). Based on studies of the spatiotemporal characteristics and features of the physical world (e.g. Massey Citation1999; Raper and Livingstone Citation2001), a spatiotemporal framework is needed that can represent geometric space and physical space in a unified way, i.e. a spatiotemporal view that can unify Newton’s absolute view and Einstein’s relative view, and create a unified coordinate system.
Second, the organizational structure, which is based on the object-oriented data framework and nested combination theory, should be designed to describe the multiscale hierarchy of scenes and the formation of their internal structures. Nested structures can be used to represent the relationships between geographic elements and scenes, elements and elements, and scenes and scenes. For instance, scene graph relationships can be used as a primary reference in 3D visualization, but such methods must be improved to satisfy the multihierarchical and nested structure requirements of the scene and ensure that both scenarios and elements can be described using a unified framework. Meanwhile, the spatiotemporal distribution patterns, interactive relationships among elements, and geographic evolutionary processes are meaningful for the organizational structures of geographic scenes. For example, different distribution patterns may cause different and diverse aggregation structures, various interactive relationships may result in diverse network relationships, and the associated evolutionary processes may change the previously formed structures over time.
Third, when performing geographic analysis and simulation with geographic scenes that constructed with mass geographic data, an effective data indexing strategy is also needed. In traditional GISs, conflicts exist between the multidimensional data organization mode and the 1D linear storage/addressing mode of a computer, as well as between the inhomogeneous distribution of geographic elements and the homogeneous distribution of the internal and external storage spaces, which greatly affect the efficiency of queries and searches. By organizing data using geographic scenes according to geographic rules, the data indexing can be designed based on these characteristics rather than the characteristics of a computer’s memory. For example, geographic elements in geographic scenes can be represented as they are in the real world; thus, spatiotemporal contiguity and dispersibility can be used as a basis for design indexing with a synthetic consideration of the nested structures of scenes, relationships of geographic elements, and data volumes.
Fourth, in traditional systems, data are mainly stored using layers or blocks, which split the overall relationships between the different geographic elements and scenes. Moreover, it is difficult for a relational database to store geographic scenes because geographic scenes are designed with multihierarchical and nested structures, and the elements and relationships are extendable for each geographic scene. In this case, current No-structured query language databases may be suitably used to store geographic scene information. Using the key-value mode, different scenes can be stored in a unified way, and the query efficiency can be greatly improved compared with that of traditional relational databases.
Finally, there are typical geographic scenes that can be used to describe common geographic phenomena and processes, according to different domains, research problems, study areas, etc. Basic paradigms and modes may be needed to customize specific scene templates used to represent common or typical geographic environments in the real world. This will save time and manpower when building similar geographic scenes and conducting similar research in the future.
3.4. Representation strategies
Historically, in the geographic research domain, geographic information has been mainly represented and expressed using 2D/3D maps or virtual visualization systems. As researchers have focused on geographic processes and the creation of VGEs, dynamic virtual scenes have been more commonly used to reflect the comprehensive geo-environments. In this context, except for data preparation, which was discussed in the previous section, research is currently focused on dynamic visualization technologies (e.g. Fabrikant Citation2005; Andrienko et al. Citation2008; Groenendyk Citation2013; Pensa, Masala, and Lami Citation2013; Yasobant et al. Citation2015). However, to better experience of virtual scenes, several issues must be studied and discussed.
First, scenes and their elements in the geographic world are composed of visible information (e.g. colors and shapes) and non-visible information (e.g. temperature and electromagnetism). In many past virtual systems, most content was visible information due to the restrictions of traditional measuring methods. With the development of advanced methods of data collection, especially the use of various sensors and portable devices, non-visible information can be more easily acquired, integrated and represented to better describe dynamic and panoramic geographic scenes. This non-visible information is often expressed using fields with different colors. It is expected in the future, In the future, most valuable information will likely be captured and expressed in visual scenes for further knowledge acquisition and geographic analysis.
Second, in additional to vision, auditory, gustation, smell, and tactile senses are also employed by humans to sense the real world. Expressing content in a visual way is not and should not be the only channel for information transfer. Although technologies based on human–computer interactions have made great advancements (e.g. Holzinger, Mukasa, and Nischelwitzer Citation2008; Mackenzie Citation2013; Obrist et al. Citation2016), to date, few have been introduced for geographic research and cognition. Because one of the important objectives of VGEs is to enable users to ‘feel it in person’, additional efforts are required to equip scene-based geographic analysis tools with methods of augmenting the senses (Goodchild Citation2015). The better users can naturally experience the virtual scenes, as in daily life, the easier it will be for users to perceive and understand what has occurred or will occur.
Finally, social media is being used to facilitate the creation and sharing of ideas, interests, knowledge and other information through virtual communities and networks. It has changed the traditional communication mode via which humans spread and acquire information. Facebook, Twitter, LinkedIn, WhatsApp, WeChat, Weibo, and YouTube are all famous social media outlets that have disrupted the monopoly formed by traditional TV and newspapers. In the early stage of social media, text and pictures were the main methods of transferring information. Since then, the location-based modes have attracted more attention, and currently, more tools are being developed to provide temporal and spatial information for shared pictures and comments; therefore, an increasing number of spatiotemporal-related analyses of social media-based big data have been conducted (e.g. Lazer et al. Citation2014; Ruths and Pfeffer Citation2014). However, much of the spatiotemporal information associated with social media comes from maps. This mode often ignores the additional background context of the environment in which content is provided. In the future, it is expected that all social media data will be provided using tools that can offer visual scenes; thus, more users can exchange their ideas and knowledge using diverse virtual environments to enhance the capacity of social media. Moreover, shared text may also form different visual scenes that can be easily understood. In this mode, the virtual world and the real world will be seamlessly integrated. Such a technology would also break the boundary between reality and virtual reality and allow users to alternate between extensions of first life and second life.
4. Conclusion
It has been nearly 20 years since VGEs were first proposed. Although some key issues have attracted the attention of researchers, the organization of geographic data in VGEs to support both visualizations and simulations remains a topic of discussion. Currently, traditional GIS data models cannot satisfy the developing objectives of VGEs. This article proposed the Geographic Scenario theory to bridge this gap and to improve currently cartography. The preliminary conception of Geographic Scenario was discussed, as well as several key related issues.
However, as with any new field of study, the Geographic Scenario concept and those of related topics are still being developed, and the development has a long way to go. However, this article begins the discussion of the concept and theory with the objective of exploring potential cutting-edge research directions. It is expected that, in the near future, geographic scenes developed based on Geographic Scenario will likely be used in powerful VGEs for a deeper understanding of the geographic world.
Acknowledgements
We appreciate the detailed suggestions and constructive comments from the editor and the anonymous reviewers.
Disclosure statement
No potential conflict of interest was reported by the authors.
ORCID
Min Chen http://orcid.org/0000-0001-8922-8789
Additional information
Funding
References
- Andrienko, G., N. Andrienko, J. Dykes, S. I. Fabrikant, and M. Wachowicz. 2008. Geovisualization of Dynamics, Movement and Change: Key Issues and Developing Approaches in Visualization Research.” Information Visualization 7 (3–4): 173–180. doi: 10.1057/IVS.2008.23
- Arora, V. K., G. J. Boer, P. Friedlingstein, M. Eby, C. D. Jones, J. R. Christian, G. Bonan, et al. 2013. “Carbon–Concentration and Carbon–Climate Feedbacks in CMIP5 Earth System Models.” Journal of Climate 26: 5289–5314. doi: 10.1175/JCLI-D-12-00494.1
- Ballatore, A. 2016. “Semantic Challenges for Volunteered Geographic Information.” In European Handbook of Crowdsourced Geographic Information, edited by C. Capineri, M. Haklay, and H. S. Huang, 87–95. London: Ubiquity Press.
- Batty, M. 2008. “Virtual Reality in Geographic Information Systems.” In The Handbook of Geographic Information Science, edited by J. P. Wilson and A. S. Fotheringham, 317–334. Oxford: Blackwell.
- Batty, M., H. Lin, and M. Chen. 2017. “Virtual Realities, Analogies and Technologies in Geography.” In Handbook on Geographies of Technology, edited by B. Warf, 96–110. London: Edward Elgar.
- Biederman, I., R. J. Mezzanotte, and J. C. Rabinowitz. 1982. “Scene Perception: Detecting and Judging Objects Undergoing Relational Violations.” Cognitive Psychology 14 (2): 143–177. doi: 10.1016/0010-0285(82)90007-X
- Bol, P. K. 2012. “GIS, Prosopography and History.” Annals of GIS 18 (1): 3–15. doi: 10.1080/19475683.2011.647077
- Bol, P. K. 2013. “On the Cyberinfrastructure for GIS-Enabled Historiography.” Annals of the Association of American Geographers 103 (5): 1087–1092. doi: 10.1080/00045608.2013.792178
- Bothwell, J., and M. Yuan. 2010. “Apply Concepts of Fluid Kinematics to Represent Continuous Space-Time Fields in Temporal GIS.” Annals of GIS 16 (1): 27–41. doi: 10.1080/19475681003700872
- Che, W. T., H. Lin, and M. Y. Hu. 2011. “Reality-Virtuality Fusional Campus Environment: An Online 3D Platform Based on OpenSimulator.” Geo-spatial Information Science 14 (2): 144–149. doi: 10.1007/s11806-011-0458-3
- Chen, M., H. Lin, M. Y. Hu, L. He, and C. Zhang. 2013a. “Real-Geographic-Scenario-Based Virtual Social Environments: Integrating Geography with Social Research.” Environment and Planning B: Planning and Design 40 (6): 1103–1121. doi: 10.1068/b38160
- Chen, M., H. Lin, O. Kolditz, and C. Chen. 2015. “Developing Dynamic Virtual Geographic Environments (VGEs) for Geographic Research.” Environmental Earth Sciences 74: 6975–6980. doi: 10.1007/s12665-015-4761-4
- Chen, M., H. Lin, and G. N. Lu. 2017. “Virtual Geographic Environments.” In The International Encyclopedia of Geography. Wiley and the American Association of Geographers (AAG). doi:10.1002/9781118786352.wbieg0448.
- Chen, M., H. Lin, G. N. Lu, L. He, and Y. N. Wen. 2011a. “A Spatial-Temporal Framework for Historical and Cultural Research on China.” Applied Geography 31: 1059–1074. doi: 10.1016/j.apgeog.2011.01.022
- Chen, M., H. Lin, Y. N. Wen, L. He, and M. Hu. 2012. “Sino-VirtualMoon: A 3D Web Platform Using Chang’E-1 Data for Collaborative Research.” Planetary and Space Science 65 (1): 130–136. doi: 10.1016/j.pss.2012.01.005
- Chen, M., H. Lin, Y. N. Wen, L. He, and M. Y. Hu. 2013b. “Construction of a Virtual Lunar Environment Platform.” International Journal of Digital Earth 6 (5): 469–482. doi: 10.1080/17538947.2011.628415
- Chen, M., Y. H. Sheng, Y. N. Wen, J. W. Sheng, and H. J. Su. 2008. “Virtual Geographic Environments Oriented 3D Visualization System.” Journal of System Simulation 20 (19): 7–24.
- Chen, M., H. Tao, H. Lin, and Y. N. Wen. 2011b. “A Visualization Method for Geographic Conceptual Modelling.” Annals of GIS 17 (1): 15–29. doi: 10.1080/19475683.2011.558024
- Clark, M. P., Y. Fan, D. M. Lawrence, J. C. Adam, D. Bolster, D. J. Gochis, R. P. Hooper, et al. 2015. “Improving the Representation of Hydrologic Processes in Earth System Models.” Water Resources Research 51 (8): 5929–5956. doi: 10.1002/2015WR017096
- Clifford, N., M. Cope, T. Gillespie, and S. French. 2016. Key Methods in Geography. 3rd ed. London: Sage.
- Davies, C., and D. Peebles. 2010. “Spaces or Scenes: Map-Based Orientation in Urban Environments.” Spatial Cognition & Computation 10 (2-3): 135–156. doi: 10.1080/13875861003759289
- Diggle, P. J. 2013. Statistical Analysis of Spatial and Spatio-Temporal Point Patterns. 3rd ed. Boca Raton, FL: CRC Press.
- Fabrikant, S. I. 2005. Towards an Understanding of Geovisualization with Dynamic Displays: Issues and Prospects. Papers from the AAAI Spring Symposium: Reasoning with Mental & External Diagrams: Computational Modeling & Spatial Assistance, Technical Report SS-05-06, Stanford, CA, March. DBLP, 6–11.
- Flato, G. M. 2011. “Earth System Models: An Overview.” Wiley Interdisciplinary Reviews: Climate Change 2 (6): 783–800.
- Goodchild, M. F. 2008. “Representation and Computation of Geographic Dynamics.” In Understanding Dynamics of Geographic Domains, edited by K. S. Hornsby and M. Yuan, 13–30. Boca Raton, FL: CRC Press.
- Goodchild, M. F. 2015. “Perspectives on the New Cartography.” Environment and Planning A 47: 1341–1345. doi: 10.1177/0308518X15594911
- Granell, C., S. Schade, and N. Ostländer. 2013. “Seeing the Forest Through the Trees: A Review of Integrated Environmental Modelling Tools.” Computers, Environment and Urban Systems 41: 136–150. doi: 10.1016/j.compenvurbsys.2013.06.001
- The Great Soviet Encyclopedia, 3rd ed. 1970–1979. http://encyclopedia2.thefreedictionary.com/Geographic+Environment
- Groenendyk, M. 2013. “Emerging Data Visualization Technologies for Map and Geography Libraries: 3-D Printing, Holographic Imaging, 3-D City Models, and 3-D Model-Based Animations.” Journal of Map & Geography Libraries 9 (3): 220–238. doi: 10.1080/15420353.2013.821436
- He, L., M. Chen, G. N. Lu, H. Lin, L. Y. Liu, and J. Xu. 2013. “An Approach to Transform Chinese Historical Books Into Scenario-Based Historical Maps.” The Cartographic Journal 50 (1): 49–65. doi: 10.1179/1743277412Y.0000000024
- Heavens, N. G., D. S. Ward, and M. M. Mahowald. 2013. “Studying and Projecting Climate Change with Earth System Models.” Nature Education Knowledge 4 (5): 4.
- Henderson, J. M. 2003. “Human Gaze Control During Real-World Scene Perception.” Trends in Cognitive Sciences 7 (11): 498–504. doi: 10.1016/j.tics.2003.09.006
- Holzinger, A., L. S. Mukasa, and A. K. Nischelwitzer. 2008. “Introduction to the Special Thematic Session: Human–Computer Interaction and Usability for Elderly (HCI4AGING).” Lecture Notes in Computer Science 5105: 18–21. doi: 10.1007/978-3-540-70540-6_2
- Hui, L., Z. Jun, G. Jianhua, X. Bingli, and Q. Hua. 2010. “A Grid-Based Collaborative Virtual Geographic Environment for the Planning of Silt Dam Systems.” International Journal of Geographical Information Science 24 (4): 607–621. doi: 10.1080/13658810903012425
- Janowicz, K., S. Scheider, and B. Adams. 2013. “A Geo-Semantics Flyby.” In Reasoning Web. Semantic Technologies for Intelligent Data Access, edited by S. Rudolph, G. Gottlob, I. Horrocks, and F. Van Harmelen, 230–250. Berlin: Springer.
- Kendall, D. G. 1984. “Shape Manifolds, Procrustean Metrics, and Complex Projective Spaces.” Bulletin of the London Mathematical Society 16 (2): 81–121. doi: 10.1112/blms/16.2.81
- Konecny, M. 2011. “Review: Cartography: Challenges and Potential in the Virtual Geographic Environments era.” Annals of GIS 17 (3): 135–146. doi: 10.1080/19475683.2011.602027
- Kwan, M. P. 1998. “Space-Time and Integral Measures of Individual Accessibility: A Comparative Analysis Using a Point-Based Framework.” Geographical Analysis 30 (3): 191–216. doi: 10.1111/j.1538-4632.1998.tb00396.x
- Lai, J. S., W. Y. Chang, Y. C. Chan, S. C. Kang, and Y. C. Tan. 2011. “Development of a 3D Virtual Environment for Improving Public Participation: Case Study – The Yuansantze Flood Diversion Works Project.” Advanced Engineering Informatics 25: 208–223. doi: 10.1016/j.aei.2010.05.008
- Laniak, G. F., G. Olchin, J. Goodall, A. Voinov, M. Hill, P. Glynn, G. Whelan, et al. 2013. “Integrated Environmental Modeling: A Vision and Roadmap for the Future.” Environmental Modelling & Software 39: 3–23. doi: 10.1016/j.envsoft.2012.09.006
- Lazer, D., R. Kennedy, G. King, and A. Vespignani. 2014. “The Parable of Google Flu: Traps in Big Data Analysis.” Science 343 (6176): 1203–1205. doi: 10.1126/science.1248506
- Li, Y., J. H. Gong, Y. Q. Song, Z. G. Liu, T. Ma, H. Liu, S. Shen, W. H. Li, and Y. Y. Yu. 2015. “Design and Key Techniques of a Collaborative Virtual Flood Experiment That Integrates Cellular Automata and Dynamic Observations.” Environmental Earth Sciences 74: 7059–7067. doi: 10.1007/s12665-015-4716-9
- Lin, H. 1997. “STIN Operation: A Study on Searching for Spatiotemporal Measures.” Gartography 26 (1): 27–36.
- Lin, H., M. Batty, S. E. Jørgensen, B. J. Fu, M. Konecny, A. Voinov, P. Torrens, et al. 2015. “Virtual Environments Begin to Embrace Process-Based Geographic Analysis.” Transactions in GIS 19 (4): 493–498. doi: 10.1111/tgis.12167
- Lin, H., and M. Chen. 2015. “Managing and Sharing Geographic Knowledge in Virtual Geographic Environments (VGEs).” Annals of GIS 21 (4): 261–263. doi: 10.1080/19475683.2015.1099568
- Lin, H., M. Chen, and G. N. Lu. 2013. “Virtual Geographic Environment: A Workspace for Computer-Aided Geographic Experiments.” Annals of the Association of American Geographers 103 (3): 465–482. doi: 10.1080/00045608.2012.689234
- Lin, H., M. Chen, G. N. Lu, Q. Zhu, J. H. Gong, X. You, Y. N. Wen, B. L. Xu, and M. Y. Hu. 2013. “Virtual Geographic Environments (VGEs): A New Generation of Geographic Analysis Tool.” Earth-Science Reviews 126: 74–84. doi: 10.1016/j.earscirev.2013.08.001
- Lin, H., and B. L. Xu. 2007. “Some Thoughts on Virtual Geographic Environments.” Geography and Geo-Information Science 23 (2): 1–7.
- Longhorn, R. A., and M. Blakemore. 2008. Geographic Information-Value, Pricing, Production, and Consumption. Oxford: Taylor & Francis.
- Lu, G. N. 2011. “Geographic Analysis-Oriented Virtual Geographic Environment: Framework, Structure and Functions.” Science China: Earth Science 54: 733–743. doi: 10.1007/s11430-011-4193-2
- Lü, G. N., Z. Y. Yu, L. C. Zhou, M. G. Wu, Y. H. Sheng, and L. W. Yuan. 2015. “Data Environment Construction for Virtual Geographic Environment.” Environmental Earth Sciences 74 (10): 7003–7013. doi: 10.1007/s12665-015-4736-5
- Mackenzie, S. I. 2013. Human-Computer Interaction: An Empirical Perspective. Burlington, MA: Morgan Kaufmann.
- Massey, D. 1999. “Space-Time, ‘Science’ and the Relationship Between Physical Geography and Human Geography.” Transactions of the Institute of British Geographers 24 (3): 261–276. doi: 10.1111/j.0020-2754.1999.00261.x
- Obrist, M., C. Velasco, C. T. Vi, N. Ranasinghe, A. Israr, A. D. Cheok, C. Spence, and P. Gopalakrishnakone. 2016. “Touch, Taste, & Smell User Interfaces: The Future of Multisensory HCI.” CHI EA’16 Proceedings of the 2016 CHI Conference Extended Abstracts on Human Factors in Computing Systems, Santa Clara, CA, 3285–3292.
- Pensa, S., E. Masala, and I. M. Lami. 2013. “Supporting Planning Processes by the Use of Dynamic Visualisation.” Lecture Notes in Geoinformation and Cartography 195: 451–467.
- Priestnall, G., C. Jarvis, A. Burton, M. Smith, and N. J. Mount. 2012. “Virtual Geographic Environments.” In Teaching Geographic Information Science and Technology in Higher Education, edited by D. J. Unwin, K. E. Foote, N. J. Tate, and D. DiBiase, 257–288. Hoboken: Wiley.
- Raper, J., and D. Livingstone. 2001. “Let’s Get Real: Spatio-Temporal Identity and Geographic Entities.” Transactions of the Institute of British Geographers 26 (2): 237–242. doi: 10.1111/1475-5661.00017
- Rayner, K. 1992. “Eye Movements and Visual Cognition: Introduction.” In Eye Movements and Visual Cognition: Scene Perception and Reading, edited by K. Rayner, 1–7. New York: Springer.
- Rink, K., C. Chen, L. Bilke, Z. L. Liao, K. Rinke, M. Frassl, T. X. Yue, and O. Kolditz. 2016. “Virtual Geographic Environments for Water Pollution Control.” International Journal of Digital Earth. doi:10.1080/17538947.2016.1265016.
- Ruths, D., and J. Pfeffer. 2014. “Social Media for Large Studies of Behavior.” Science 346 (6213): 1063–1064. doi: 10.1126/science.346.6213.1063
- Smith, W. K., S. C. Reed, C. C. Cleveland, A. P. Ballantyne, W. R. L. Anderegg, W. R. Wieder, Y. Y. Liu, and S. W. Running. 2016. “Large Divergence of Satellite and Earth System Model Estimates of Global Terrestrial CO2 Fertilization.” Nature Climate Change 6: 306–310. doi: 10.1038/nclimate2879
- Torrens, P. M. 2009. “Process Models and Next-Generation Geographic Information Technology.” GIS Best Practices: Essays on Geography and GIS. Redlands, CA: ESRI Press, 63–75.
- Torrens, P. M. 2015a. “Intertwining Agents and Environments.” Environmental Earth Sciences 74 (10): 7117–7131. doi: 10.1007/s12665-015-4738-3
- Torrens, P. M. 2015b. “Slipstreaming Human Geosimulation in Virtual Geographic Environments.” Annals of GIS 21 (4): 325–344. doi: 10.1080/19475683.2015.1009489
- Voinov, A., and H. H. Shugart. 2013. “‘Integronsters’, Integral and Integrated Modeling.” Environmental Modelling & Software 39: 149–158. doi: 10.1016/j.envsoft.2012.05.014
- Wang, G. C., K. Cao, K. X. Zhang, A. Wang, C. Liu, Y. N. Meng, and Y. D. Xu. 2011. “Spatio-Temporal Framework of Tectonic Uplift Stages of the Tibetan Plateau in Cenozoic.” Science China Earth Sciences 54 (1): 29–44. doi: 10.1007/s11430-010-4110-0
- Wen, Y. N., M. Chen, G. N. Lu, H. Lin, L. He, and S. Yue. 2013. “Prototyping an Open Environment for Sharing Geographical Analysis Models on Cloud Computing Platform.” International Journal of Digital Earth 6 (4): 356–382. doi: 10.1080/17538947.2012.716861
- Wen, Y. N., M. Chen, S. S. Yue, P. P. Zheng, G. Q. Peng, and G. N. Lu. 2016. “A Model-Service Deployment Strategy for Collaboratively Sharing Geo-Analysis Models in an Open Web Environment.” International Journal of Digital Earth 10: 405–425. doi:10.1080/17538947.2015.1131340.
- Xia, J. Z., S. G. Liu, S. L. Liang, Y. Chen, W. F. Xu, and W. P. Yuan. 2014. “Spatio-Temporal Patterns and Climate Variables Controlling of Biomass Carbon Stock of Global Grassland Ecosystems from 1982 to 2006.” Remote Sensing 6 (3): 1783–1802. doi: 10.3390/rs6031783
- Xu, B. L., H. Lin, L. S. Chiu, Y. Hu, J. Zhu, M. Y. Hu, and W. N. Cui. 2011. “Collaborative Virtual Geographic Environments: A Case Study of Air Pollution Simulation.” Information Sciences 181 (11): 2231–2246. doi: 10.1016/j.ins.2011.01.017
- Yasobant, S., K. S. Vora, C. Hughes, A. Upadhyay, and D. V. Mavalankar. 2015. “Geovisualization: A Newer GIS Technology for Implementation Research in Health.” Journal of Geographic Information System 07 (1): 20–28. doi: 10.4236/jgis.2015.71002
- Yuan, W. P., Y. Q. Luo, X. L. Li, S. G. Liu, G. R. Yu, T. Zhou, M. Bahn, et al. 2011. “Redefinition and Global Estimation of Basal Ecosystem Respiration Rate.” Global Biogeochemical Sycles 25 (4). doi:10.1029/2011GB004150.
- Yue, S. S., M. Chen, Y. Wen, and G. N. Lu. 2016. “Service-Oriented Model-Encapsulation Strategy for Sharing and Integrating Heterogeneous Geo-Analysis Models in an Open Web Environment.” ISPRS Journal of Photogrammetry and Remote Sensing 114: 258–273. doi: 10.1016/j.isprsjprs.2015.11.002
- Yue, S. S., Y. N. Wen, M. Chen, G. N. Lu, D. Hu, and F. Zhang. 2015. “A Data Description Model for Reusing, Sharing and Integrating Geo-Analysis Models.” Environmental Earth Sciences 74 (1): 7081–7099. doi: 10.1007/s12665-015-4270-5
- Zhang, C. X., M. Chen, Y. N. Ding, R. R. Li, and H. Lin. 2015. “A Virtual Geographic Environment System for Multiscale Air Quality Analysis and Decision Making: A Case Study of SO2 Concentration Simulation.” Applied Geography 63: 326–336. doi: 10.1016/j.apgeog.2015.07.011
- Zhang, C. X., M. Chen, R. R. Li, C. Y. Fang, and H. Lin. 2016. “What’s Going on About Geo-Process Modeling in Virtual Geographic Environments (VGEs).” Ecological Modelling 319: 147–154. doi: 10.1016/j.ecolmodel.2015.04.023
- Zhang, C. X., H. Lin, M. Chen, R. R. Li, and Z. C. Zeng. 2014a. “Scale Compatibility Analysis in Geographic Process Research: A Case Study of a Meteorological Simulation in Hong Kong.” Applied Geography 52: 135–143. doi: 10.1016/j.apgeog.2014.05.005
- Zhang, C. X., H. Lin, M. Chen, and L. Yang. 2014b. “Scale Matching of Multiscale Digital Elevation Model (DEM) Data and the Weather Research and Forecasting (WRF) Model: A Case Study of Meteorological Simulation in Hong Kong.” Arabian Journal of Geosciences 7: 2215–2223. doi: 10.1007/s12517-014-1273-6
- Zhou, C. H. 2015. “Prospects on Pan-Spatial Information System.” Progress in Geography 34 (2): 129–131.
- Zhu, J., J. H. Gong, W. G. Liu, T. Song, and J. Q. Zhang. 2007. “A Collaborative Virtual Geographic Environment Based on P2P and Grid Technologies.” Information Sciences 177 (21): 4621–4633. doi: 10.1016/j.ins.2007.05.006
- Zhu, J., H. Zhang, X. F. Yang, L. Z. Yin, Y. Li, Y. Hu, and X. Zhang. 2016. “A Collaborative Virtual Geographic Environment for Emergency Dam-Break Simulation and Risk Analysis.” Journal of Spatial Science 61 (1): 133–155. doi: 10.1080/14498596.2015.1051148