
ABSTRACT
This study presents a modified low-cost approach, which integrates the spectral angle mapper and image difference algorithms in order to enhance classification maps for the purpose of monitoring and analysing land use/land cover change between 2000 and 2015 for the Emirate of Dubai. The approach was modified by collecting 320 training samples from QuickBird images with a spatial resolution of 0.6 m, as well as carrying out field observations, followed by the application of a 3 × 3 Soble filter, sieving classes, majority/minority analysis, and clump classes of the obtained classification maps. The accuracy assessment showed that the targeted 2000, 2005, 2010 and 2015 classification maps have 88.1252%, 89.0699%, 90.1225% and 96.0965% accuracy, respectively. The results showed that the built-up area increased by 233.721 km2 (5.81%) between 2000 and 2005 and continues to increase even up and till the present time. The assessment of changes in the periods 2000–2005 and 2010–2015 confirmed that net vegetation area losses were more pronounced from 2000 to 2005 than from 2010 to 2015, dropping from 47,618 to 40,820 km2, respectively. This study is aimed to assist urban planners and decision-makers, as well as research institutes.
1. Introduction
Change detection regarding land use/land cover (LULC), and more specifically on built-up, sand dune and vegetation areas, and their dynamics over time are critical to existing master plans, cadastral maps and investigating the impact of LULC change on groundwater and air quality, along with supporting related environmental decisions (Elmahdy and Mohamed Citation2016b; Jin et al. Citation2017).
The Emirate of Dubai has not shied away from this activity, given that its intensive urbanisation and population have more than doubled since it started out as an economic centre in the region.
Remote sensing images represent a valuable spatial and temporal information data source to monitor dynamics of LULC changes and predict their impact on any environmental issues over a regional scale. Multi-sources of Landsat images with a temporal resolution of 5 years enable more reliable exploration applications than was previously the case. Especially in poorly accessible arid and semi-arid regions. Landsat images are widely used as the main data sets to both classify LULC and detect changes on a worldwide basis.
Over the last decade, pixel-based change detection methods, including image difference (ID), image rationing, image regression and change vector analysis have been developed for rapid detection of changes in urban areas using remote sensing data (Griffiths Citation1988; Saksa et al. Citation2003; Coppin et al. Citation2004; Lu et al. Citation2004, Citation2005).
Several traditional classifiers, such as maximum likelihood, Algebra change detector, minimum distance and parallelepiped have been developed for remote sensing-based monitoring, mapping and analysing changes (Derrode, Mercier, and Pieczynski Citation1994; Fumera, Roli, and Giacinto Citation2000; Jensen Citation2005; Hagner and Reese Citation2007; Couturier et al. Citation2009; Rashed and Jürgens Citation2010; Nassar, Blackburn, and Whyatt Citation2012; Saeed, Bushahab, and Obaid Citation2012; Momeni, Aplin, and Boyd Citation2016; Saeed and Fatima Citation2016). Other advanced algorithms have been applied to LULC classification and lithological mapping, including the spectral angle mapper (SAM), artificial neural networks, machine-learning decision trees, genetic algorithms and support vector machines (e.g. Melgani and Bruzzone Citation2004; Bagan et al. Citation2005; Kumar Citation2006; Im, Jensen, and Tullis Citation2008; Kavzoglu Citation2009; Fisher Citation2010).
Girouard et al. (Citation2004) validated the SAM algorithm for geological mapping by comparing the results provided by a Landsat thematic mapper (TM) with a spatial resolution of 30 m and QucikBird with a spatial resolution of 0.6 m data. They concluded that the QuickBird images neither performed well with SAM nor provided good results because of the low spectral resolution.
The impact of different sources of reference spectra on the mechanism of SAM outputs was estimated using synthetic spectral data by Hecker et al. (Citation2008) who found that the spectra from image data and endmembers present an issue that is hard to resolve.
A classification approach has been developed to evaluate the classification performance of a multiple endmember SAM in discriminating tree species (Cho, Mathieu, and Debba Citation2009). Taha and Al fattah Shahin (Citation2014) developed an expert system classification using the knowledge engineer in order to refine the classification output of the SAM algorithm.
A series of studies have been conducted to develop the SAM algorithm. Cho, Mathieu, and Debba (Citation2009) evaluated the impact of using multiple endmembers on the classification performance and vegetation types discrimination. An expert system was applied to the SAM algorithm by refining, reclassifying and reducing errors in initial classified outputs.
The use of endmembers of the images themselves could lead to a low level of accuracy of LULC classification and subsequently change detection (Murphy, Monteiro, and Schneider Citation2012). Liu and Yang (Citation2013) proposed a kernel spectral angle mapper (KSAM) algorithm to overcome the problem and limitation of the non-linear classification of remote sensing image. The KSAM algorithm is accomplished by applying the kernel method to the standard SAM algorithm. However, the kernel parameters of the polynomial and sigmoid kernel functions of the algorithm are extremely sensitive.
The SAM algorithm was tested for mapping the LULC characteristics using a Hyperion and/or hyperspectral images (Petropoulos, Vadrevu, and Kalaitzidis Citation2013; Rashmi, Addamani, and Ravikiran Citation2014). Unfortunately, spatial information derived from hyperspectral data makes LULC classification hard to resolve and requires huge storage capacity (Rashmi, Addamani, and Ravikiran Citation2014).
The impact of vegetation on lithological mapping was investigated using airborne multispectral data and the SAM classifier (Grebby et al. Citation2014), as well as on mapping lithological units from fine and moderate spatial resolution remote sensing data (Hadigheh and Ranjbar Citation2013; Zhang and Li Citation2014). Although the accuracy of the SAM algorithm may increase through the use hyperspectral data, difficulties remain, especially if a large-scale area is covered. None of these studies have paid any attention to improving the quality and spatial resolution of classification outputs in order to perform precise LULC classification and change detection. Thus, exploring methods to address the solution regarding SAM-based classification is urgently needed.
This paper aims to modify a low-cost approach, which integrates SAM and ID algorithms by collecting training samples from high-resolution images, such as from QuickBird and field observations, to monitor and analyse rapid changes in LULC in Dubai on a regional scale. The novelty of the integrated approach lies in its ability to automatically map classes and monitor changes in LULC on a regional scale in a low-cost manner, which allows for LULC maps to be rapidly updated and investigating the impact of these changes on groundwater and air quality. Thereby informing future studies on environmental issues and ecological issues. The proposed approach is expected to be applicable for the classification of remote sensing data and monitoring LULC changes in arid and semi-arid regions.
2. Data and methodology
2.1. Study area
Dubai is the second largest city in the UAE and one of the most rapidly developing cities in the world. It extends between longitude 54°59′ to 55°36′42″E and latitude 24°42′30″ to 55°16′59″N (), and is located about 150 km east of Abu Dhabi, the UAE capital and 7 km west of the Emirate of Sharjah. The Emirate of Dubai is spread over an area of about 3885 km2, while the city is approximately 700 km2 at an elevation 5 m.a.s.l. It is divided into two by the Creek of Dubai (Khor of Dubai): the first part is known locally as Deira (north-east), while the second is known as Bur Dubai (south-west).
Figure 1. LULC map of Dubai Emirate as of 2015 showing the Dubai Creek (Khor of Dubai) divides the Dubai into two parts. The first part is known as Deira (north-east) and the second part is known as Bur Dubai (south-west).
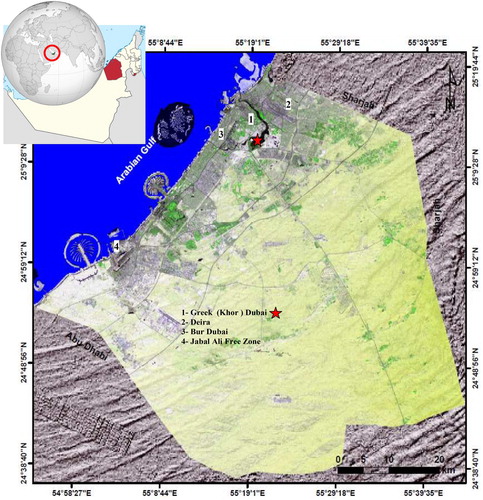
The climatic condition of the Emirate of Dubai is warm to sunny with average temperatures ranging from 25°C in the winter to 37°C and with humidity averaging 90% in the summer. Rainfall in Dubai is infrequent and it mostly rains during winter, with mean monthly ranges from 0.6 to 18.8 mm (https://services.dubaiairports.ae/dubaimet/met/climate.aspx). Agricultural activity is limited to sand dune corridors, desert and gravel plains of sand dune area and near Hatta, wherever palaeochannels (wadis) are found. Other vegetation areas (garden and parks) can be found in and around the city and along main roads. Dubai is divided into three major geomorphic regions: (i) the eastern mountains, (ii) a dune field and (iii) the western region with its coastal belt and inland sabkhas (JICA Citation1996) (). The Emirate of Dubai has a variety of LC classes comprising of built-up, waterbody, farming and bare land. Among these LC classes, the two most dominant are built-up and vegetation areas. The rapid growth of Dubai has resulted in a sharp decline in desert areas and water quality, and, thus, agriculture deterioration (Elmahdy and Mohamed Citation2016a).
2.2. Data set and image preprocessing
Four orthorectified clouds-free multitemporal Landsat images were downloaded from the webpage of the US Geological Survey (http://earthexplorer.usgs.gov) in respect of the following acquisition dates: 23 August 2000, 25 September 2005, 6 October 2010 and 14 October 2015, respectively from Landsat ETM+ and operational land imager (OLI) satellites. The bands of the four images were then stacked with excluding band 8 and thermal bands. QuickBird images with a spatial resolution of 0.6 m, which were collected and downloaded from Google Earth (http://www.google.com/earth/download/ge/), were used to assess the accuracy of the final maps ().
Table 1. Characteristics of Landsat images used in the study area.
To perform an accurate change detection analysis, it is important to unify or, at least, reduce the differences in the spatial, spectral and temporal resolution of the used Landsat images (Foody Citation2002; ENVI User’s Guide Citation2008; Elmahdy and Mohamed Citation2016b). As a first step and to avoid any misregistration errors, all the remote sensed data were coregistered with a higher precision using 32 ground control points collected from QuickBird and field observation (Elmahdy and Mohamed Citation2013; Elmahdy and Mohamed Citation2015). The resultant images had root mean square error values of 0.33, 0.39, 0.45 and 0.41 pixels, respectively ().
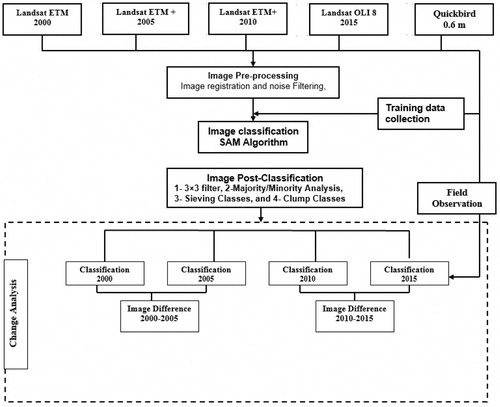
Figure 2. Flow chart of method applied to map, monitor and analyse changes from 2000 to 2015 in Dubai.
2.3. Training and sampling
In this study, a SAM-supervised classifier was applied to 2000, 2005, 2010 and 2015 Landsat images, using 320 endmembers (40 for each class and 10–20 pixels for each sample) for eight LC classes, which were collected from QuickBird images with a spatial resolution of 0.6 m and verified using field observations from the area in which the authors live. The collection of training samples was supported by information derived from QuickBird images using visual interpretation based on knowledge and experience of the region. Such assessment increases the accuracy and success of image classification. After that, all training samples for all classes were examined by separately plotting their spectral signatures (Elmahdy and Mohamed Citation2016a).
These training samples (endmembers) were then chosen from the first two components using a spectral scatter plot () implemented via ENVI v. 4.5 software (Small Citation2003; Wu and Murray Citation2003). As these visualised endmembers were all significantly different from each other in near-infrared (NIR) and short-wave infrared (SWIR) bands, they could be used for classification. In this study, the seven reflective bands of OLI images were used as the reference source for the computation of the separately indexed collected spectra from endmembers (collected from QuickBird images and overlaid on OLI images), representing the different LULC classes ().
Figure 3. Endmember collection spectra plot showing the reflectivity values and average spectral signature of different classes in the NIR and SWIR portion of the spectrum.
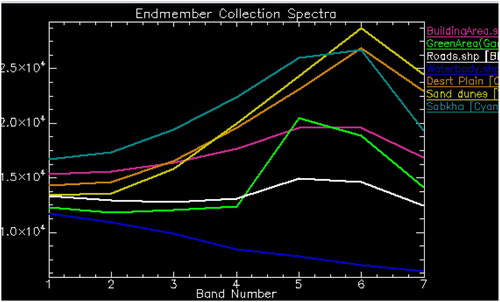
Water showed a gradual decrease in reflection values from band 1 (visible) to band 7 (SWIR2), while other features showed a gradual increase in reflection values from band 1 to band 6 (SWIR1), before a decrease in band 7 (SWIR2). These features are the outcomes of the high reflectivity in the NIR and moderate SWIR portions of the spectrum. Sand dunes, desert plains and sabkhas showed a higher reflectivity value (>2.5 × 10⁴) in the NIR and SWIR1, while vegetation, road and built-up areas showed a lower reflectivity value (<2 × 10⁴) in the NIR and SWIR1 portion of the spectrum ().
2.4. Image classification
Several buildings and vegetation classes demonstrate similar spectral signatures, which makes separation in a feature space by traditional unsupervised and supervised classifiers difficult, leading to imprecise classifications. Thus, the SAM presented by Kruse et al. (Citation1993), which is referred to in the related literature, is a likely solution to the classification of LULC in Dubai. The SAM offers physically based spectral classification, which uses a n-D angle to match the pixels to reference spectra. The algorithm detects the spectral similarity between two spectra by calculating the angle between the spectra, treating them as vectors in a space with dimensionality equal to the number of bands. The SAM matches the spectral angle between the endmember spectrum vector and each pixel vector in the n-D space.
The SAM algorithm simplifies this geometric interpretation to n-D space, determining the similarity by applying the following equation:where nb is the number of bands in the image, t is the pixel spectrum, r is the reference spectrum and α is the spectral angle. The main advantages of using a SAM algorithm are an increase in accuracy, that the error is not significant because the origin is very low (near zero), and a decrease in classification time (Berberoglu et al. Citation2000; Hunter and Power Citation2002).
The SAM also needs endmembers to be carefully collected, as this process affects the quality threshold (Kruse et al. Citation1993; Elmahdy Citation2008). As the SAM classifier uses only the direction of the spectra, it is insensitive to the unknown gain factor, with all possible illuminations treated equally (Kruse et al. Citation1993). Each satellite image was therefore, utilised to produce LULC maps based on various training samples collected from QuickBird images and field observations.
2.5. Post-classification and data manipulation
On the output classification maps, the unclassified pixels, which do not belong to any of the LULC classes, are represented in the colour black, while other pixels are grouped into the most related classes and represented by different colour codes. Thus, it is important to perform post-classification processing in order to refine the unclassified pixels and noise in the classification maps.
Post-classification was performed by taking the following three steps:
Applying a 3 × 3 Soble filter for better boundary discrimination of LULC classes.
Applying majority/minority analysis with a 3 × 3 kernel and central pixel of 1.
Applying sieve classes, using a group minimum threshold of 2, as well as the number of neighbours and a 3 × 3 operator-size row of clump parameters.
Applying clump classes, which reduce speckles and holes in classified areas, using morphological operators followed by combining classes.
These enhancements were applied using the post-classification tool implemented in ENVI v. 4.5 software. Finally, the enhanced maps (rasters) were converted into a vector format, while the total area of each class for spatial analysis was calculated.
2.6. Accuracy assessment
To detect LU/LC changes, it is important to estimate the accuracy of the classification process. Each classification map was assessed using a confusion matrix. The confusion matrices were built using ground truth regions of interest, collected from QuickBird images with a spatial resolution of 0.6 m and field observations. Kappa, user’s and producer’s accuracy were calculated using the confusion matrix (Foody Citation2002). Kappa analysis, which is a discrete multivariate technique, yields a khat statistic which is a measure of the agreement or accuracy (Congalton, Oderwald, and Mead Citation1983; Congalton Citation1991; Uzun et al. Citation2011; Jensen Citation2005). These various matrices were calculated using a post-classification tool implemented in ENVI 4.5 software.
2.7. Change detection and analysis
Pixel-based change detection was performed by computing different map input parameters, such as the number of classes and change detection type, which were applied to each pair of LULC maps ().
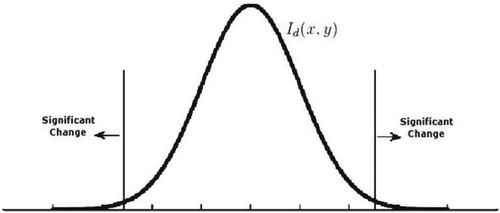
Figure 4. Distribution of a difference function. Significant changes are expected at the tails of the distribution.
Change detection, based on feature classes and simple differences in change detection type, was performed using a change detection tool implemented in ENVI v. 4.5 software and comprised of the following three steps:
Performing change detection for each pair of classes by defining a different threshold: The threshold values are evenly spaced between (−1) and (+1) for simple difference (the initial state image is subtracted from the final state image). The positive changes (positive value) represent the first (n/2) classes, while the negative changes represent the last (n/2) classes. The no-change class ((n/2) + 1) represents the middle class ().
Normalising the images (raster maps) by subtracting the image minimum.
The 2000 and 2005, 2005 and 2010, and 2010 and 2015 classification images were combined together, resulting in 11 changes detection classes.
On the final change detection maps, a positive change was identified when pixels took on a red colour code (final state image), while a negative change was identified when pixels took on a blue colour code (initial state image).
3. Results
3.1. Image classification and analysis
The LULC classification maps of the Emirate of Dubai for 2000, 2005, 2010 and 2015 are shown in and , while the total area of each class in km2 is summarised in . The maps show that the built-up area is limited to the coastal area and on both sides of the Khor of Dubai, while the cultivated area is distributed within the desert area, such as the sand dunes and desert plains. The maps also show that the desert plains, the sabkhas and the low sand dunes characterise the south-western part of Dubai, while sand dune hills characterise the south-eastern part of Dubai.
Figure 5. Classification maps derived from Landsat ETM, ETM+ and OLI images using SAM algorithm for the years 2000 (a), 2005 (b), 2010 (c), and 2015 (d).
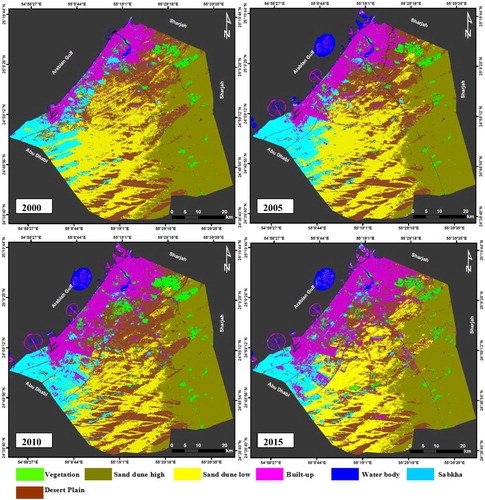
Figure 6. Maps of built-up, water and vegetation at Dubai Emirate as derived from Landsat images using SAM algorithm for the years 2000 (a), 2005 (b), 2010 (c), and 2015 (d).
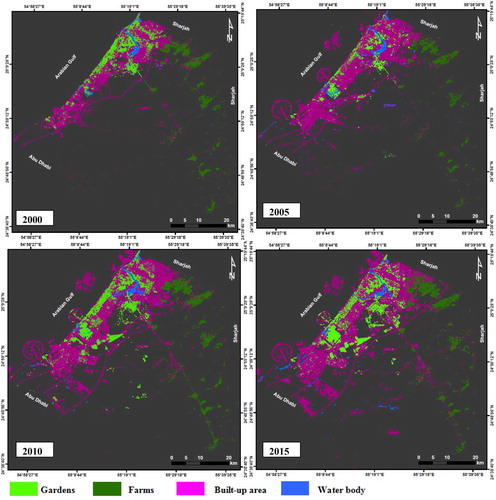
Table 2. Estimates of LU/LC classes total area and percentage and changes from 2000 to 2015.
As shown in and , a large portion of intensive urbanisation (1356.78 km²) in Dubai is observed along the north-east to south-west trending coastal line, with a length of about 65 km and a width of 20 km, which accounts for 33.73% of the total area of Dubai. Additionally, vegetation (gardens and parks), waterbody and offshore areas in the city of Dubai have grown extensively over the last 15 years. There is a clear distinction between waterbody, vegetation and built-up areas in the classified maps. Some parts of built-up and small road network areas were misclassified due to mixed pixels of intensive vegetation cover and the mix of small houses (villas) and their surrounding garden areas ( and ). In 2000, a highly concentrated built-up area was observed on both sides of the Khor of Dubai and along the coastal area.
This is because the Khor of Dubai has played a critical role in exports and imports, as well as commercial exchanges, in the city of Dubai since 1972, which continues to this day. This area is characterised by narrow streets and an intensity of small buildings, such that it appears as a single block on the Landsat images, with their types being difficult to discriminate ((a) and (a)). The estimated built-up area covered 96 km2 (2.38%), while the vegetation area (gardens and farms) was 85.27 km2 (2.12%) (; ).
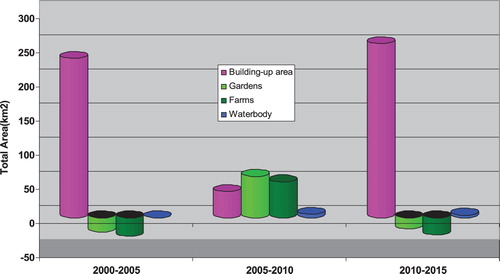
Figure 7. The graphical representation of the built-up, gardens and water body changes from 2000 to 2015.
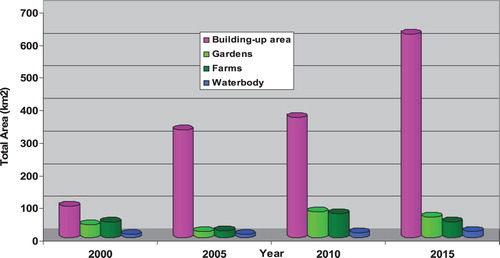
In 2005, there was a significant increase in the built-up area (329.72 km2), both onshore and offshore, while vegetation areas reduced from 85.27 to 37.65 km2 ((b) and (b); ). Depending on and , two expansions were observed in the offshore and onshore areas. In the offshore area, three islands were constructed: two are in the shape of a palm tree (Palm Jumeirah and Palm Jebel Ali), while the third is in the shape of a world map, all built in shallow water at a depth of about 10–20 m and occupying an area of about 195 km2. In the onshore area, two expansions in urban infrastructure were monitored: the first one involved the lower sand dune areas and in the north-west to south-east direction, while the second is located in the sabkha areas in the north-east to south-west direction.
The sharp increase in the vegetated areas could be due to an increasing in the number of gardens, golf clubs, which are associated with resorts, and villa compounds, which are distributed in the south-western part of Dubai.
In 2015, built-up areas increased from 368.53 km2 (9.16%) to 624 km2 (15.51%), while vegetation and agricultural areas reduced slightly from 151.21 km2 (3.76%) to 110.38 km2 (2.74%) (). The reason for this could be the extreme depletion in groundwater quality and quantity. Only about 18.40 km2 (0.45%) was covered by a waterbody ((d), (d) and ).
In 2010, vegetation areas increased from 37.65 km2 (0.48%) to 151.21 km2 (3.76%), while the built-up area slightly increased from 329.72 km2 (8.19%) to 368.53 km2 (9.16%) ((c), (c) and ; ).
3.2. Post-classification and accuracy assessment
Post-classification, in terms of applying a 3 × 3 Soble filter, majority/minority analysis, clumping classes and sieving classes, was applied to the derived classification maps. The Soble filter permitted better discrimination of LULC classes, while majority/minority analysis replaced the central pixel with the class value for the majority of the pixels in the kernel. Sieving and clumping classes eliminated the isolated classified pixels and/or holes in classified areas by using blob grouping. These enhancements allowed for the better discrimination of class boundaries and the better estimation of the total area of each LULC class, as well as the performance of an accurate classification assessment.
In the 2000 and 2005 confusion matrices, the overall accuracy of the 2000 and 2005 maps was 88.1252% (kappa coefficient of 0.8464) and 89.0699% (kappa coefficient of 0.8583), respectively ( and ). Conversely, user’s accuracy and producer’s accuracy for some classes were mostly higher than the total accuracy. The accuracy of the low sand dune and road areas is less than the overall accuracy.
Table 3. Confusion matrix of the year 2000 classification map.
Table 4. Confusion matrix of the year 2005 classification map.
The overall accuracy of the 2010 and 2015 maps was 90.1225% (kappa coefficient of 0.8714) and 96.0965% (kappa coefficient of 0.9409), respectively. As shown in and , the classification images of 2010 and 2015 are apparently well-mapped images.
Table 5. Confusion matrix of the year 2010 classification map.
Table 6. Confusion matrix of the year 2015 classification map.
The overall accuracy and kappa coefficient values in the 2010 and 2015 confusion matrices ( and ) are much higher than those in the 2000 and 2005 confusion matrices ( and ). This is due to their greater quantisation, enhanced signal-to-noise and sensitivity characteristics, as well as the lifetime of ETM+ and OLI detectors.
In general, the classification image of 2015 is the best classified image, which clearly shows the classification for each class with an overall accuracy of 96.096%, that is, the highest accuracy between the classified images. The low sand dune, vegetation and road classes exhibited less user’s accuracy and producer’s accuracy in all of the confusion matrices, due to the intensity and mixing of pixels in more than in built-up areas. In general, lithological units, vegetation, waterbody and built-up areas were clearly separated. On the other hand classes such as roads and trees in built-up areas showed relatively poor user’s accuracy and producer’s accuracy.
From the accuracy assessment, it was observed that the number and pixel size and knowledge-based training samples had a significant impact on classification accuracy, despite the classification algorithm used. Significantly, the degree of classification accuracy was consistently greater for classification that used a higher number of different training samples, which were collected from high-spatial resolution images and performed using a post-classification process.
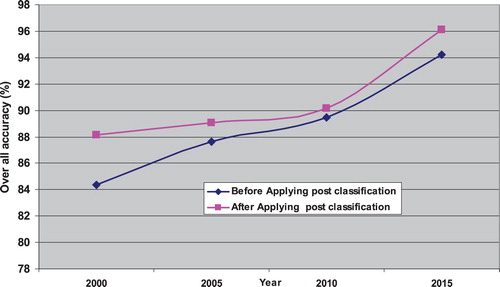
To investigate the influence of the post-classification process on classification accuracy, two methods were performed. In the first method, the obtained classification maps (pre- and post-classification) were assisted by visual interpretation and field observations. In the second method, the confusion matrix for each classification map obtained using the post-classification process was compared against those produced prior to applying the post-classification process (). For example, the overall accuracy for the 2015 classification map was 94.213% before applying the post-classification process. This overall accuracy value was increased to 96.0965% after applying the post-classification process (; ).
Figure 8. Over all accuracy of each classification map before and after applying post-classification process.
3.3. Change detection analysis
The results of change detection (highlighted in red), which were obtained by using ID algorithm, are presented in .
Figure 9. Change detection maps derived from a pair of classification maps using ID algorithm for the years 2000–2005 (a), 2005–2010 (b), 2010–2015 (c), and 2000–2015 (d).
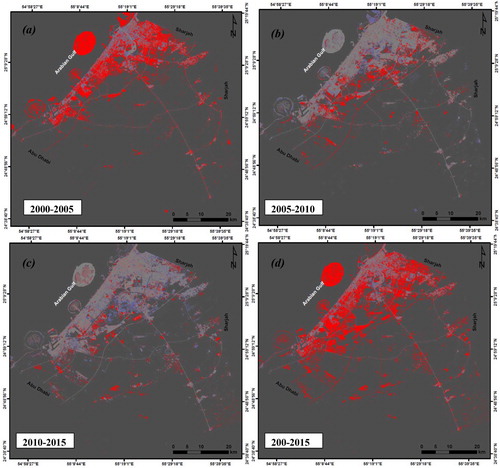
The results obtained indicate that, from 2000 to 2005, approximately 233.721 km2 (5.81%) of the Emirate of Dubai was occupied by built-up areas.
The assessment of changes in the periods 2000–2005 and 2010–2015 confirmed that net vegetation area losses were more pronounced from 2000 to 2005 than from 2010 to 2015, dropping from 47,618 to 40,820 km2, respectively.
Vegetation areas (gardens and farms) slightly reduced to 47.618 km2 (1.17%). Indeed, the period from 2010 to 2015 indicated a rate of change in built-up areas (6.35%), while the period from 2005 to 2010 showed the highest rate of change in vegetation areas (2.82%). Positive change in built-up areas, waterbodies and road length was higher during the periods from 2000 to 2005 and from 2010 to 2015, compared to the period from 2005 to 2010. However, the vegetation cover loss was higher from 2000 to 2005 and from 2010 to 2015.
The annual cover gain of vegetation areas increased sharply from 2005 to 2010, while the net loss of built-up areas dropped down significantly in the same period, compared to the other periods ( and ).
Figure 10. Changes of LU/LC classes calculated from 2000 to 2015.
The annual cover gain (positive change) in vegetation areas (gardens and farms) increased to 60.821 and 52.721 km2, respectively, for the period between 2005 and 2010 (; ). The construction of highways (Emirates and Sheik Mohamed bin Zayed Roads), which pass through the south-eastern and south-western parts of Dubai, as well as the short distance to the coastal area and the locations of the Jebel Ali Free Zone and golf clubs, have played a major role in increasing real estate investment and attracting huge international investments and people in these areas, especially the south-western part of Dubai ().
Table 7. LULC change detection analysis in Dubai for the years 2000–2015.
4. Discussion
Dubai is a challenging mapping environment, due to intensive urbanisation and reliable detection of LULC changes using satellite imagery over a regional scale, especially in a cost-effective manner. The wide availability of free medium-resolution Landsat images and the rapid development of automated algorithms have allowed for frequently updated LULC maps (Giri et al. Citation2013; Gong et al. Citation2013; Roy et al. Citation2014; Elmahdy and Mohamed Citation2016b).
In the present study, a novel approach to classifying Landsat images and detecting changes over a regional scale, using high-quality of endmembers collected from fine resolution images and field observations, was applied. Our approach required three steps in order to precisely classify LULC and change detection: first, endmembers from a satellite image with a spatial resolution of 0.6 m and field observations were collected; second, the Soble filter, majority/minority analysis, sieve classes and clump classes were applied to the classification maps; third, a proper threshold value was selected for better monitoring of changes in LULC.
The results showed that LU/LC types in the Emirates of Dubai rapidly changed onshore and offshore, especially in SE and SW trends. These trends agree well with the results of previous studies (Rashed and Jürgens Citation2010; Nassar, Blackburn, and Whyatt Citation2012; Saeed, Bushahab, and Obaid Citation2012; Saeed and Fatima Citation2016). The results obtained from the present study show that the proposed approach provides precise LU/LC maps to monitor changes. The results will therefore be a more time and cost relevant LU/LC data layers for the Emirate of Dubai, with increasing stress on the need for realistic changes database.
Our results from using the proposed approach are in contrast with the findings reported by Petropoulos, Vadrevu, and Kalaitzidis (Citation2013) and Rashmi, Addamani, and Ravikiran (Citation2014), who mapped and analysed LULC with hyperspectral data, but were unable to resolve the problem related to deriving spatial information and creating proper LULC classification. Landsat images with a spatial resolution of 30 m used in the present study appear to demonstrate the effects of this modification. These findings are in good agreement with those of Girouard et al. (Citation2004), who concluded that SAM performed much better with moderate spatial resolution remote sensing data (e.g. Landsat) than with fine spatial resolution data (QuickBird) because of the low spectral resolution involved.
Compared with traditional and standard SAM techniques involving very fine and very coarse remote sensing data (e.g. Grebby et al. Citation2014), whereby post-classification enhancements are not applied to the produced LULC maps, the proposed approach can create LULC maps with a higher level of accuracy than expected.
Several previous studies have shown that applying the kernel method and expert system classification to the standard SAM algorithm can increase the level of the overall accuracy regarding the classification outputs (Liu and Yang Citation2013). Unfortunately, these studies fail to resolve problems related to the spatial information and spectral resolution of hyperspectral data and the distortion of LULC classification.
Our results demonstrate that the proposed approach is promising for the classification of multi-sources of remote sensing data with a spatial resolution of 30 m, which is established and improved by collected endmembers from images with a spatial resolution of 0.6 m. The overall accuracies reached over 80% in all classification maps. In this study, a low level of noise (due to using free cloud orthorectified images with low BRDF effects and contamination) was expected to increase the classification accuracy.
All classes in the obtained maps corresponded to those on the QuickBird images, with some limitations regarding building, roads and vegetation types. The agricultural areas (farms) considered in the present study and those observed in the field were in good agreement with the QuickBird images, albeit with some errors related to the mixed pixels of gardens in built-up areas.
We noted that, although the accuracy of orthorectified images of Landsat images was high, several studies are increasingly using all the available Landsat data, rather than just selecting cloud-free images for applications and scientific work (Roy et al. Citation2014).
This study introduced post-classification and ID techniques to enhance the change detection performance by applying a 3 × 3 Soble filter, sieving classes, majority/minority analysis and clumping classes for the classified maps in order to reduce noise, speckles, holes and errors. These steps improved the quality of classification and change detection accuracy (; ). The ID algorithm offers a superior interpretation of changes in arid and semi-arid regions together with the SAM algorithm. The main advantage of the ID technique is that it is straightforward and able to monitor changes on a regional scale and on a less time-consuming but more cost-efficient basis. Additionally, it provides the threshold value for change detection based on pixel-by-pixel analysis in an automated manner (Griffiths Citation1988). In short, the ID technique makes a novel contribution to the academic community, especially regarding changes in arid and semi-arid regions.
Applying the proposed approach to free-of-charge satellite images with a higher spatial resolution, such as Sentinel-2, can increase the level of classification accuracy and reduce confusion in vegetation and built-up areas (Elmahdy and Mohamed Citation2016a). Additionally, most urban gain and vegetation (farms and gardens) loss was detected in the plain area in the south-westerly and south-easterly directions, where the sand dune elevations are below 2 m.
It appears that the proposed approach is capable of updating and filling the gaps between information in satellite images and the existing master plan produced by the Dubai Municipality, using free-of-charge satellite images.
The current study makes a new contribution to previous and current LULC knowledge in the Emirate of Dubai, as well as offering useful information to those working in governmental and environmental sectors concerned with LULC changes, such as land developers and urban planners, in terms of the extent to which built-up and vegetation areas in the Emirate of Dubai have increased and/or been lost over the last 15 years. However, the proposed integrated approach has a limitation, which should be taken into account and highlights the need for additional work: namely, that the current study uses Landsat images with a field observation temporal resolution of 5 years. While certain features, such as roads and airports, were difficult to discriminate on Landsat images using the SAM algorithm, due to their narrow width, they were classified as built-up areas.
Further studies to validate the LULC classification results (SAM modification) using other classifiers are recommended and needed. More specifically, a set of comparisons between the current result and the results of other classifiers such as, artificial neural network and support vector machine are recommended.
5. Conclusion
In this study, a low-cost approach was modified for remote sensing LULC classification and change detection. An improved method for endmembers collection, post- classification processes and change detection is proposed in this study, which can be used to obtain precise LULC classes for better change detection. In turn, the approach can be applied to the Emirate of Dubai with multitemporal remote sensing data, along with QuickBird images with a high spatial resolution.
Three major modifications were made in the proposed approach for LULC classification and change detection. First, the endmembers (training sites) were collected from QuickBird images with a spatial resolution of 0.6 m, supported with by the field observation and knowledge of the authors. Second, a set of post-classification steps, which included a Soble filter, majority/minority analysis, sieve classes and clump classes, was applied to the SAM outputs. Third, identifying a suitable threshold (between −1 and +1) was applied to each pair of classes. The result showed that the proposed modification and integrated approach achieved the best LULC classification and increased the precision of change detection.
SAM outputs using the proposed modification (LULC maps) were compared with the SAM outputs before applying any modification. The comparison was performed by visually checking and constructing a confusion matrix as well as assessing accuracy in each LULC map. The overall accuracy suggested that the proposed modification of the SAM was much better than before. The overall accuracy of the LULC classification of 2015 was 96.0965% (kappa coefficient of 0.9409), while most of the classes (except sand dunes and roads) have user’s and producer accuracy values higher than 80%. The overall accuracy and visual checking show that the proposed methods represent an efficient and robust approach for LULC classification and monitoring changes.
The output of the proposed approach provides extra geological information over a regional scale, which could not be collected during a field survey. While the newly obtained LULC maps can be used in further studies to investigate the impact of intensive urbanisation regarding groundwater, air quality and soil pollution.
Disclosure statement
No potential conflict of interest was reported by the authors.
References
- Bagan, H., Q. X. Wang, M. Watanabe, Y. H. Yang, and J. Ma. 2005. “Land Cover Classification from MODIS EVI Times-Series Data Using SOM Neural Network.” International Journal of Remote Sensing 26 (22): 4999–5012. doi: 10.1080/01431160500206650
- Berberoglu, S., C. D. Lloyd, P. M. Atkinson, and P. J. Curran. 2000. “The Integration of Spectral and Textural Information Using Neural Networks for Land Cover Mapping in the Mediterranean.” Computers and Geosciences 26: 385–396. doi: 10.1016/S0098-3004(99)00119-3
- Cho, M. A., R. Mathieu, and P. Debba. 2009. “Multiple Endmember Spectral-Angle-Mapper (SAM) Analysis Improves Discrimination of Savanna Tree Species.” First Workshop on Hyperspectral Image and Signal Processing: Evolution in Remote Sensing, 2009. WHISPERS’09, Grenoble, France, 1–4. IEEE.
- Congalton, R. G. 1991. “A Review of Assessing the Accuracy of Classifications of Remotely Sensed Data.” Remote Sensing of Environment 37 (1): 35–46. doi: 10.1016/0034-4257(91)90048-B
- Congalton, R. G., R. G. Oderwald, and R. A. Mead. 1983. “Assessing Landsat Classification Accuracy Using Discrete Multivariate Analysis Statistical Techniques.” Photogrammetric Engineering and Remote Sensing 49 (12): 1671–1678.
- Coppin, P., I. Jonckheere, K. Nackaerts, B. Muys, and E. Lambin. 2004. “Digital Change Detection Methods in Ecosystem Monitoring: A Review.” International Journal of Remote Sensing 25: 1565–1596. doi:10.1080/0143116031000101675.
- Couturier, S., J. Gastellu-Etchegorry, P. Patiño, and E. Martin. 2009. “A Model-Based Performance Test for Forest Classifiers on Remote-Sensing Imagery.” Forest Ecology and Management 257: 23–37. doi: 10.1016/j.foreco.2008.08.017
- Derrode, S., G. Mercier, and W. Pieczynski. 1994. “Unsupervised Change Detection in SAR Images Using Multicomponent HMC Models.” International Workshop on the Analysis of Multi-Temporal Remote Sensing Images, Italy, 16–18.
- Elmahdy, S. I. 2008. “Toward Better Mapping the Ophiolite Rocks of Northern Part of Oman Mountains Using LANDSAT ETM+ and ASTER Images.” International Journal of Geoinformatics 4 (2), 51–58.
- Elmahdy, S. I., and M. M. Mohamed. 2013. “Remote Sensing and GIS Applications of Surface and Near-Surface Hydromorphological Features in Darfur Region, Sudan.” International Journal of Remote Sensing 34 (13): 4715–4735. doi: 10.1080/01431161.2013.781287
- Elmahdy, S. I., and M. M. Mohamed. 2015. “Automatic Detection of Near Surface Geological and Hydrological Features and Investigating Their Influence on Groundwater Accumulation and Salinity in Southwest Egypt Using Remote Sensing and GIS.” Geocarto International 30 (2): 132–144.
- Elmahdy, S. I., and M. M. Mohamed. 2016a. “Automatic Feature Extraction Module for Change Detection in Al Ain, UAE: Analysis by Means of Multi-Temporal Remote Sensing Data.” Journal of the Indian Society of Remote Sensing 44 (1): 1–10. doi: 10.1007/s12524-015-0448-2
- Elmahdy, S. I., and M. M. Mohamed. 2016b. “Land Use/Land Cover Change Impact on Groundwater Quantity and Quality: A Case Study of Ajman Emirate, the United Arab Emirates, Using Remote Sensing and GIS.” Arabian Journal of Geosciences 9: 722. doi:10.1007/s12517-016-2725-y.
- ENVI User’s Guide. 2008. ENVI On-Line Software User’s Manual. ITT Visual Information Solutions.
- Fisher, P. F. 2010. “Remote Sensing of Land Cover Classes as Type 2 Fuzzy Sets.” Remote Sensing of Environment 114: 309–321. doi: 10.1016/j.rse.2009.09.004
- Foody, G. M. 2002. “Status of Land Cover Classification Accuracy Assessment.” Remote Sensing of Environment 80: 185–201. doi: 10.1016/S0034-4257(01)00295-4
- Fumera, G., F. Roli, and G. Giacinto. 2000. “Reject Option with Multiple Thresholds.” Pattern Recognition 33: 2099–2101. doi: 10.1016/S0031-3203(00)00059-5
- Giri, C., B. Pengra, J. Long, and T. R. Loveland. 2013. “Next Generation of Global Land Cover Characterization, Mapping, and Monitoring.” International Journal of Applied Earth Observation and Geoinformation 25: 30–37. doi: 10.1016/j.jag.2013.03.005
- Girouard, G., A. Bannari, A. El Harti, and A. Desrochers. 2004. “Validated Spectral Angle Mapper Algorithm for Geological Mapping: Comparative Study Between QuickBird and Landsat-TM.” XXth ISPRS congress, geo-imagery bridging continents, Istanbul, Turkey, July, 12–23.
- Gong, P., J. Wang, L. Yu, Y. Zhao, Y. Zhao, L. Liang, Z. Niu, et al. 2013. “Finer Resolution Observation and Monitoring of Global Land Cover: First Mapping Results with Landsat TM and ETM+ Data.” International Journal of Remote Sensing 34: 2607–2654. doi: 10.1080/01431161.2012.748992
- Grebby, S., D. Cunningham, K. Tansey, and J. Naden. 2014. “The Impact of Vegetation on Lithological Mapping Using Airborne Multispectral Data: A Case Study for the North Troodos Region, Cyprus.” Remote Sensing 6 (11): 10860–10887. doi: 10.3390/rs61110860
- Griffiths, G. H. 1988. “Monitoring Urban Change from Landsat TM and Spot Satellite Imagery by Image Differencing.” Proceedings of the 1988 International Geoscience and Remote Sensing Symposium, Vol. 1, Edinburgh, UK.
- Hadigheh, S. M. H., and H. Ranjbar. 2013. “Lithological Mapping in the Eastern Part of the Central Iranian Volcanic Belt Using Combined ASTER and IRS Data.” Journal of the Indian Society of Remote Sensing 41 (4): 921–931. doi: 10.1007/s12524-013-0284-1
- Hagner, O., and H. Reese. 2007. “A Method for Calibrated Maximum Likelihood Classification of Forest Types.” Remote Sensing of Environment 110: 438–444. doi: 10.1016/j.rse.2006.08.017
- Hecker, C., M. Van der Meijde, H. van der Werff, and F. D. van der Meer. 2008. “Assessing the Influence of Reference Spectra on Synthetic SAM Classification Results.” IEEE Transactions on Geoscience and Remote Sensing 46 (12): 4162–4172. doi: 10.1109/TGRS.2008.2001035
- Hunter, E. L., and C. H. Power. 2002. “An Assessment of Two Classification Methods for Mapping Thames Estuary Intertidal Habitats Using CASI Data.” International Journal of Remote Sensing 23: 2989–3008. doi: 10.1080/01431160110075596
- Im, J., J. R. Jensen, and J. A. Tullis. 2008. “Object-Based Change Detection Using Correlation Image Analysis and Image Segmentation Techniques.” International Journal of Remote Sensing 29: 399–423. doi: 10.1080/01431160601075582
- Jensen, J. 2005. Introductory Digital Image Processing: A Remote Sensing Perspective. 3rd ed. Englewood Cliffs, NJ: Prentice-Hall.
- JICA (Japanese International Cooperation Agency). 1996. “The Master Plan Study on the Groundwater Resources Development for Agriculture in the Vicinity of Al Dhaid in the UAE.” Final Report, JICA International Cooperation Agency.
- Jin, S., L. Yang, Z. Zhu, and C. Homer. 2017. “A Land Cover Change Detection and Classification Protocol for Updating Alaska NLCD 2001 to 2011.” Remote Sensing of Environment 195: 44–55. doi: 10.1016/j.rse.2017.04.021
- Kavzoglu, T. 2009. “Increasing the Accuracy of Neural Network Classification Using Refined Training Data.” Environmental Modeling & Software 24: 850–858. doi: 10.1016/j.envsoft.2008.11.012
- Kruse, F. A., A. B. Lefkoff, J. B. Boardman, K. B. Heidebrecht, A. T. Shapiro, P. J. Barloon, and A. F. H. Goetz. 1993. “The Spectral Image Processing System (SIPS) – Interactive Visualization and Analysis of Imaging Spectrometer Data.” Remote Sensing of Environment 44: 145–163. doi: 10.1016/0034-4257(93)90013-N
- Kumar, U. 2006. “Comparative Evaluation of the Algorithms for Land Cover Mapping Using Hyperspectral Data.” Master's thesis, International Institute for Geo-Information Science and Earth Observation, Enschede, Netherlands.
- Liu, X., and C. Yang. 2013. “A Kernel Spectral Angle Mapper Algorithm for Remote Sensing Image Classification.” 2013 6th International Congress on Image and Signal Processing (CISP), Vol. 2, Hangzhou, China, 814–818. IEEE.
- Lu, D., P. Mausel, M. Batistella, and E. Moran. 2005. “Land-Cover Binary Change Detection Methods for use in the Moist Tropical Region of the Amazon: A Comparative Study.” International Journal of Remote Sensing 26 (1): 101–114. doi: 10.1080/01431160410001720748
- Lu, D., P. Mausel, E. Brondizio, and E. Moran. 2004. “Change Detection Techniques.” International Journal of Remote Sensing 25: 2365–2401. doi:10.1080/0143116031000139863.
- Melgani, F., and L. Bruzzone. 2004. “Classification of Hyperspectral Remote Sensing Images with Support Vector Machines.” IEEE Transactions on Geoscience and Remote Sensing 42 (8): 1778–1790. doi: 10.1109/TGRS.2004.831865
- Momeni, R., P. Aplin, and D. S. Boyd. 2016. “Mapping Complex Urban Land Cover from Spaceborne Imagery: The Influence of Spatial Resolution, Spectral Band Set and Classification Approach.” Remote Sensing 8 (2): 88. doi: 10.3390/rs8020088
- Murphy, R. J., S. T. Monteiro, and S. Schneider. 2012. “Evaluating Classification Techniques for Mapping Vertical Geology Using Field-Based Hyperspectral Sensors.” IEEE Transactions on Geoscience and Remote Sensing 50: 3066–3080. doi: 10.1109/TGRS.2011.2178419
- Nassar, A., A. Blackburn, and D. Whyatt. 2012. “Quantifying Urban Growth in Dubai Emirate: A Geoinformatics Approach.” Proceedings of the GIS Research UK 20th Annual Conference, 375–382. University of Sheffield.
- Petropoulos, G. P., K. P. Vadrevu, and C. Kalaitzidis. 2013. “Spectral Angle Mapper and Object-Based Classification Combined with Hyperspectral Remote Sensing Imagery for Obtaining Land Use/Cover Mapping in a Mediterranean Region.” Geocarto International 28 (2): 114–129. doi: 10.1080/10106049.2012.668950
- Rashed, T., and C. Jürgens, eds. 2010. Remote Sensing of Urban and Suburban Areas. Vol. 10. New York: Springer Science & Business Media.
- Rashmi, S., S. Addamani, and S. Ravikiran. 2014. “Spectral Angle Mapper Algorithm for Remote Sensing Image Classification.” IJISET–International Journal of Innovative Science, Engineering & Technology 50 (4): 201–205.
- Roy, D. P., M. A. Wulder, T. R. Loveland, C. E. Woodcock, R. G. Allen, M. C. Anderson, D. Helder, et al. 2014. “Landsat-8: Science and Product Vision for Terrestrial Global Change Research.” Remote Sensing of Environment 145: 154–172. doi: 10.1016/j.rse.2014.02.001
- Saeed, A. M., A. Bushahab, and A. S. Obaid. 2012. “Application of DubaiSat-1 Imagery.” International Symposium on Remote Sensing (ISRS), Berlin, Germany.
- Saeed, A. M., and A. M. Fatima. 2016. Coastline Extraction using Satellite Imagery and Image Processing Techniques. Red, 600, 720 nm.
- Saksa, T., J. Uuttera, T. Kolström, M. Lehikoinen, A. Pekkarinen, and V. Sarvi. 2003. “Clear-Cut Detection in Boreal Forest Aided by Remote Sensing.” Scandinavian Journal of Forest Research 18 (6): 537–546. doi: 10.1080/02827580310016881
- Small, C. 2003. “High Spatial Resolution Spectral Mixture Analysis of Urban Reflectance.” Remote Sensing of Environment 88: 170–186. doi: 10.1016/j.rse.2003.04.008
- Taha, L. G. E. D., and A. A. Al fattah Shahin. 2014. “Improvement of SAM Land Cover Classification of Airborne Hyperspectral Data Using Expert System.” Open Journal of Remote Sensing and Positioning 1 (1): 1–15. doi: 10.15764/RSP.2014.01001
- Uzun, O., F. Dilek, F. Erduran, and S. Accedil. 2011. “National and Regional Landscape Classification and Mapping of Turkey: Konya Closed Basin, Suğla Lake and Its Surrounding Area.” International Journal of Physical Sciences 6 (3): 550–565.
- Wu, C., and A. T. Murray. 2003. “Estimating Impervious Surface Distribution by Spectral Mixture Analysis.” Remote Sensing of Environment 84: 493–505. doi: 10.1016/S0034-4257(02)00136-0
- Zhang, X., and P. Li. 2014. “Lithological Mapping from Hyperspectral Data by Improved Use of Spectral Angle Mapper.” International Journal of Applied Earth Observation and Geoinformation 31: 95–109. doi: 10.1016/j.jag.2014.03.007