
ABSTRACT
Today’s workforce environments are steadily becoming more distributed across the globe, calling for improved ways of facilitating collaborations at a distance, including geo-collaborations or collaborations at critical locations. Newer technology is allowing distributed teams to move away from traditional conference rooms, taking collaborations into the field and giving remote teams more information about the environment. This idea of situating a remote collaborator’s experiences in the field, virtually, promises to enhance the understanding of geographically remote spaces. Newer technologies in virtual reality (VR) hold promise for providing mobile spatial experiences in real-time, without being tied to fixed hardware, such as systems in conference rooms. An exploratory study using VR technology on remote user experiences in a collaboration was conducted to identify the added value for remote collaborators. The findings suggest immersive capabilities improve feelings of presence in the remote locations and perceptions of being in the remote location increase feelings of team membership.
KEYWORDS:
1. Introduction
Technology improves our ability to communicate and share information across distance, giving us access to remote sites, and creating a basis for distributed geo-collaborations (Wu et al. Citation2009). Collaborations about location-specific activities, such as disaster management, may take remote collaborators to locations that can be difficult or dangerous to reach. For instance, personnel on-scene for a disaster may need to plan responses with input from personnel who cannot travel there. In many situations, decision-makers may not have time or resources to visit remote locations and oftentimes rely on geographic representations, such as maps created using geographic information systems. Geographic data help to build situational awareness of a location for informed decision-making (Resch, Schmidt, and Blaschke Citation2007; Chen et al. Citation2013). According to Sonnenwald, Maglaughlin, and Whitton (Citation2004), situational awareness can significantly improve communication.
Situational awareness (also situation awareness) is defined as knowledge accessible at a given time to help create a coherent picture for assessing a situation (Sarter and Woods Citation1991). An earlier definition by Endsley (Citation1988) identifies situational awareness in three parts: (1) perception of elements in the environment within a certain time and space, (2) comprehending the meaning of those elements, and (3) projecting their near future status. In essence, situational awareness deals with how an individual comprehends what is happening in their immediate environment. To maximize situational awareness, technology-mediated experiences need to provide immediate and accurate environment information.
Site visits to remote locations are a natural way to increase situational awareness and help solve problems where location-specific factors are important, such as infrastructure planning or natural hazard management. Geospatial data often go hand-in-hand with field investigations, for example, site selection for landfills (Şener, Süzen, and Doyuran Citation2006), or landslide risk analysis (Lin and Tung Citation2004). Within environmental management, there is need for local stakeholder participation in decision-making, and the role of the field visits which use the landscape as a reference in lieu of ‘post-it notes and flip-charts’ (Reed Citation2008). However, visiting sites in person is not always practical or cost-effective, such as for remote infrastructure like mountain top communications towers. This leaves a question of how to provide in-situ, site-specific collaboration experiences to remote users.
Since the 1990s, virtual reality (VR) has shown great promise providing a multi-modal platform for collaboration (Ramesh and Andrews Citation1999; Chen et al. Citation2012). Currently, remote collaborators can easily join meetings virtually through various equipment; however, limitations exist in what a remote collaborator may experience and interact with through common audio and video communication (Gauglitz et al. Citation2014). Such limitations stem beyond technological and connectivity challenges, and relate more to experiences and organization of remote parties (Riemer, Steinfield, and Vogel Citation2009). These experiences allow first-person engagement with remote locations potentially creating awareness of environmental situations. So, the more engaged by the collaborative medium, the more a remote collaborator should feel part of a team, potentially making more contributions.
VR technology has long been a communication tool, but recent renewal in interest towards such technology has created a boom in development and application (Bellini et al. Citation2016). The Oculus Rift head-mounted display (HMD) released first in 2012 is widely credited with renewing interest in VR (Kumparak Citation2014). This market boom is largely due to breakthroughs in the quality and price of necessary hardware. Necessary technologies include miniaturized sensors and displays created for smartphones (Wingfield Citation2013). These sensors in turn make possible, higher quality and more responsive experiences that significantly reduce the chance of simulator sickness, a known issue with HMDs (Kumparak Citation2014).
Existing research on VR-based remote collaborations has generated only limited understanding of the role of aspects of technology, and is hampered by conceptual ambiguity. Studies often examine technology by comparing a single system against a real world experience (e.g. a co-located team) in a ‘black-box’ approach, rather than comparing different types of technology to each other. Another key issue in researching VR systems for collaboration is the ambiguity of concepts and terminology. Related but fundamentally different concepts such as presence and immersion are often confused (Slater Citation1999). By carefully considering conceptual clarity, studies can be made more replicable and comparable while advancing an understanding of the role of such technology.
The impact of technology on perceptions of team membership and feeling spatially present in a remote collaboration has not been fully explored. Collaborative systems provide technologically limited access to remote collaborators, and those limitations can affect spatial experiences, feelings of team membership, and interactions. ‘Collaboration is situated in a medium for perception and action; what we can see and do in this medium has profound effects on how we can communicate and interact’ (Gaver Citation1992, 21). This posits two questions: how different immersive technologies enable remote collaborators to feel present in a meeting space and what the implications are for team membership.
With a focus on geographically distributed collaboration, the potential of newer VR technology is explored. We first present background on geo-collaborations and spatial experiences through VR technology and collaborative environments. We then describe our methods for conducting an exploratory study of remote collaborator perceptions using VR technology to complete a simple collaborative task. We conclude with a discussion of our findings, implications for the geoscience disciplines.
2. Geo-collaboration and virtual geosciences
MacEachren and Brewer (Citation2004) defined the term geo-collaboration to describe ‘visually-enabled collaboration with geospatial information through geospatial technologies,’ and created a conceptual framework for research into how to best enable it. A wide range of domains including scientific research, science education, emergency management, and planning were identified as important application areas. MacEachren and Brewer asserted that creating usable geo-collaboration systems requires depicting a participant’s location, viewpoint, and actions within the environment, both to themselves and to other users. Despite this early emphasis, research in geo-collaboration has often focused on how to integrate simultaneous interaction with geospatial data and representations, such as Heard et al. (Citation2014) and Convertino et al. (Citation2005), rather than directly using an environment. However, Heiser, Tversky, and Silverman (Citation2004) found that being in the same space as a collaborator plays a crucial role in map-based collaborative problem-solving.
3. Spatial experience in virtual collaborative environments
Spatial experiences in collaborative environments can mean anything from 3D interactive environments with avatars to live-streaming video. 3D interactive environments, virtual environments (VE), offer synthetic spatial experiences understood through the constructs of immersion and presence. With the renewed interest in development of virtual technology, the fidelity and quality of VEs are vastly improving. These improvements have shown direct impacts on spatial experiences (Balakrishnan et al. Citation2012). In turn, spatial experiences have positive influences on knowledge development and transfer to real world applications (Choi and Hannafin Citation1995). Schroeder (Citation2006) found that camera-based collaborative environments induce feelings of presence similar to VE. This suggests that camera-based collaborative environments can be examined from a similar perspective as VE.
3.1. Immersion
Immersion, an ambiguous concept in VR, is a result of multiple interpretations of the original definition of submersion into a medium (Murray Citation1997). Immersion represents ‘submerging’ a user’s senses (visual, audio, etc.) into a digital (synthetic) environment. This idea of submersion has been translated to represent engagement with a user’s senses, which is facilitated through various mechanisms including factors of cognitive absorption (Agarwal and Karahanna Citation2000). Slater (Citation1999) distinguished immersion from similar concepts, defining it as an objective technology-focused phenomenon. The most common form of immersion is visual immersion, as most VR technology focuses on what a user is able to see through a display device such as a monitor or HMD. Visual immersion refers to the engagement of a user’s visual senses through the capabilities of a display device.
VR devices greatly differ, but can be compared in terms of specific features, or affordances. Greeno (Citation1994) adapts Gibson’s idea of affordances, denoting them as properties of an environment that allow for action or perception of action by the appropriate entity. For instance, a coffee mug handle (property of an environment) allows a hand (an appropriate entity) to grasp. In our understanding of affordances, we denote features of VR display devices. Adapting Bowman and McMahan’s (Citation2007) description of display device characteristics, visual immersion can be operationalized as different features across different display devices. This leads us to identify a specific feature shared across most devices.
VR technology supports wider fields of view (FOV) than standard displays. FOV refers to the physical field in which a user can see a simulated space. It relates to how much a user’s direct and peripheral vision is filled by a specific display device. Humans generally have a specified FOV of 200° horizontally and 135° vertically (Arthur Citation2000). FOV is known to have an impact on sense of presence and memory (Balakrishnan and Sundar Citation2011; Balakrishnan et al. Citation2012). From this information, we considered visual immersion by the affordance of FOV and vary it based on the display technology involved.
3.2. Dimensions of presence
Presence is a commonly measured construct in spatial experience research. The construct of presence consists of a number of dimensions specific to different contexts such as spatial, co-, or tele-presence. Each dimension has the same foundational meaning: that a user feels present within a given medium, perceiving virtual content (Steuer Citation1992). The different dimensions help further distinguish the context in which presence occurs. The dimensions of presence cover a range of contextually different concepts that are often used interchangeably (Zhao Citation2003).
In VR collaborations, two dimensions of presence are commonly considered: spatial presence and co-presence. Spatial presence relates to the believability of being within a mediated space. Users identify a virtual space as the space they can act and perform in (Wirth et al. Citation2007). Spatial presence in high-fidelity environments forms through focused attention, attentional allocation, allowing users to become absorbed in a VE (Balakrishnan and Sundar Citation2011; Oprean Citation2014). Self-report directly following an experience is a common form of measurement. Measures for spatial presence can include attentional allocation, spatial situation model, self-location, and possibilities for action (Vorderer et al. Citation2004); where self-location is the central measure.
The other dimension of presence for VR collaborations is co-presence (Schroeder Citation2006). Co-presence, also known as social presence, focuses on connection with others in virtual spaces (Nowak and Biocca Citation2003). This human–human relation is central to how co-presence forms (Zhao Citation2003). Co-presence is measured through self-report, with measures focusing on the believability of being with others in a computer-mediated space (Slater et al. Citation2000).
3.3. Presence and immersion
Immersion is based on the technology, making it more objective than presence. We follow Slater’s (Citation1999) distinction: immersion as a product of technology providing sensory engagement and presence as the subjective feeling of successfully submerging, or perception of, the senses (Steuer Citation1992). Our focus tests different levels of immersive technology to measure presence in various forms (spatial and co-). Therefore, providing higher levels of immersion should increase the sense of presence experienced.
The relationship between immersion and presence forms at the point when user attention is focused (or absorbed) to allow for involvement in the content through sensory engagement (Oprean Citation2014; Ryan Citation2015). This understanding gives us a framework for measuring the influence of immersion on presence and consideration for potential covariates related to attention and absorption. From this framework, we can take our operationalization of immersion, FOV, and vary it to measure resulting sense of presence responses in terms of spatial presence and co-presence. We therefore hypothesize that:
H1: A wider field of view will improve spatial and co-presence.
Spatial presence is influenced by changes in FOV, where a wider FOV increased measures of spatial presence in a VE (Balakrishnan et al. Citation2012). As presence is theorized to form based on attention, absorption, and involvement, there is a need to control for other influencing variables, such as enjoyment, attention, and absorption. We believe the wider FOV will produce similar results in relation to self-location for live-streamed video. Co-presence is influenced by the interface of a collaborative system and how the interface identifies other individuals (Zhao Citation2003). We believe a wider field of view (FOV) will change the experience, increasing their sense of co-presence.
3.4. Interactivity for knowledge building
The degree of control a remote collaborator has navigating a meeting space is a direct result of the interaction afforded by a collaborative system. Balakrishnan and Sundar (Citation2011) suggest the degree of navigable control can also improve spatial experiences. However, in collaborations using live-streaming video, cameras are often fixed, leaving little navigable control. Collaborative systems that afford remote user camera control are often confined to high-end meeting spaces. Newer consumer-grade 360° cameras have the potential to provide navigation control to remote collaborators. Therefore, we consider the overall influence of a live-streaming 360° camera as a testable format for facilitating computer-mediated face-to-face collaborative meetings.
3.5. ‘Team satisfaction’ as team membership
Collaborative teams facilitated through technology are considered by degrees of virtuality, which refers to the degree a team is dependent on technology mediation (Schweitzer and Duxbury Citation2010). The definition of virtuality distinguishes ‘virtual’ teams as different from proximate teams. Chudoba et al. (Citation2005) formalize three criteria for identifying virtuality: team distribution, workplace mobility, and variety of practices. However, these criteria are influenced by factors of social interaction, knowledge sharing, and predictability. The culmination of factors that make up virtuality can be used to identify membership in a team. Virtuality relates to team members feeling a part of a team, and can be measured through self-report on perceptions of team satisfaction and performance (Schweitzer and Duxbury Citation2010). Satisfaction with technology-mediated collaborations is a common measure for establishing perceptions of team membership and activity (Schouten, van den Hooff, and Feldberg Citation2010).
In a virtual collaboration, it is also important to consider the relationship between satisfaction and the sense of presence. So and Brush (Citation2008) suggest no relationship exists between social presence and satisfaction. This suggests the measure of co-presence will not relate to satisfaction. However, the role of spatial presence has not been explored. Once spatial presence has been considered, satisfaction based on the context of the collaboration can be explored. We therefore hypothesize that:
H2: A relationship exists between spatial presence and team satisfaction.
H3: The collaboration location will improve team satisfaction.
4. Method
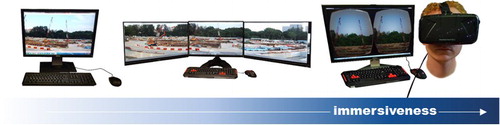
We conducted an exploratory 3 (immersiveness) × 2 (location) between-subjects experiment where we manipulated two factors concerning remote collaborations with VR. We manipulated three levels of immersiveness as FOV across two different remote locations. Our three levels of FOV were operationalized as a single monitor for the narrow condition, three connected monitors for the medium condition, and a HMD for the wide condition. Our two locations were a conference room with standard projector and screen and an outdoor plaza. This design randomly assigned participants into one of six possible conditions, see .
Table 1. Conditions of experimental design.
The study enabled participants to take advantage of the wider FOV provided by the 360° camera by controlling for interactivity. As each display type worked with a different type of input device for interaction, it was important to make the interaction generalizable. Interactivity was operationalized as navigability, as described in Balakrishnan and Sundar (Citation2011). The level of navigability available through the combination of the 360° camera and display device was rotational movement (rotating the viewpoint around a fixed point). This allowed for control over the level of interactivity. Movement was limited to rotating the camera to change the viewpoint. Our resulting design was three levels of immersiveness as display devices with varying degrees of FOV and limited rotational interaction through either keyboard or head-tracking interaction, see .
Figure 1. Experimental design with levels of FOV as immersiveness.
4.1. Remote collaborator experiences as measures
All measures were collected as self-report measures using a 1–9 Likert scale format anchored with ‘strongly agree’ to ‘strongly disagree.’ The measures were adapted from well-known studies to address our concepts of presence and team membership. We selected specific dimensions of our concepts as dependent variables of spatial presence, co-presence, and team membership. We operationalized these dependent variables into measurable dimensions where spatial presence was measured as self-location, co-presence as co-presence, and team membership as team satisfaction.
Spatial presence measures were adapted from Measurement, Effects, Conditions Spatial Presence Questionnaire (MEC-SPQ) (Vorderer et al. Citation2004). The MEC-SPQ comprises several measures, see Vorderer et al. (Citation2004), aligning with different aspects of spatial presence with the central measure being self-location. Self-location, consisting of four items, measures the degree of the ‘experience of being located in the mediated environment’ (Wirth et al. Citation2007, 496). Co-presence measures were adapted from Slater et al. (Citation2000). Team membership was operationalized as team satisfaction, from Schweitzer and Duxbury’s (Citation2010) team virtuality measures. We collected several additional measures to explore as covariates, see .
Table 2. Measures adapted for use in this study.
The first covariate was attentional allocation adapted from the MEC-SPQ (Vorderer et al. Citation2004), and was designated as a covariate for all spatial presence measures. Attentional allocation consists of four items measuring ‘devotion of mental capacities to the media product’ (Wirth et al. Citation2007, 497). We also considered cognitive absorption and adapted temporal dissociation from Agarwal and Karahanna (Citation2000). Temporal dissociation, consisting of five items, measures ‘the inability to register the passage of time while engaged in interaction’ (Agarwal and Karahanna Citation2000, 673). Next was enjoyment, made up of three items adapted from Davis, Bagozzi, and Warshaw (Citation1992). Perceptions of enjoyment could influence attention to the collaboration and subsequently feelings of presence. Enjoyment is a known covariate for presence measures (Oprean Citation2014) as it relates to involvement. Lastly, we included several demographic questions about the participant and previous experience with VR and collaborative technology.
4.2. Experimental setup
Participants, using one of our six conditions, would virtually meet with two researchers acting as collaborators in a semi-structured meeting. Prior to the meeting, participants would fill out the demographics survey and following the meeting, fill out a questionnaire responding to the experience. Our experimental setup consisted of several parts: technology, location, task, and script testing for conditions.
4.3. Collaboration technology setup
A combination of hardware and software technology was used to connect participants to the collaborators (experimenters) visually and aurally. Each participant used the same desktop workstation with an Intel Core i7-5930 K CPU (3.5 GHz, 6 cores), 32GB of RAM, an NVIDIA GeForce GTX 980 Ti GPU, and a 240GB SSD running on Windows 10. The workstation in all conditions was connected to three 23″ 1980 × 1280 monitors, an Oculus Rift Development Kit 2 (DK2) HMD, a USB combination microphone and speaker, the Ricoh Theta S 360° camera (through an HDMI video adapter), and a standard keyboard and mouse. The Theta S camera was used for our experiment as it could stream 360° video using two fisheye lenses. The collaborators were equipped with an Android smartphone and a wireless (Bluetooth) combination speaker and microphone. See for a schematic illustration of this setup.
Figure 2. The overall hardware setup connecting the two locations (participant and remote team members).
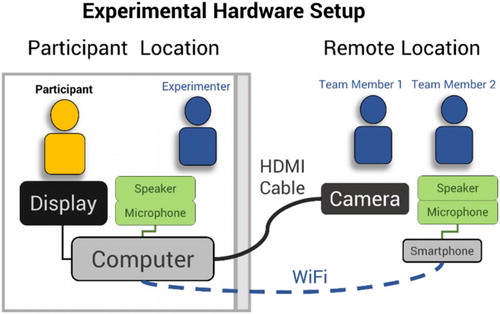
The Oculus Rift development kit 2 (DK2) was selected as the HMD device as it represented the most advanced consumer-level hardware that was widely available at the time of the study. In terms of specifications, the DK2 has a full resolution of 1920 × 1080, divided in half per-eye. It uses a small infrared device placed in front of the user to track head movement. At the time of the study, no 360° video streaming applications were publically available. We used a custom-made platform using the Unity3D game engine to stitch and display the 360° video stream from the Theta S camera to each display device.
As our design focused on differences in FOV, we took steps to ensure we maintained the image scale between each display device’s FOV and the virtual camera in Unity3D’s FOV (Draper et al. Citation2001). In maintaining image scale, participants would experience less distortion of the streamed 360° video. We also adjusted the resolution of the monitors to match that of the DK2, the display with the lowest resolution, to prevent undue influence of resolution. Lastly, the audio connection was through Microsoft Skype over a WiFi connection.
4.4. Collaboration location
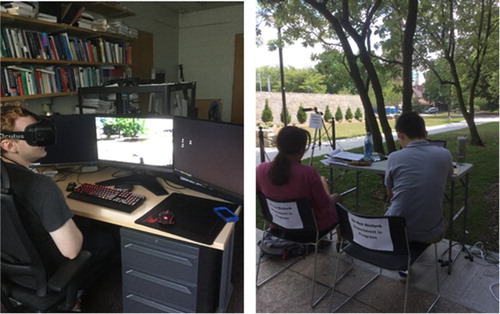
Location was manipulated to represent a traditional conference setting where representations of an environment (i.e. a maps, photographs, and text descriptions) were used to convey details of the problem versus meeting in the actual environment. The same environmental information, in the form of bulleted lists, photographs, and a map, was provided to participants. Two sets of locations were used as our manipulation, an office and a meeting room for the inside condition or traditional setting, and a different office and a plaza for the outdoor condition or non-conventional setting. See for the indoor condition and for the outdoor condition. The change in offices was necessitated by the maximum distance the camera could be from the desktop. Care was taken to keep the overall hardware setup the same in both conditions. The camera was mounted on a tripod, the location kept constant between experiment runs.
Figure 3. Indoor location with participant office space on the left and collaborator conference room on the right.
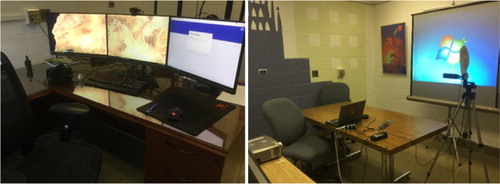
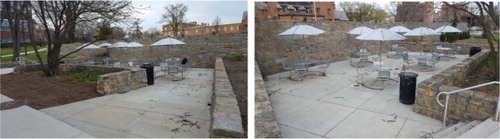
Figure 4. Outdoor location with participant office space on the left and collaborator plaza on the right.
4.5. Task for collaboration
To emulate an actual meeting, participants were asked to virtually meet with two collaborators to decide on placement of recycling bins in a plaza on a college campus. The simple spatial task allowed for focus on user perceptions of the role of our technology manipulations during a collaboration without the complications of a more complex task. Participants were provided with the task requirements and photos of the site for reference before joining the meeting, see .
Figure 5. Reference photos shown to participants when introducing the task.
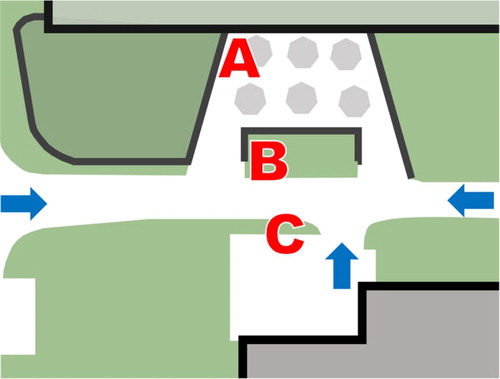
The task was to act as part of a committee deciding on where to place recycling bins in a plaza on a university campus. The task was limited to a 10-minute virtual meeting with two other collaborators who managed the meeting. In the meeting, the collaborators would share a simplified map of three potential locations where the recycling bins could be placed, see . Participants were asked to participate by providing a choice with rationale while discussing the other collaborator’s choices with the goal of coming to consensus on a solution.
Figure 6. The map of potential locations (A, B, C) in an outdoor plaza for recycling bin placement shown to participants.
4.6. Script testing for collaboration and conditions
In order to refine the experimental setup (particularly the semi-structured meeting), pre-testing was conducted using a script for the two collaborators. This helped verify the meeting would keep to 10 minutes, as well as finalizing other aspects such as camera placement and material provided to participants.
Two researchers were assigned a conversation script to conduct the remote meeting with the participant as a remote collaborator. The script gave each collaborator a role for conducting the meeting and options on how to respond, depending on specific participant responses. The collaborators memorized, practiced, and helped refine the script prior to pilot testing. To control for the use of the 360° camera, the collaborators provided cues for the participant to move the camera at certain points during the discussion. This scripted use of the 360° camera would help to make sure all participants were able to take advantage of the capability of using a 360° camera regardless of the condition.
5. Analysis and results
A total of N = 90 participants from a northeastern university in the United States participated in the study. Overall, there was an equal distribution of males (n = 45) to females (n = 45) with an average age of 25.8 (SD = 0.50). For academic standing, graduate students accounted for 77% (n = 67) of the majority while seniors accounted for 13% (n = 12) of the sample. Juniors represented 8% (n = 7) while sophomores represented 2% (n = 2) and there was only one freshman accounting for 1% of the sample population. There were two missing data points for academic standing. Participants ranged across 42 different majors. The majority of participants were native English speakers (48.9%, n = 44) closely followed by non-native speakers (42.2%, n = 38). Multilingual participants where English was included accounted for 6.7% (n = 6) with two participants who did not indicate a native language.
The data were checked for the assumptions for all multivariate and univariate tests used. Twelve outliers were removed from the dataset due to missing data points or being extreme values checked visually and through skewness and kurtosis methods (Tabachnick and Fidell Citation2013). After removing the outliers, the data were found to be within acceptable bounds to continue the analysis.
The main analysis consisted of three parts. The first part used a MANCOVA measuring immersiveness and location, controlling for temporal dissociation and enjoyment, on co-presence and self-location. Follow-up analysis was conducted on co-presence and self-location to understand the findings of the MANCOVA. The second part used a Multiple Regression to identify the amount of variance in Team Satisfaction scores predicted by co-presence, self-location, and attentional allocation. Lastly, an ANCOVA for immersiveness and location, covarying self-location and attentional allocation was used to see any impact of our manipulations on Team Satisfaction.
5.1. Immersiveness on self-location and co-presence
Our first hypothesis stated that immersiveness would improve our two measures of presence, self-location, and co-presence. Using a MANCOVA, we tested this hypothesis, covarying Enjoyment and Temporal Dissociation (absorption). The results from the MANCOVA found the level of immersiveness to be significant for Co-Presence and Self-Location, Wilks’ λ = .86, F(4, 138) = 2.65, p < .05, partial η2 = .07. This suggests that scores for these presence measures combined significantly differed between immersiveness conditions, where the higher the level of immersiveness had higher scores of presence, with the exception of the three-screen condition, see .
Table 3. Adjusted means for co-presence and spatial presence.
As the main effect of immersiveness was found significant, we then examined individual comparisons for self-location (F(2, 70) = 1.94, p = .15) and co-presence (F(2, 70) = .95, p = .39). A bivariate correlation between co-presence and self-location revealed a strong relationship, r (78) = .70, p < .001. Individual tests revealed significant influences from the covariates: Temporal Dissociation was significant for covarying self-location, F(1, 70) = 4.71, p < .05, partial η2 = .06. Enjoyment was found to significantly influence both co-presence, F(1, 70) = 13.67, p < .05, partial η2 = .16, and self-location, F(1, 70) = 44.73, p < .05, partial η2 = .39. This suggests that our covariates were influential in revealing the influence of immersiveness on our two dependent variables, though our measure of temporal dissociation did not reveal an influence on co-presence.
We conducted a follow-up univariate analysis, ANCOVA, of immersiveness and location on self-location, controlling for co-presence and enjoyment which showed a significant main effect for immersiveness, F(2, 70) = 4.23, p < .05, partial η2 = .11. The significance in immersiveness showed the Oculus Rift (M = 6.99, SE = .24) scored better than three screens (M = 6.14, SE = .21). Both co-presence (β = .90, t (70) = 6.74, p < .001) and enjoyment (β = .56, t (70) = 5.25, p < .001) significantly covaried, meaning the role of co-presence and enjoyment allowed for the influence of immersiveness to become clear for self-location.
Similarly, we conducted a follow-up ANCOVA of immersiveness and location on co-presence, controlling for self-location and enjoyment. A significant main effect was found for immersivness, F(2, 70) = 3.63, p < .05, partial η2 = .09. The significance in immersiveness showed the three-screen condition (M = 7.11, SE = .15) scoring better than the single-screen condition (M = 6.58, SE = .16). Self-location (β = .44, t (70) = 6.74, p < .001) significantly covaried, while enjoyment did not (β = –.03, t (70) = –.34, p = 0.74). Self-location successfully helped reveal the influence of immersivness on co-presence; however, enjoyment did not play a significant role.
The two follow-up univariate analysis revealed that both co-presence and self-location were influenced by the level of immersiveness but only after controlling for the other measure of presence. This distinction revealed that a difference did exist between co-presence and self-location though they are still highly related as both measures of presence. A key difference lies in the extra covariate of enjoyment that significantly covaried for self-location but not for co-presence. When we covaried self-location in the analysis on co-presence, enjoyment was no longer significant although in the original MANCOVA it did. This supports the notion that co-presence, while correlated to self-location, is actually measuring a different aspect of presence.
5.2. Self-location and team satisfaction
For our next hypothesis, we aimed to address how feeling present impacts team satisfaction through our measures of co-presence and self-location. As we found in the MANCOVA and follow-up ANCOVAs, co-presence and self-location are highly correlated but represent different dimensions of presence. Based on these findings, we aimed to understand which measure of presence to consider influencing team satisfaction. We conducted a Multiple Stepwise Regression to determine how much variance our measures of presence could predict scores of Team Satisfaction.
Multiple Stepwise Regression analysis revealed two models significantly predicted Team Satisfaction scores. Both models excluded Co-Presence, similar to findings by So and Brush (Citation2008). The second model proved to be the best model and was selected for the analysis.
The second model was significant, including Attentional Allocation and Self-Location, F(2, 75) = 25.49, p < .001. R2 for the model was .41, and adjusted R2 was .39. displays the unstandardized regression coefficients (B), standard error, and standardized regression coefficients (β) for Attentional Allocation and Self-Location.
Table 4. Summary of multiple regression coefficients for model 2.
Looking closer at model 2 for the variance in Team Satisfaction, we examined the influence of each predictor. In terms of individual relationships between the independent variables and Team Satisfaction, Attentional Allocation (t = 3.79, p < .001), and Self-Location (t = 3.67, p < .001), each significantly explained Team Satisfaction scores. Co-Presence was excluded from the model due to non-significance (t = .13, p = .89). Together, the two variables contributed 38.9% in shared variability.
5.3. Location on team satisfaction
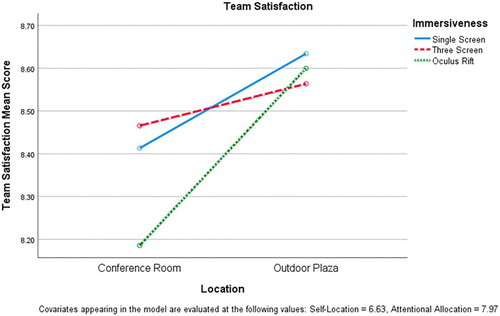
From our two outcomes of immersion influencing both presence measures jointly and self-location significantly predicting team satisfaction, we revisited the role our manipulations with self-location and attentional allocation as covariates on Team Satisfaction. We aimed to address our hypothesis that our manipulation of context would influence Team Satisfaction. Using an ANCOVA of immersiveness and location, we covaried Self-Location and Attentional Allocation, as they were identified as prediction variables, on Team Satisfaction. We found a significant main effect for location in terms of overall Team Satisfaction (F(1,70) = 4.06, p < .05, partial η2 = .06). Immersiveness did not significantly impact team satisfaction, F(2, 70) = .45, p = .64. Participants with the plaza condition reported significantly higher Team Satisfaction scores (M = 8.60, SE = .08) than those who viewed the conference room (M = 8.36, SE = .09), see . As predicted from the regression analysis, Self-Location (β = .13, t (70) = 3.57, p < .001) and Attentional Allocation (β = .29, t (70) = 4.11, p < .001) significantly covaried. Attentional Allocation alone explained 19.4% of the variance in satisfaction whereas Self-Location only accounted for 15.4% of the variance.
Figure 7. Influence of Location after controlling for Spatial Presence on Team Satisfaction.
5.4. Summary of results
For our analysis, we addressed our first hypothesis that immersiveness would influence measures of presence, after controlling for individual differences. A MANCOVA showed significance for immersiveness when controlling for enjoyment and temporal dissociation on the grouped variables of co-presence and self-location. Looking at co-presence and self-location individually did not show any influence from immersion. A correlation showed the two variables were highly related, calling for further follow-up. Individual ANCOVAs revealed that both were impacted by immersiveness where co-presence showed a difference between the single- and three-screen conditions and spatial presence had a difference between the single screen and HMD conditions. Next, we addressed our second hypothesis that feeling present would influence team satisfaction. Using multiple regression, we identified that self-location and attentional allocation explained a large portion of the variance in team satisfaction scores. Co-presence did not influence team satisfaction. Our last analysis addressed the hypothesis that our manipulations will influence team satisfaction after controlling for spatial presence, self-location. Using an ANCOVA, controlling for self-location and attentional allocation, the outdoor plaza reported higher scores for team satisfaction.
6. Discussion
Newer VR technology is promising for geographically distributed collaborations as it is increasingly easier to use and more affordable. Newer technology is also more mobile, deployable to remote sites that may be too dangerous or costly to visit in person, as found in disaster management. We considered the use of VR technology for remote geo-collaborations and proposed that VR technology can place individuals virtually into the location of interest with collaborators, providing increasing their situational awareness and fostering a sense of team membership. From this hypothesis, we derived an exploratory study that builds on existing theoretical frameworks for measuring the influence of VR technology.
We posed the question of how different immersive technologies enable remote collaborators to feel spatially present in a meeting space, and what the implications are for team membership. In our exploratory study, we found the controllable first-person view provided by the 360° camera combined with a more immersive display was able to increase perceptions of both spatial experience (presence) and team membership (satisfaction).
Looking at the role of presence, we found that spatial presence specifically was the most influential. With a location-specific collaborative task, spatial presence logically makes sense. The role of the covariates in particular supports the theoretical idea that cognitive absorption plays a role in the formation of spatial presence (Agarwal and Karahanna Citation2000). In dealing with online collaborations, however, the minimal role of co-presence to the overall results indicates our collaboration where focus was on a location, that inter-personal perceptions were less important. This could be due to a number of factors pertaining to the measures used, collaboration focus, or the short exposure time.
6.1. Outlook and future study
As this study was exploratory in nature, we identified several opportunities for future research on other affordances such as fidelity. Other differences may occur if we expanded both the collaboration settings and measures for capturing the experiences in a more objective manner. A more intensive spatial problem, such as planning for large infrastructure or a complicated multi-stop route, may have different effects. In terms of measures, measuring presence for instance is debated it generally relies on subjective post-questionnaires (Riley, Kaber, and Draper Citation2004; Schuemie et al. Citation2001). We did not consider situational awareness as a measure, which could have had implications (Riley, Kaber, and Draper Citation2004). Additionally, we did not focus on the team dynamics (also important for collaborations; Schweitzer and Duxbury Citation2010), as our setup used two group members with a scripted discussion. Next steps will be to take these questions into studies focused on improving measurement and affordances, focused on use of geographic representations.
Geo-collaborations, in combination with advances in virtual geographic environments (H. Lin et al. Citation2015), are becoming more commonplace as newer technology offers better remote experiences. One relevant area for future study is the integration of live camera feeds with interactive geographic representations, such as a shared 2D map, or even AR-style data overlay onto the environment to increase situational awareness. For example, future interfaces with AR type overlays over 360° video feeds to visualize a new building or other planned project, or having a virtual map, while ‘in’ the photosphere. In considering the role of immersive technology in helping form team membership as an important aspect in collaboratively engaging, for example, in virtual geographic environments (Lin, Chen, and Lu Citation2012), we can gain insight into not only potential productivity but also into the actual adoption and use of such technologies in the field. When we can allow spatial scientists to take remote team members to different locations around the world visually and aurally in high fidelity, the implications for more advanced understanding of geographic phenomena are much improved.
Acknowledgements
The authors would like to thank Yooinn Hong and Xi Liu for participating in this study as moderators.
Disclosure statement
No potential conflict of interest was reported by the authors.
Additional information
Funding
References
- Agarwal, Ritu, and Elena Karahanna. 2000. “Time Flies When You’re Having Fun: Cognitive Absorption and Beliefs About Information Technology Usage.” Management Information Systems Quarterly 24 (4). http://aisel.aisnet.org/misq/vol24/iss4/5 doi: 10.2307/3250951
- Arthur, Kevin W. 2000. “Effects of Field of View on Performance with Head-Mounted Displays.” Doctoral Dissertation, The University of North Carolina at Chapel Hill.
- Balakrishnan, Bimal, Danielle Oprean, Brad Martin, and Melina Smith. 2012. “Virtual Reality: Factors Determining Spatial Presence, Comprehension, and Memory.” In Proceedings of the 12th International Conference on Construction Applications of Virtual Reality, November 1–2, Taipei, Taiwan CONVR 2012, edited by Yu-Cheng Lin and Shih-Chung J. Kang, 451–459. Taipei: National Taiwan University Press.
- Balakrishnan, Bimal, and S. S. Sundar. 2011. “Where Am I? How Can I Get There? Impact of Navigability and Narrative Transportation on Spatial Presence.” Human–Computer Interaction 26 (3): 161–204. doi:10.1080/07370024.2011.601689.
- Bellini, Heather, Wei Chen, Masaru Sugiyama, Marcus Shin, Shateel Alam, and Daiki Takayama. 2016. “Virtual & Augmented Reality: Understanding the Race for the Next Computing Platform.” Profiles in Innovation 1. Accessed 6 August, 2017. http://www.goldmansachs.com/our-thinking/pages/technology-driving-innovation-folder/virtual-and-augmented-reality/report.pdf
- Bowman, Doug A., and Ryan P. McMahan. 2007. “Virtual Reality: How Much Immersion Is Enough?” Computer 40 (7): 36–43. doi:10.1109/MC.2007.257.
- Chen, Min, Hui Lin, Mingyuan Hu, Li He, and Chunxiao Zhang. 2013. “Real-Geographic-Scenario-Based Virtual Social Environments: Integrating Geography with Social Research.” Environment and Planning B: Urban Analytics and City Science 40 (6): 1103–1121. doi:10.1068/b38160.
- Chen, Min, Hui Lin, Yongning Wen, Li He, and Mingyuan Hu. 2012. “Sino-VirtualMoon: A 3D web Platform Using Chang’E-1 Data for Collaborative Research.” Planetary and Space Science 65 (1): 130–136. doi:10.1016/j.pss.2012.01.005.
- Choi, Jeong-Im, and Michael Hannafin. 1995. “Situated Cognition and Learning Environments: Roles, Structures, and Implications for Design.” Educational Technology Research and Development 43 (2): 53–69. doi:10.1007/BF02300472.
- Chudoba, Katherine M., Eleanor Wynn, Mei Lu, and Mary B. Watson-Manheim. 2005. “How Virtual Are We? Measuring Virtuality and Understanding Its Impact in a Global Organization.” Information Systems Journal 15 (4): 279–306. doi:10.1111/j.1365-2575.2005.00200.x.
- Convertino, G., C. H. Ganoe, W. A. Schafer, B. Yost, and J. M. Carroll. 2005. “A Multiple View Approach to Support Common Ground in Distributed and Synchronous Geo-collaboration.” In Third International Conference on Coordinated & Multiple Views in Exploratory Visualization: CMV 2005 July 5, 2005, London, England Proceedings, edited by Jonathan Roberts, 121–132. Los Alamitos, CA: IEEE Computer Society.
- Davis, Fred D., Richard P. Bagozzi, and Paul R. Warshaw. 1992. “Extrinsic and Intrinsic Motivation to Use Computers in the Workplace1.” Journal of Applied Social Psychology 22 (14): 1111–1132. doi:10.1111/j.1559-1816.1992.tb00945.x.
- Draper, Mark H., Erik S. Viirre, Thomas A. Furness, and Valerie J. Gawron. 2001. “Effects of Image Scale and System Time Delay on Simulator Sickness Within Head-coupled Virtual Environments.” Human Factors 43 (1): 129–146. doi:10.1518/001872001775992552.
- Endsley, M. R. 1988. “Situation Awareness Global Assessment Technique (SAGAT).” In Proceedings of the IEEE 1988 National Aerospace and Electronics Conference, 23–27 May 1988, Dayton, OH, USA, 789–795. IEEE.
- Gauglitz, Steffen, Benjamin Nuernberger, Matthew Turk, Tobias Höllerer, Hrvoje Benko, Mira Dontcheva, and Daniel Wigdor. 2014. “World-stabilized Annotations and Virtual Scene Navigation for Remote Collaboration.” In UIST’14: Proceedings of the 27th Annual ACM Symposium on User Interface Software and Technology, 449–459. New York: ACM Press.
- Gaver, William W. 1992. “The Affordances of media Spaces for Collaboration.” In CSCW ‘92: Sharing Perspectives: Conference on Computer-supported Cooperative Work: Papers, edited by Jon A. Turner and Robert Kraut, 17–24. New York: ACM.
- Greeno, James G. 1994. “Gibson’s Affordances.” Psychological Review 101 (2): 336–342. doi:10.1037/0033-295X.101.2.336.
- Heard, Jefferson, Sidharth Thakur, Jessica Losego, and Ken Galluppi. 2014. “Big Board: Teleconferencing Over Maps for Shared Situational Awareness.” Computer Supported Cooperative Work (CSCW) 23 (1): 51–74. doi:10.1007/s10606-013-9191-9.
- Heiser, Julie, Barbara Tversky, and Mia Silverman. 2004. “Sketches for and from Collaboration.” In Visual and Spatial Reasoning in Design III, edited by J. S. Gero, B. Tversky, and T. Knight, 69–78. Sydney: Key Centre for Design Research.
- Kumparak, Greg. 2014. A Brief History of Oculus.” TechCrunch, March 26. Accessed 6 August 2017. https://techcrunch.com/2014/03/26/a-brief-history-of-oculus/
- Lin, Hui, Michael Batty, Sven E. Jørgensen, Bojie Fu, Milan Konecny, Alexey Voinov, Paul Torrens, et al. 2015. “Virtual Environments Begin to Embrace Process-based Geographic Analysis.” Transactions in GIS 19 (4): 493–498. doi:10.1111/tgis.12167.
- Lin, Hui, Min Chen, and Guonian Lu. 2012. “Virtual Geographic Environment: A Workspace for Computer-aided Geographic Experiments.” Annals of the Association of American Geographers 103 (3): 465–482. doi:10.1080/00045608.2012.689234.
- Lin, Meei-Ling, and Chi-Che Tung. 2004. “A GIS-based Potential Analysis of the Landslides Induced by the Chi-Chi Earthquake.” Engineering Geology 71 (1–2): 63–77. doi:10.1016/S0013-7952(03)00126-1.
- MacEachren, Alan M., and Isaac Brewer. 2004. “Developing a Conceptual Framework for Visually-enabled Geocollaboration.” International Journal of Geographical Information Science 18 (1): 1–34. doi:10.1080/13658810310001596094.
- Murray, Janet H. 1997. Hamlet on the Holodeck: The Future of Narrative in Cyberspace/Janet H. Murray. Cambridge: MIT Press.
- Nowak, Kristine L., and Frank Biocca. 2003. “The Effect of the Agency and Anthropomorphism on Users’ Sense of Telepresence, Copresence, and Social Presence in Virtual Environments.” Presence: Teleoperators and Virtual Environments 12 (5): 481–494. doi:10.1162/105474603322761289.
- Oprean, Danielle. 2014. “Understanding the Immersive Experience: Examining the Influence of Visual Immersiveness and Interactivity on Spatial Experiences and Understanding.” Doctoral Dissertation, University of Missouri.
- Ramesh, R., and Dee H. Andrews. 1999. “Distributed Mission Training: Teams, Virtual Reality, and Real-time Networking.” Communications of the ACM 42 (9): 64–67. doi:10.1145/315762.315775.
- Reed, Mark S. 2008. “Stakeholder Participation for Environmental Management: A Literature Review.” Biological Conservation 141 (10): 2417–2431. doi:10.1016/j.biocon.2008.07.014.
- Resch, Bernd, Dirk Schmidt, and Thomas Blaschke. 2007. “Enabling Geographic Situational Awareness in Emergency Management.” In Proceedings of the 2nd Geospatial Integration for Public Safety Conference, 15–17 April 2007, 1–8. Park Ridge, IL: Urban and Regional Information Systems Association (URISA).
- Riemer, Kai, Charles Steinfield, and Doug Vogel. 2009. “eCollaboration: On the Nature and Emergence of Communication and Collaboration Technologies.” Electronic Markets 19 (4): 181–188. doi:10.1007/s12525-009-0023-1.
- Riley, Jennifer, David Kaber, and John V. Draper. 2004. “Situation Awareness and Attention Allocation Measures for Quantifying Telepresence Experiences in Teleoperation.” Human Factors and Ergonomics in Manufacturing 14 (1): 51–67. doi:10.1002/hfm.10050.
- Ryan, Marie-Laure. 2015. Narrative as Virtual Reality 2: Revisiting Immersion and Interactivity in Literature and Electronic media. 2nd ed. Baltimore, MD: Johns Hopkins University Press.
- Sarter, Nadine B., and David D. Woods. 1991. “Situation Awareness: A Critical But Ill-defined Phenomenon.” The International Journal of Aviation Psychology 1 (1): 45–57. doi:10.1207/s15327108ijap0101_4.
- Schouten, Alexander, Bart van den Hooff, and Frans Feldberg. 2010. “Real Decisions in Virtual Worlds: Team Collaboration and Decision Making in 3D Virtual Worlds.” ICIS 2010 Proceedings. http://aisel.aisnet.org/icis2010_submissions/18
- Schroeder, Ralph. 2006. “Being There Together and the Future of Connected Presence.” Presence: Teleoperators and Virtual Environments 15 (4): 438–454. doi:10.1162/pres.15.4.438.
- Schuemie, M. J., P. van der Straaten, M. Krijn, and C. A. van der Mast. 2001. “Research on Presence in Virtual Reality: a Survey.” Cyberpsychology & Behavior: The Impact of the Internet, Multimedia and Virtual Reality on Behavior and Society 4 (2): 183–201. doi:10.1089/109493101300117884.
- Schweitzer, Linda, and Linda Duxbury. 2010. “Conceptualizing and Measuring the Virtuality of Teams.” Information Systems Journal 20 (3): 267–295. doi:10.1111/j.1365-2575.2009.00326.x.
- Şener, Başak, M. L. Süzen, and Vedat Doyuran. 2006. “Landfill Site Selection by Using Geographic Information Systems.” Environmental Geology 49 (3): 376–388. doi:10.1007/s00254-005-0075-2.
- Slater, Mel. 1999. “Measuring Presence: A Response to the Witmer and Singer Presence Questionnaire.” Presence: Teleoperators and Virtual Environments 8 (5): 560–565. doi:10.1162/105474699566477.
- Slater, Mel, Amela Sadagic, Martin Usoh, and Ralph Schroeder. 2000. “Small-group Behavior in a Virtual and Real Environment: A Comparative Study.” Presence: Teleoperators and Virtual Environments 9 (1): 37–51. doi:10.1162/105474600566600.
- So, Hyo-Jeong, and Thomas A. Brush. 2008. “Student Perceptions of Collaborative Learning, Social Presence and Satisfaction in a Blended Learning Environment: Relationships and Critical Factors.” Computers & Education 51 (1): 318–336. doi:10.1016/j.compedu.2007.05.009.
- Sonnenwald, Diane H., Kelly L. Maglaughlin, and Mary C. Whitton. 2004. “Designing to Support Situation Awareness Across Distances: An Example From a Scientific Collaboratory.” Information Processing & Management 40 (6): 989–1011. doi:10.1016/j.ipm.2003.10.002.
- Steuer, Jonathan. 1992. “Defining Virtual Reality: Dimensions Determining Telepresence.” Journal of Communication 42 (4): 73–93. doi:10.1111/j.1460-2466.1992.tb00812.x.
- Tabachnick, Barbara G., and Linda S. Fidell. 2013. Using Multivariate Statistics. 6th ed. Boston, MA: Pearson Education.
- Vorderer, P., W. Wirth, F. R. Gouveia, F. Biocca, T. Saari, F. Jäncke, S. Böcking, et al. 2004. “ MEC Spatial Presence Questionnaire (MEC-SPQ): Short Documentation and Instructions for Application.” Project Presence: MEC (IST-2001-37661). http://www.ijk.hmt-hannover.de/presence
- Wingfield, Nick. 2013. A Matter of Perception.” New York Times, February 17. Accessed 6 August 2017. http://www.nytimes.com/2013/02/18/technology/oculus-rift-headset-aims-for-affordable-virtual-reality.html
- Wirth, Werner, Tilo Hartmann, Saskia Böcking, Peter Vorderer, Christoph Klimmt, Holger Schramm, Timo Saari, et al. 2007. “A Process Model of the Formation of Spatial Presence Experiences.” Media Psychology 9 (3): 493–525. doi:10.1080/15213260701283079.
- Wu, Anna, Xiaolong Zhang, Gregorio Convertino, and John M. Carroll. 2009. “CIVIL.” In GROUP ‘09: Proceedings of the 2009 International ACM SIGGROUP Conference on Supporting Group Work : May 10-13, 2009, Sanibel Island, Florida, USA, edited by Kjeld Schmidt, Mark Pendergast, Mark Ackerman, and Gloria Mark, 273. New York: Association for Computing Machinery.
- Zhao, Shanyang. 2003. “Toward a Taxonomy of Copresence.” Presence: Teleoperators and Virtual Environments 12 (5): 445–455. doi:10.1162/105474603322761261.