
ABSTRACT
Three-dimensional geovisualizations are currently pushed both by technological development and by the demands of experts in various applied areas. In the presented empirical study, we compared the features of real 3D (stereoscopic) versus pseudo 3D (monoscopic) geovisualizations in static and interactive digital elevation models. We tested 39 high-school students in their ability to identify the correct terrain profile from digital elevation models. Students’ performance was recorded and further analysed with respect to their spatial abilities, which were measured by a psychological mental rotation test and think aloud protocol. The results of the study indicated that the influence of the type of 3D visualization (monoscopic/stereoscopic) on the performance of the users is not clear, the level of navigational interactivity has significant influence on the usability of a particular 3D visualization, and finally no influences of the spatial abilities on the performance of the user within the 3D environment were identified.
1. Introduction
The use of 3D technology in applied fields has increased rapidly in the last decades. Starting with the vision of Digital Earth (DE; Gore Citation1998) and later with the advent of virtual globes (e.g. Google Earth), 3D geovisualizations became very popular in practical use under various labels and names. The original idea of DE has developed, and in their vision for the next decade, Craglia et al. (Citation2012, p. 18) described DE as a ‘dynamic framework to share information globally’, targeting the improvement of ‘the complex relationships between society and the environment we live in’. Such a shift of the original paradigm emphasizes not only the technological aspects but also the user’'s ability to understand and effectively harness the presented information.
However, the usability of 3D geovisualization as a tool in practical tasks still remains quite unclear. 3D technologies are deployed in many geo-related areas such as teaching geography, geology, urban planning, and emergency and crisis management (Hunter et al. Citation2016; Lin et al. Citation2015; Herman and Řezník Citation2015; Herbert and Chen Citation2015; Hirmas et al. Citation2014; Popelka and Dědková Citation2014; Řezník, Horáková, and Szturc Citation2013; Konečný Citation2011). Many applied areas usually emphasize the precision of the human operator’'s situational judgement and decision-making, so the ways of representing information in the virtual environment (VE) play an important role in the cognitive processing during tasks. Compared to two-dimensional cartographic visualizations, there are still no clear standards or design principles for the creation of 3D cartographic visualizations (Pegg Citation2011; Haeberling, Bär, and Hurni Citation2008; MacEachren Citation1995). The cartographic principles for 3D cartographic visualization are a current issue discussed in several studies (Lokka and Cöltekin Citation2017; Hájek, Jedlička, and Čada Citation2016; Sieber et al. Citation2016; Semmo et al. Citation2015 ). Also, most of the research on 3D maps was done only on participants who were highly skilled in map reading (Pegg Citation2011). Moreover, the results of many studies indicate ambiguity in 3D cartographic visualization usability and the need for extended research (e.g. Bleisch and Dykes Citation2015; Seipel Citation2013; Pegg Citation2011).
The particular factors influencing the effective and efficient design of virtual 3D environments have been analysed from different viewpoints. Regarding this, Lokka and Cöltekin (Citation2016) presented an analytical study identifying three distinctive groups of key factors: (1) users (spatial abilities, age, gender – both on the general and individual levels), (2) type of stimuli (including the visualization, level of realism, type of interactivity, and other factors), and (3) tasks (particular context of use, specific scenario). Earlier Šašinka (Citation2012) introduced a similar triarchic model where they emphasized the importance and interaction of all three of the above-mentioned categories when working with a map. In their triarchic structural model, they suggested that, e.g. the cognitive strategy used when dealing with particular task depends on the level of map literacy (user group factor), on visualization type (type of stimuli group factor) and also on the nature of the problem which is solved (task group factor).
The focus of this article is a synthesis of two selected stimuli aspects (level of interaction and visualization type) influencing the usefulness of 3D visualization. Based on the previous findings (Špriňarová et al. Citation2015; Herman and Stachoň Citation2016; Klippel, Weaver, and Robinson Citation2011), in our study we explored perception of 3D terrain geovisualizations displayed in real 3D (stereoscopic) and pseudo 3D (monoscopic), in both static and interactive forms. General research questions were defined as follows:
Does the type of 3D visualization (monoscopic/stereoscopic) influence the performance of the users?
Does the level of navigational interactivity influence the usability of 3D visualization?
What is the role of personal spatial abilities in the process of solving 3D visualization tasks?
2. Related work
2.1. Principles of 3D vision
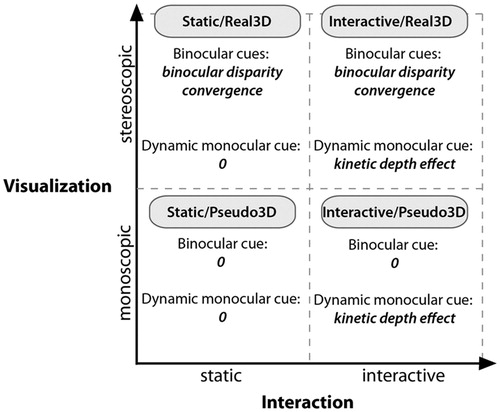
3D visualizations contain a number of visual cues. Some static monocular depth cues are embedded in the 3D visualizations (e.g. lighting and shading cues, occlusion/interposition, relative size of objects, linear perspective, texture gradients, and aerial perspective). Dynamic monocular depth cues, which are considered extremely effective for depth information recognition (Loomis and Eby Citation1988), include motion parallax, i.e. movement of objects, the viewer, or both in the scene; in cartography also referred to as kinetic depth (Willett et al. Citation2015). Such mutual movement can indicate depth information in the viewer’'s visual field through the perception of different distance changes between the viewer and the objects. In some specific visualization environments, we can also use binocular depth cues, which are represented by binocular disparity, in which case we can see a slightly different view of the scene with each eye separately. The result is synthesized in our brain, creating a 3D perception of the scene. Binocular disparity and convergence are usually provided by 3D glasses or another stereoscopic technology such as head-mounted displays.
Based on the number of visual cues used in the visualization, we can distinguish between real and pseudo 3D visualization (Bowman et al. Citation2005). Pseudo 3D (monoscopic) visualizations use only monocular cues, whereas real 3D (stereoscopic) visualizations include both binocular and monocular depth cues (Buchroithner and Knust Citation2013). The added value for real 3D visualization is stereoscopy, provided by binocular depth cues (namely binocular disparity). Stereoscopy is ensured by the use of computer graphics and specific peripheral devices for 3D vision such as 3D glasses. Pseudo 3D (monoscopic) visualization is displayed perspective-monoscopically on flat media or on the computer screen (Buchroithner and Knust Citation2013).
These two types of visualizations can be considered informationally equivalent, i.e. they can present exactly the same amount of spatial information (Larkin and Simon Citation1987). However, they are not computationally equivalent, because each of them uses different cognitive processing of the perceived information. When perceiving binocular depth cues in a real 3D VE, the user is expected to better estimate spatial placement/distribution in the scene (Qian Citation1997; Landy et al. Citation1995). Nevertheless, previous studies dealing with real 3D visualization (e.g. Ware and Franck Citation1996; Zanola, Fabrikant, and Cöltekin Citation2009; Torres et al. Citation2013; Špriňarová et al. Citation2015) reported inconclusive implications for practical use of real 3D technology.
2.2. Interactivity in three-dimensional visualizations
Interactivity in 3D geovisualizations presents the possibility of manipulating the geovisualization. In this article, we focus only on navigational interactivity. Navigational or viewpoint interactivity is defined for example by Roth (Citation2012) and it is the core functionality of applications like Google Earth. Navigational interactivity in 3D space usually includes functions like rotation, panning, and zooming. Interactive (movable, navigable) 3D environments provide then the above-mentioned kinetic depth cues (motion parallax), emphasizing the user’'s 3D perception. From a distributed cognition theory point-of-view (Hutchins Citation1995), we can see the interaction process as the behaviour where both internal (inner mind) and external (in the world, within some external medium) cognitive processes occur. Regarding this, in applied areas, the user interface should always be designed with maximal attention to provide optimal information reach, securing the user’'s situational awareness. Only a few experiments regarding interactive 3D environments (their features and usability) have been published, and navigational interactivity in 3D environments was not necessarily found to be advantageous (Keehner et al. Citation2008). For example, Wilkening and Fabrikant (Citation2013) used Google Earth to help participants solve practical tasks, and measured and analysed movement types applied by the user. Bleisch, Dykes, and Nebiker (Citation2008 ) assessed a potential combination of a 3D environment and abstract data, when comparing differences between reading the height of 2D bar charts and reading bar charts placed in an interactive 3D environment. Herman and Stachoň (Citation2016) published a pilot test comparing static and interactive 3D visualization, and brought enriching methodology for data analysis.
Interactive visualization (i.e. with navigational interactivity) offers more ways to retrieve information than static visualization (i.e. without navigational interactivity). From this point-of-view, the navigational interactivity can be understood as the next frontier of visualization. In , we can see the different ways 3D geovisualization offers a different number and variety of visual cues for four different settings: static pseudo 3D, static real 3D, interactive pseudo 3D, and interactive real 3D geovisualization. The above-mentioned monocular depth cues are ensured by the use of computer graphics and represent the base in all four settings. In the interactive setting, kinetic depth is added, and the real 3D setting includes a cue of binocular disparity. In interactive real 3D environments, it is especially the cues of binocular disparity and navigational options (i.e. panning, zooming, and rotating the geovisualization) allowing the user to acquire more information about the terrain (e.g. kinetic depth effect). Although both mentioned types of visual cues promote effective depth perception when used separately, they can be mutually redundant. We presume that the use of both these visual cues simultaneously don’'t further improve task performance.
Figure 1. Additional depth cues available in different kinds of environments.
2.3. Spatial abilities of users
The role of individual differences in the context of 2D geovisualization use was explored in several studies (e.g. Kubíček et al. Citation2017; Stachoň et al. Citation2013; Griffin et al. Citation2006; Allen, Cowan, and Power Citation2006). Individuals vary not only with respect to the level of map literacy (Rautenbach, Coetzee, and Cöltekin Citation2017), domain-specific expertise (Svatoňová Citation2016), or cognitive style (Kozhevnikov Citation2007), but also with respect to their cognitive abilities – for instance, their working memory capacity (Daneman and Carpenter Citation1980) or spatial ability (Tartre Citation1990). The role of individual differences among users increasingly shifts in focus, leading us to seek to understand whether or not all users profit equally from visualizations and if they do not, how different users can be supported. Klippel, Weaver, and Robinson (Citation2011) substantiated the role of individual differences for cognitive concepts and proposed a methodology to measure them, stressing both the research methodology aspect and the technological push towards the individualization of visual representations. Höffler (Citation2010) developed a meta-analytical review comparing spatial abilities and learning with visualizations. His results, based on 27 different experiments from 19 independent studies, supported a slight advantage of high spatial ability learners in working with visual stimuli, but also demonstrated that this advantage disappears if users with low spatial abilities work with a dynamic environment and 3D visualization.
3. Research aim
In this study, we took into account the above-mentioned models (Šašinka Citation2012; Lokka and Cöltekin Citation2016) and explored human navigational interaction with the 3D environments, investigating all of the previously mentioned key factors. We designed an experiment where we measured the individual participants’ spatial abilities (user issue) before they solved altitude identification tasks in different types of 3D visualizations (real and pseudo 3D) and with different types of control/manipulation possibilities (static and interactive – see ). We expected that in a real (stereoscopic) 3D visualization participants (1) would more accurately estimate the altitude features of the scene (i.e. altitude profiles) when they solve tasks in static (non-moveable) virtual 3D environments. The binocular depth cues included in the real 3D visualization were expected to help ‘real 3D’ users make more precise estimations. In the interactive (moveable) 3D environments, on the other hand, (2) the performance of the real 3D group and the pseudo 3D group was expected to be similar due to the possibility of manipulating the geovisualization. When moving the scene, kinetic depth cues are available for users to correctly judge altitude features in the scene, and in the case of the pseudo 3D participants, the kinetic depth cues are expected to fully compensate for missing binocular cues. Furthermore, users were expected to differ in terms of their individual spatial abilities, which could influence their performance in particular tasks. We measured participants’ spatial abilities with the use of a mental rotation test (MRT), and (3) expected a close correlation between individuals’ spatial abilities and their performance in the virtual geographical model.
4. Methods
4.1. Participants
Thirty-nine volunteers (18 females and 21 males; aged 16–18) were recruited from two high schools in Brno (the Czech Republic). The data were collected during October and November 2016. Before the testing, all the participants and their parents were introduced to the research proposal and study design, which was previously approved by the ethics commission of Masaryk University. All but four participants had some previous basic or intermediate experience with 3D visualization applications, such as watching 3D movies or playing interactive games on a computer, but none of them had experience in interacting with 3D geographical data as used in this study. The participants were randomly divided into two groups with an equal proportion of males and females, in order to balance out the suggested differences between males and females in mental rotation tasks. The experimental conditions (including lighting conditions and other external factors) were identical for both groups. All participants had normal or corrected-to-normal vision, and had no motor/movement limitations. We did not perform an objective visual impairment testing, but no participants reported colour vision impairment during the initial test questionnaire or post-test individual interviews. All participants agreed with the experimental procedure and participated voluntarily, with the open opportunity to withdraw from the testing at any time.
4.2. Materials and geographical data
The test was administered with the testing platform hypothesis (Štěrba et al. Citation2015; Popelka et al. Citation2016). For the main experiment, a new testing application was developed based on the Unity® game engine.Footnote1 The application supports real-time rendering of large 3D geographical models using both monoscopic and stereoscopic displays, and also automates data collection for further analysis. For each task, the user’'s answers and task performance time were logged. After the testing session, data were exported to a structured text file and processed using the R statistical software package.
All 39 participants were tested individually using the same hardware setup: a desktop PC and 27″ display compatible with NVIDIA 3D Vision technology. Users were instructed to put on/off shutter glasses before each section of real 3D/pseudo 3D tasks. A generic PC mouse was used as an input device. In order to keep interaction straightforward for users, we chose an interaction scheme consisting of only three types of actions: orbiting, dragging, and zooming. These actions were controlled by the left button, right button, and mouse wheel, respectively. The range of rotation, panning, and zooming was limited to prevent participants from accidentally moving the terrain completely out of sight or moving a virtual camera below the terrain. Digital terrain models (DTMs) were used for generating 3D models of terrain. A fourth-generation Digital Terrain Model of the Czech Republic (DTM 4G) was acquired by airborne laser scanning and processed to a ground resolution of 5 × 5 m. DTM 4G is now being distributed by ČÚZK (Czech Office for Surveying, Mapping and Cadastre). Six randomly chosen DTMs from various parts of the Czech Republic were used as an input for the experiment. Surfaces with textures were computed from the input DTM and corresponding orthophoto data. 3D models were vertically scaled by variable Z factors (one 3D model had a Z of factor 1, one model a Z of factor 2, three models had a Z factor of 3, and one model had a Z factor of 4), in order to highlight relatively small variation in altitude in the landscapes.
4.3. Procedure design
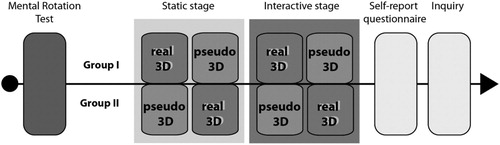
The experimental procedure consisted of three main parts. In the first part, we measured the mental rotation skills of all participants. The second part was the main experiment and included tasks where participants were asked to work with 3D geovisualizations to estimate altitude profiles. In this second part, we measured participants’ abilities to estimate profiles of geographical models in two stages. In the first stage, both static 3D geovisualizations were presented and participants’ estimation of altitude profiles was based only on visual stimuli, with no possibility to interact with the visualizations. The second stage presented interactive environments where participants could manipulate the 3D geovisualizations to estimate the altitude profile. The experiment finished with a third part, which followed immediately after the altitude profile estimation. Using rating scales, participants were briefly interviewed by the experiment operator about their general feelings, previous experience with 3D interactive environments, potential subjective task-solving improvements, and subjective preferences about the task-solving environment.
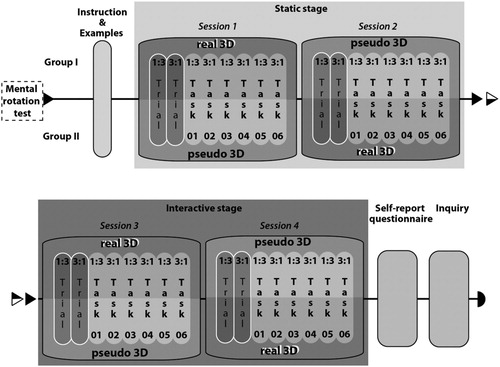
Participants were randomly divided into two groups, which both used the same geographical models, but in a different task order. Tasks were partially counterbalanced by swapping the order of pseudo 3D (monoscopic) and real 3D (stereoscopic) tasks. See for an overview of the experimental design, and see the supplementary video for a detailed understanding of both tests (the supplementary video is available online at https://youtu.be/ddL6gInQFh4). We used a within-subjects 2 × 2 factorial controlled experiment examining stereoscopic versus monoscopic displays (Factor 1: Visualization) and static versus interactive displays (Factor 2: Interaction). All participants experienced all four combinations (static pseudo 3D, static real 3D, interactive pseudo 3D, and interactive real 3D).
Figure 2. Design of the experiment.
4.3.1. Pilot study
We initially conducted a pilot study in order to validate our research tools. At a public scientific event (Researchers’ Night 2016, Brno), 17 participants (11–45 years) tested the application we developed for testing purposes. We observed users’ interactions with the application and we also interviewed participants about the usability of the application and level of subjectively experienced difficulty. Based on this experience, participants found the developed application very user-friendly, stating that even 11-year-old children were able to go through the entire procedure without difficulty. The overall accuracy of the answers throughout the pilot testing was 72%, which indicated an appropriate difficulty level of items and applicability of the research design. After the pilot study, we made some minor adjustments to the instructions and examples (grammar revision, graphic resolution of figures, simplifying of instructions). The test tasks (stimuli, navigation, etc.) were used without any changes.
4.3.2. Task and stimuli
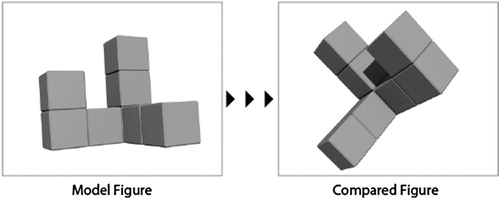
The test arrangement was designed specifically for the purpose of this study. A MRT was used for the test of spatial abilities. The version of the MRT used in the study was developed by Ivana Žahourová as part of a new test battery focused on object-spatial cognitive style (Vidláková Citation2010). The MRT consists of two sub-tests (see ). There are eight tasks in the first visual comparison sub-test. In each task, two objects are displayed simultaneously, and the participant should judge whether the objects are identical or not (see ). In the second sub-test, the memory recall sub-test, the model figure is presented for a given time, and then four other figures are presented individually. Participants should again judge whether the figures that follow are identical to the model figure or not (see ). The total number of correct answers is an indicator of spatial orientation ability (Ekstrom et al. Citation1976). The MRT developed by Žahourová was inspired by and based on concepts from two other psychological tests (Vandenberg-Kuse MRT – Vandenberg and Kuse Citation1978; and the Measure of the Ability to Rotate Mental Images – Campos Citation2012), both of which are very well-grounded in the psychological literature and theories (e.g. Ganis and Kievit Citation2015).
Figure 3. The first part of the experiment, the MRT.
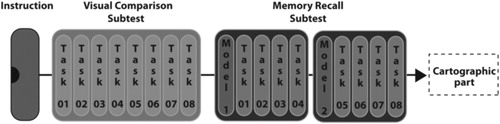
Figure 4. An example of the task from the visual comparison sub-test.
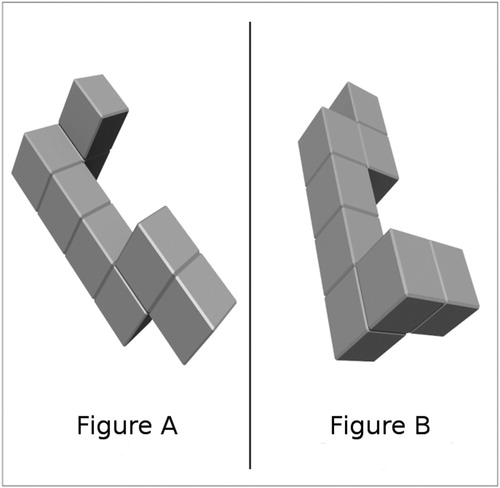
Figure 5. An example of the model figure and figure that follows it from the memory recall sub-test.
The second part of the testing battery included a non-interactive (static) stage and an interactive stage. In the interactive stage, participants were asked to estimate the profiles of digital elevation models displayed in static real 3D (stereoscopic), and static pseudo 3D (monoscopic) visualizations. In order to avoid the learning effect, the order of the real 3D and pseudo3D sessions was swapped for group 1 and group 2 (see ). As seen in , each session consisted first of two training tasks, followed by six experimental tasks.
Figure 6. Detailed schema of the second part of the experiment.
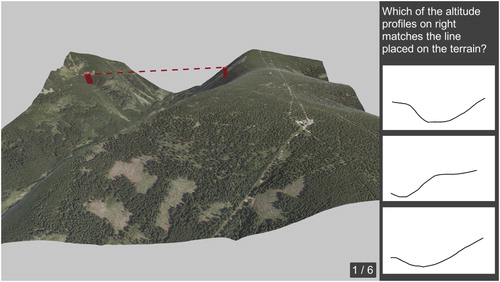
All tasks included the 3D geographical model with a given task and an answer sheet in one screen, as seen in . Two types of tasks, which we labelled ‘1:3’ and ‘3:1’, were alternated in the testing battery. ‘1:3’ tasks displayed a set of two interconnected coloured marks in the geographical terrain on the left part of the screen (). On the right side of the screen, there were three figures with different profiles. Participants were asked to determine which of the profiles matched the real profile between the marks in the terrain.
Figure 7. An example of a ‘1:3’ task. The terrain model with a single pair of connected points is rendered on the left side of the screen. Three different altitude profiles are displayed on the right side – one of them corresponds to the terrain in the model. Screenshot from the testing application.
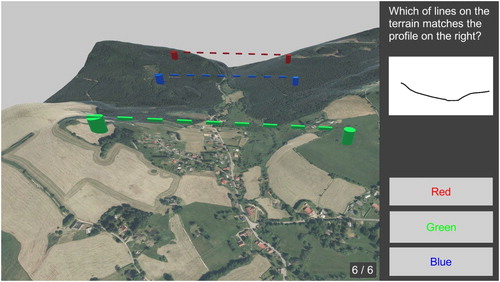
‘3:1’ tasks displayed three pairs of interconnected coloured marks set in the geographical terrain in the left part of the screen (). On the right side, there was a single profile, and participants were asked to determine which one of the three pairs of displayed interconnected coloured marks shown in the terrain in the left part of the screen matched the given profile.
Figure 8. Example of a ‘3:1’ task. The terrain model with three pairs of connected points is rendered on the left side of the screen. A single altitude profile is displayed on the right side. One of the three terrain profiles between the connected points corresponds to the altitude profile. Screenshot was taken from the testing application.
After the end of the testing battery, we asked participants a series of questions focused on their subjective opinions about the different types of interactive 3D visualizations.
5. Results
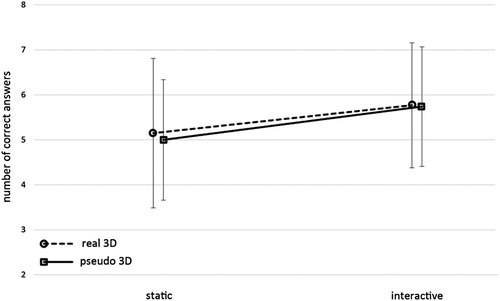
The recorded information about the users’ performance was statistically analysed. Repeated-measures (within-subjects) ANOVA was used for the evaluation of correct answer rates for the altitude profile identification with factors of static–interactive, pseudo 3D–real 3D, and their combinations (). The effects of the order of the pseudo 3D–real 3D conditions were not significant in any of the task combinations (four t-tests brought non-significant results), so that we could analyse the two groups together. Only the difference between the static and interactive tasks was found to be statistically significant (F = 17.068; df = 1; p < .001; η2 = 0.130). Neither the difference between pseudo and real 3D (F = 0.298; df = 1, p = .586; η2 = 0.003) nor the interaction of the two factors (3D cue type and interactivity) was significant (F = 0.152; df = 1; p = .697; η2 = 0.001). We repeated the analyses of the main effects with t-tests with the same results both for static and interactive tasks (t = 2.972, df = 152.3, p-value = .003) and for the pseudo and real 3D conditions (t = –0.382, df = 151.9, p-value = .703).
Figure 9. Number of correct answers in the altitude profile estimation. N = 39 in all conditions. Pseudo 3D (static M = 5.00, SD = 1.34; interactive = 5.74, SD = 1.33) and real 3D (static M = 5.15, SD = 1.66; interactive = 5.77, SD = 1.39).
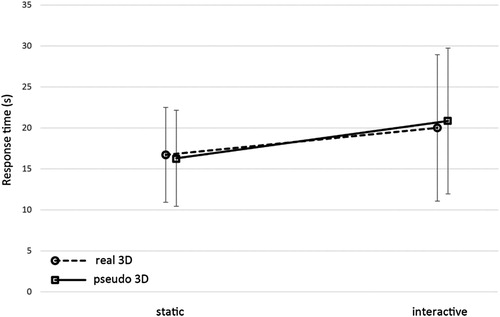
Repeated-measures ANOVA was also used to analyse response times in the altitude profile task (). Again, only the difference between the static and interactive tasks was found to be statistically significant (F = 21,393; df = 1; p < .001; η2 = 0.158). Neither the difference between pseudo 3D and real 3D (F = 0.061; df = 1, p = .805; η2 = 0.001) nor the interaction of the two factors (F = 0.547; df = 1; p = .461; η2 = 0.005) were statistically significant. We repeated the analyses of the main effects with t-tests with the same results both for static and interactive tasks (t = 3.267, df = 132.8, p-value = .001) and for the pseudo and real 3D conditions (t = 0.169, df = 153.9, p-value = .866).
Figure 10. Response time (s) in the altitude profile task. N = 39 in all conditions. Pseudo 3D (static M = 16.30, SD = 5.86; interactive = 20.85, SD = 8.89) and real 3D (static M = 16.72, SD = 5.79; interactive = 20.01, SD = 8.94).
We also performed additional analyses to explore the dataset and look for some potential trends or patterns. Among others, we compared alternative types of tasks (e.g. 1:3 and 3:1) in order to determine whether there were differences in difficulty. We didn’'t find any significant differences in the response time (1:3 m = 18.72 s; 3:1 m = 20.04 s) or accuracy (1:3, 71.7%; 3:1, 79.7%). It seems that the variability in the performance depends above all on the concrete scenes and landscape profiles. We also analysed the data to check for potential learning effects. We addressed this question by means of comparing the results (response time and correctness) for the first and the second sessions of each stage. The differences were not statistically significant for either the static or the interactive stage (see ). Neither was there a recognizable trend in the response time nor in the accuracy between sessions, thus we assumed no learning effect was caused by the order of static and interactive stages.
In order to identify potential gender differences, the Welch Two Sample t-test was used for a comparison of correct answers in altitude profile task between males and females ().
Table 1. Comparison of males (N = 21) and females (N = 18) in the number of correct answers in the altitude profile task.
The Welch Two Sample t-test was also used for the comparison of performance in the MRT between males and females ().
Table 2. Comparison of males (N = 21) and females (N = 18) in the number of correct answers in the MRT.
The Pearson correlation coefficient was used to assess the relationship between the total score in the MRT and performance in geographical tasks. Males (n = 21) and females (n = 18) were tested separately. Among female participants, no correlation was found between their total scores on the MRT and geographical tasks. A low, positive but insignificant correlation was found in males ().
Table 3. Correlation between MRT (total score) and performance in altitude estimation tasks (correct answers).
In the third part of the experiment, with the help of Likert scales, participants rated which type of environment (visualization and interaction) was most difficult for them (see ). Subsequently, they chose which type of task – ‘1:3’ or ‘3:1’ – seemed to be easier (see ). The experiment finished with a short discussion led by the experiment facilitator. Participants gave verbal feedback about the experiment procedure. They mostly reported that the most difficult part of the cartographic experiment was the static pseudo 3D environment. Some participants experienced difficulties with the manipulation (interaction) of the 3D geographical models, while others reported discomfort using the shutter glasses. They perceived irritating flickering or they experienced a slight headache. However, nobody reported more extreme physiological states that might have led to premature interruption of experiments or the failure of specific parts of the experiment.
Table 4. Rating of subjectively experienced difficulty for all conditions in the geographical tasks.
Table 5. Preference of participants (N = 39) for 1:3 and 3:1 task types, respectively.
6. Discussion
This experiment focused on user performance with different types of 3D visualizations within VEs with different levels of navigational interactivity. The research followed outcomes from recently published articles, e.g. Špriňarová et al. (Citation2015), Herman and Stachoň (Citation2016), and Klippel, Weaver, and Robinson (Citation2011), and was performed using the Hypothesis software and on a custom-built platform based on the Unity® game engine.
The results presented in the previous section provide the following answers to the established research questions.
Our main interest was the level of navigational interactivity. The results showed that even low levels of interface complexity (pan, zoom, rotate) strongly influence the ability of a particular 3D visualization to support good performance on an altitude profile task. The evaluation of correct answers and the response times showed statistically significant differences only between the static and interactive factors, contrary to the conclusions of previously published papers (e.g. Keehner et al. Citation2008). The main implication of Keehner et al.''s study was the finding that more interactivity may not help to solve the tasks more effectively because users need not be able to use it an effective way. The authors also pointed out the individual differences between people and their particular ability to use interactive visualization. However, we have also found several differences between both studies which are worth mentioning. First, the level of navigational interactivity and available tools is different. While Keehner et al. (Citation2008) provided only rotation, we incorporated zoom in and out, move, and both horizontal and vertical rotation in our study. Second, our interface was also positively constrained and did not allow the vertical rotation of more than 90° (to avoid the upside down view on the terrain). This type of ‘hard constraint’ could also allow individual user to easily disclose the appropriate view and accomplish the task effectively. Moreover, the user group consisted of teenagers using digital technology on a day-to-day basis and experienced in 3D gaming and other applications. Taking into account the aforementioned differences, the users were more likely to use the interactivity in a more effective way on a general level. Other interaction primitives (Roth Citation2012) used for exploratory geovisualization, such as layer switching, transparency setting, brushing, or displaying detail-on-demand can be also used in the interactive 3D environment of spatial data (Herman and Řezník Citation2015; Sieber et al. Citation2016).
In addition to the influence of navigational interactivity, we focused on the influences of spatial abilities on user performance within the 3D environment. The results from the MRT showed a low but insignificant correlation only in the case of male participants. In case of female participants, no correlation was found. It might indicate that men and women use different cognitive strategies when solving spatially oriented tasks within 3D environments. This interpretation is consistent with the theory of spatial and object imagery, where Blazhenkova and Kozhevnikov (Citation2009) mention that males are relatively more frequent ‘spatial imagers’ and vice-versa, such that females could be described relatively more frequently as ‘object imagers’. The MRT is an indicator of the level of ‘spatial imagery’.
Another issue was devoted to the differences between the two task types. We expected the 1:3 tasks and the 3:1 tasks (compare and ) to produce different levels of cognitive load. We assumed that the 3:1 task would require higher cognitive load because of the necessity to mentally create three different 3D lines on the terrain and compare them with the suggested altitude profiles. Therefore, we hypothesized that we would observe longer response times in the case of 3:1 tasks. The results showed that there were no significant differences in the response time and correctness between the task types.
Finally, an influence of the type of 3D visualization (pseudo (monoscopic)/real (stereoscopic)) on the performance of users was observed. The differences in the use of real 3D visualizations show slightly better, but not significantly different, results as measured by rate of correct answers. Therefore, the influence of the type of 3D visualization is still unclear, with neither method clearly performing better. This finding is consistent with those of Ware and Franck (Citation1996), Zanola, Fabrikant, and Cöltekin (Citation2009), Torres et al. (Citation2013), or Špriňarová et al. (Citation2015).
The comparison of objective results with subjective user preferences was also interesting. The pseudo 3D (monoscopic) static task had the worst subjective evaluation. However, the differences between real and pseudo 3D tasks were insignificant based on objective results. On the other hand, the real 3D static and pseudo 3D interactive environments obtained similar subjective evaluations (2.13 and 2.08 on the Likert scale, ), but the objective results demonstrated considerable differences in users’ performance (). This could indicate that users have a tendency to overestimate the importance of control method compared with visualization type, which can be explained by cognitive biases, e.g. illusion of control (Thompson Citation1999). Such an effect of incongruence between subjective rating and objective performance stresses the importance of conducting objective empirical user studies.
7. Conclusion
Based on the results interpreted in the discussion, we can conclude that the major influence on correct answers was navigational interactivity, which provides additional depth cues. However, the decisions performed in the static environments were made faster than those made in the interactive environment.
We did not observe any significant positive effect of real 3D (stereoscopic) in either the static or the interactive environment. Contrary to this finding, Juřík et al. (Citation2017) provide evidence of a positive influence of real 3D visualization on relative point altitude evaluation. Both experiments used almost identical environments and spatial data, but the tasks were different. Based on our results, it appears that for certain types of tasks (as in our case, working with terrain profiles), it is better to use an interactive visualization, no matter whether it is real 3D or pseudo 3D. The advantage of pseudo 3D visualization in this case is that it is literally cheaper because it does not require specific hardware. An interactive pseudo 3D visualization can be produced simply by developing appropriate software. It can be easily modified and currently includes a broad spectrum of technologies, ranging from web-based applications to those available on the desktop. Summarizing our findings from the 3D visualization design viewpoint, we can recommend the researchers concentrate on the (navigational) interactivity instead of stereoscopic visualization. Our conclusions are in line with the current report of Roth et al. (Citation2017) mentioning the necessity to investigate the strategies to compare static and interactive maps and also to evaluate the interactivity in map use cases.
The individual differences among users mentioned by Keehner et al. (Citation2008) are one of the open issues to be solved. We were not able to log out the view at our interaction data when the participants found the ‘best’ angle to see what was needed for the actual judgement. However, we are currently working on tools which enable us to timestamp and measure types of interaction (zoom, move, rotate) (see, e.g. Herman and Stachoň Citation2016; Herman et al. Citation2016). This tool will also enable us to reconstruct the view used for the final judgement and describe the users’ performance and strategies on the inter-individual level.
Our conclusions are limited to the particular tasks tested in this experiment – a strong influence of task dependency – and are also limited by the relatively specific group of participants tested in this experiment, which consisted of high-school students with limited map-reading expertise. These ‘digital natives’ have frequent experience with 3D visualizations, at least with pseudo 3D ones. So, it is possible that they had previously learned how to work effectively with 3D applications. We are planning to focus on different user groups and to extend the complexity of tasks solved by the participants in future work. We want to perform further experiments with these factors modified using another two vertices of the previously described triarchic model.
Supplementary_Material.mp4
Download MP4 Video (41.5 MB)Acknowledgements
We would like to thank our test participants for their valuable time and two anonymous reviewers for their helpful and constructive comments.
Disclosure statement
No potential conflict of interest was reported by the authors.
Additional information
Funding
Notes
1 The Unity game engine has recently been frequently used for the development of serious games and other research applications, in addition to commercial games. For more details, see: https://unity3d.com/.
Related Research Data
References
- Allen, G. L., C. R. M. Cowan, and H. Power. 2006. “Acquiring Information from Simple Weather Maps: Influences of Domain-specific Knowledge and General Visual–spatial Abilities.” Learning and Individual Differences 16 (4): 337–349. doi:10.1016/j.lindif.2007.01.003.
- Blazhenkova, O., and M. Kozhevnikov. 2009. “The New Object-spatial-verbal Cognitive Style Model: Theory and Measurement.” Applied Cognitive Psychology 23 (5): 638–663. doi:10.1002/acp.1473.
- Bleisch, S., and J. Dykes. 2015. “Quantitative Data Graphics in 3D Desktop-based Virtual Environments – An Evaluation.” International Journal of Digital Earth 8 (8): 623–639. doi:10.1080/17538947.2014.927536.
- Bleisch, S., J. Dykes, and S. Nebiker. 2008. “Evaluating the Effectiveness of Representing Numeric Information Through Abstract Graphics in 3D Desktop Virtual Environments.” The Cartographic Journal 45 (3): 216–226. doi:10.1179/000870408X311404.
- Bowman, D. A., E. Kruijff, J. J. LaViola, and I. Poupyrev. 2005. 3D User Interfaces: Theory and Practice. 1st ed. Redwood City, CA: Addison Wesley Longman.
- Buchroithner, M. F., and C. Knust. 2013. True-3D in Cartography – Current Hard and Softcopy Developments. In Geospatial Visualisation, edited by A. Moore and I. Drecki, 41–65. Heidelberg: Springer. doi:10.1007/978-3-642-12289-7_3.
- Campos, A. 2012. “Measure of the Ability to Rotate Mental Images.” Psicothema 24 (3): 431–434.
- Craglia, M., K. de Bie, D. Jackson, M. Pesaresi, G. Remetey-Fülöpp, C. Wang, A. Annoni, et al. 2012. “Digital Earth 2020: Towards the Vision for the Next Decade.” International Journal of Digital Earth 5 (1): 4–21. doi:10.1080/17538947.2011.638500.
- Daneman, M., and P. A. Carpenter. 1980. “Individual Differences in Working Memory and Reading.” Journal of Verbal Learning and Verbal Behavior 19 (4): 450–466. doi:10.1016/S0022-5371(80)90312-6.
- Ekstrom, R. B., J. W. French, H. H. Harman, and D. Dermen. 1976. Manual for Kit of Factor-referenced Cognitive Tests. 1st ed. Princeton, NJ: Educational Testing Service.
- Ganis, G., and R. Kievit. 2015. “A New Set of Three-dimensional Shapes for Investigating Mental Rotation Processes: Validation Data and Stimulus Set.” Journal of Open Psychology Data 3 (1): e3. doi:10.5334/jopd.ai.
- Gore, A. 1998. “ The Digital Earth: Understanding Our Planet in the 21st Century.” Accessed January 4, 2017. http://www.isde5.org/al_gore_speech.htm.
- Griffin, A. L., A. M. MacEachren, F. Hardisty, E. Steiner, and B. Li. 2006. “A Comparison of Animated Maps with Static Small-multiple Maps for Visually Identifying Space-time Clusters.” Annals of the Association of American Geographers 96 (4): 740–753. doi:10.1111/j.1467-8306.2006.00514.x.
- Haeberling, C., H. Bär, and L. Hurni. 2008. “Proposed Cartographic Design Principles for 3D Maps: A Contribution to an Extended Cartographic Theory.” Cartographica 43 (3): 175–188. doi:10.3138/carto.43.3.175.
- Hájek, P., K. Jedlička, and V. Čada. 2016. “Principles of Cartographic Design for 3D Maps – Focused on Urban Areas.” In Proceedings, 6th International Conference on Cartography and GIS (Vols. 1 and 2), edited by T. Bandrova and M. Konečný, 297–307. Sofia, Bulgaria: Bulgarian Cartographic Association.
- Herbert, G., and X. Chen. 2015. “A Comparison of Usefulness of 2D and 3D Representations of Urban Planning.” Cartography and Geographic Information Science 42 (1): 22–32. doi:10.1080/15230406.2014.987694.
- Herman, L., and T. Řezník. 2015. “3D Web Visualization of Environmental Information – Integration of Heterogeneous Data Sources When Providing Navigation and Interaction.” In ISPRS Archives of the Photogrammetry, Remote Sensing and Spatial Information Sciences (Vol. XL-3/W3), edited by C. Mallet, et al., 479–485. La Grande Motte: ISPRS. doi:10.5194/isprsarchives-XL-3-W3-479-2015.
- Herman, L., and Z. Stachoň. 2016. “Comparison of User Performance with Interactive and Static 3D Visualization – Pilot Study.” In ISPRS Archives of the Photogrammetry, Remote Sensing and Spatial Information Sciences (Vol. XLI-B2), edited by L. Halounová, et al., 655–661. Prague: ISPRS. doi: 10.5194/isprs-archives-XLI-B2-655-2016
- Herman, L., Z. Stachoň, R. Stuchlík, J. Hladík, and P. Kubíček. 2016. “Touch Interaction with 3D Geographical Visualization on Web: Selected Technological and User Issues.” In ISPRS Archives of the Photogrammetry, Remote Sensing and Spatial Information Sciences (Vol. XLII-2/W2), edited by E. Dimopoulou and P. van Oosterom, 33–40. Athens: ISPRS. doi:10.5194/isprs-archives-XLII-2-W2-33-2016.
- Hirmas, D. R., T. Slocum, A. F. Halfen, T. White, E. Zautner, P. Atchley, H. Liu, W. C. Johnson, S. Egbert, and D. McDermott. 2014. “Effects of Seating Location and Stereoscopic Display on Learning Outcomes in an Introductory Physical Geography Class.” Journal of Geoscience Education 62 (1): 126–137. doi:10.5408/12-362.1.
- Höffler, T. N. 2010. “Spatial Ability: Its Influence on Learning with Visualizations – A Meta-analytic Review.” Educational Psychology Review 22 (3): 245–269. doi:10.1007/s10648-010-9126-7.
- Hunter, J., C. Brooking, L. Reading, and S. Vink. 2016. “A Web-based System Enabling the Integration, Analysis, and 3D sub-Surface Visualization of Groundwater Monitoring Data and Geological Models.” International Journal of Digital Earth 9 (2): 197–214. doi:10.1080/17538947.2014.1002866.
- Hutchins, E. 1995. “How a Cockpit Remembers Its Speed.” Cognitive Science 19: 265–288. doi: 10.1207/s15516709cog1903_1
- Juřík, V., L. Herman, Č Šašinka, Z. Stachoň, and J. Chmelík. 2017. “When the Display Matters: A Multifaceted Perspective on 3D Geovisualizations.” Open Geosciences 9 (1): 89–100. doi:10.1515/geo-2017-0007.
- Keehner, M., M. Hegarty, C. Cohen, P. Khooshabeh, and D. Montello. 2008. “Spatial Reasoning With External Visualizations: What Matters Is What You See, Not Whether You Interact.” Cognitive Science: A Multidisciplinary Journal 32 (7): 1099–1132. doi:10.1080/03640210801898177.
- Klippel, A., C. Weaver, and A. C. Robinson. 2011. “Analyzing Cognitive Conceptualizations Using Interactive Visual Environments.” Cartography and Geographic Information Science 38 (1): 52–68. doi:10.1559/1523040638152.
- Konečný, M. 2011. “Cartography: Challenges and Potentials in Virtual Geographic Environments Era.” Annals of GIS 17 (3): 135–146. doi:10.1080/19475683.2011.602027.
- Kozhevnikov, M. 2007. “Cognitive Styles in the Context of Modern Psychology: Toward an Integrated Framework of Cognitive Style.” Psychological Bulletin 133 (3): 464–481. doi:10.1037/0033-2909.133.3.464.
- Kubíček, P., Č Šašinka, Z. Stachoň, Z. Štěrba, J. Apeltauer, and T. Urbánek. 2017. “Cartographic Design and Usability of Visual Variables for Linear Features.” The Cartographic Journal 54 (1): 91–102. doi:10.1080/00087041.2016.1168141.
- Landy, M., L. Maloney, E. Johnston, and M. Young. 1995. “Measurement and Modeling of Depth Cue Combination: in Defense of Weak Fusion.” Vision Research 35 (3): 389–412. doi: 10.1016/0042-6989(94)00176-M
- Larkin, J., and H. Simon. 1987. “Why a Diagram Is (Sometimes) Worth Ten Thousand Words.” Cognitive Science 11 (1): 65–100. doi: 10.1111/j.1551-6708.1987.tb00863.x
- Lin, H., M. Batty, S. Jørgensen, B. Fu, M. Konečný, A. Voinov, P. Torrens, et al. 2015. “Virtual Environments Begin to Embrace Process-based Geographic Analysis.” Transactions in GIS 19 (4): 493–498. doi:10.1111/tgis.12167.
- Lokka, I.-E., and A. Cöltekin. 2016. “Simulating Navigation with Virtual 3D Geovisualizations – A Focus on Memory Related Factors.” In ISPRS Archives of the Photogrammetry, Remote Sensing and Spatial Information Sciences (Vol. XLI-B2), edited by L. Halounová, et al., 671–673. Prague: ISPRS. doi:10.5194/isprs-archives-XLI-B2-671-2016.
- Lokka, I.-E., and A. Cöltekin. 2017. “Toward Optimizing the Design of Virtual Environments for Route Learning: Empirically Assessing the Effects of Changing Levels of Realism on Memory.” International Journal of Digital Earth 56: 1–19. doi:10.1080/17538947.2017.1349842.
- Loomis, J. M., and D. W. Eby. 1988. “Perceiving Structure from Motion: Failure of Shape Constancy.” In Proceedings of Second International Conference on Computer Vision, 383–391. Los Alamitos. doi:10.1109/CCV.1988.590015.
- MacEachren, A. M. 1995. How Maps Work: Representation, Visualization, and Design. 1st ed. New York: Guilford Press.
- Pegg, D. 2011. “Design Issues with 3D Maps and the Need for 3D Cartographic Design Principles.” In Workshop ‘Maps for the Future: Children, Education and the Internet’. Accessed January 3, 2017. http://lazarus.elte.hu/cet/academic/pegg.pdf.
- Popelka, S., and P. Dědková. 2014. “Extinct Village 3D Visualization and Its Evaluation with Eye-movement Recording.” In Computational Science and Its Applications – ICCSA 2014, edited by B. Murgante, et al., 786–795. Switzerland: Springer International. doi:10.1007/978-3-319-09144-0_54.
- Popelka, S., Z. Stachoň, Č Šašinka, and J. Doleželová. 2016. “EyeTribe Tracker Data Accuracy Evaluation and Its Interconnection with Hypothesis Software for Cartographic Purposes.” Computational Intelligence and Neuroscience 2016 (2016): 1–14. doi:10.1155/2016/9172506.
- Qian, N. 1997. “Binocular Disparity and the Perception of Depth.” Neuron 18 (3): 359–368. doi: 10.1016/S0896-6273(00)81238-6
- Rautenbach, V., S. Coetzee, and A. Cöltekin. 2017. “Development and Evaluation of a Specialized Task Taxonomy for Spatial Planning: A map Literacy Experiment with Topographic Maps.” ISPRS Journal of Photogrammetry and Remote Sensing 127: 16–26. doi:10.1016/j.isprsjprs.2016.06.013.
- Řezník, T., B. Horáková, and R. Szturc. 2013. “Geographic Information for Command and Control Systems: Demonstration of Emergency Support.” In Intelligent Systems for Crisis Management: Geo-information for Disaster Management, edited by S. Zlatanova, et al., 263–275. Heidelberg: Springer. doi:10.1007/978-3-642-33218-0_18.
- Roth, R. E. 2012. “Cartographic Interaction Primitives: Framework and Synthesis.” The Cartographic Journal 49 (4): 376–395. doi:10.1179/1743277412Y.0000000019.
- Roth, R. E., A. Çöltekin, L. Delazari, H. F. Filho, A. Griffin, A. Hall, J. Korpi, et al. 2017. “User Studies in Cartography: Opportunities for Empirical Research on Interactive Maps and Visualizations.” International Journal of Cartography 1: 1–29. doi:10.1080/23729333.2017.1288534.
- Šašinka, Č. 2012. “Interindividuální rozdíly v percepci prostoru a map [Interindividual Differences in Perception of Space and Maps].” PhD Thesis, Masaryk University, Brno.
- Seipel, S. 2013. “Evaluating 2D and 3D Geovisualisations for Basic Spatial Assessment.” Behaviour & Information Technology 32 (8): 845–858. doi:10.1080/0144929X.2012.661555.
- Semmo, A., M. Trapp, M. Jobst, and J. Döllner. 2015. “Cartography-oriented Design of 3D Geospatial Information Visualization – Overview and Techniques.” The Cartographic Journal 52 (2): 95–106. doi:10.1080/00087041.2015.1119462.
- Sieber, R., M. Serebryakova, R. Schnürer, and L. Hurni. 2016. “Atlas of Switzerland Goes Online and 3D – Concept, Architecture and Visualization Methods.” In Progress in Cartography. Lecture Notes in Geoinformation and Cartography, edited by G. Gartner, M. Jobst, and H. Huang, 171–184. Switzerland: Springer International. doi:10.1007/978-3-319-19602-2_11.
- Špriňarová, K., V. Juřík, Č. Šašinka, L. Herman, Z. Štěrba, Z. Stachoň, J. Chmelík, and B. Kozlíková. 2015. “Human–computer Interaction in Real 3D and Pseudo-3D Cartographic Visualization: A Comparative Study.” In Cartography – Maps Connecting the World, edited by C. R. Sluter, C. B. M. Cruz, and P. M. L. de Menezes, 59–73. Switzerland: Springer International. doi:10.1007/978-3-319-17738-0_5.
- Stachoň, Z., Č. Šašinka, Z. Štěrba, J. Zbořil, Š. Březinová, and J. Švancara. 2013. “Influence of Graphic Design of Cartographic Symbols on Perception Structure.” Kartographische Nachrichten 63 (4): 216–220.
- Štěrba, Z., Č. Šašinka, Z. Stachoň, R. Štampach, and K. Morong. 2015. Selected Issues of Experimental Testing in Cartography. 1st ed. Brno, Czech Republic: Masaryk University. doi:10.5817/CZ.MUNI.M210-7893-2015.
- Svatoňová, H. 2016. “Analysis of Visual Interpretation of Satellite Data.” In ISPRS Archives of the Photogrammetry, Remote Sensing and Spatial Information Sciences (Vol. XLI-B2), edited by L. Halounová, et al., 675–681. Prague: ISPRS. doi:10.5194/isprsarchives-XLI-B2-675-2016.
- Tartre, L. A. 1990. “Spatial Orientation Skill and Mathematical Problem Solving.” Journal for Research in Mathematics Education 21 (3): 216–229. doi:10.2307/749375.
- Thompson, S. C. 1999. “Illusions of Control: How We Overestimate Our Personal Influence.” Current Directions in Psychological Science 8 (6): 187–190. http://www.jstor.org/stable/20182602. doi: 10.1111/1467-8721.00044
- Torres, J., M. Ten, J. Zarzoso, L. Salom, R. Gaitán, and J. Lluch. 2013. “Comparative Study of Stereoscopic Techniques Applied to a Virtual Globe.” The Cartographic Journal 50 (4): 369–375. doi:10.1179/1743277413Y.0000000034.
- Vandenberg, S. G., and A. R. Kuse. 1978. “Mental Rotations, a Group Test of Three-dimensional Spatial Visualization.” Perceptual and Motor Skills 47 (2): 599–604. doi: 10.2466/pms.1978.47.2.599
- Vidláková, I. 2010. “Object – Spatial Imagery Questionnaire (OSIQ).” Annales Psychologici, Masaryk University, Brno. Accessed December 29, 2016. http://hdl.handle.net/11222.digilib/114425.
- Ware, C., and G. Franck. 1996. “Evaluating Stereo and Motion Cues for Visualizing Information Nets in Three Dimensions.” ACM Transactions on Graphics 15 (2): 121–140. doi:10.1145/234972.234975.
- Wilkening, J., and S. I. Fabrikant. 2013. “How Users Interact with a 3D Geo-browser Under Time Pressure.” Cartography and Geographic Information Science 40 (1): 40–52. doi:10.1080/15230406.2013.762140.
- Willett, W., B. Jenny, T. Isenberg, and P. Dragicevic. 2015. “Lightweight Relief Shearing for Enhanced Terrain Perception on Interactive Maps.” In Proceedings of the 33rd ACM Conference on Human Factors in Computing Systems (CHI 2015), 3563–3357. Seoul. doi:10.1145/2702123.2702172.
- Zanola, S., S. I. Fabrikant, and A. Cöltekin. 2009. “The Effect of Realism on the Confidence in Spatial Data Quality in Stereoscopic 3D Displays.” In Proceedings, 24th International Cartography Conference (ICC 2009), Santiago. Accessed January 3, 2017. http://www.geo.uzh.ch/~sara/pubs/zanola_fabrikant_coeltekin_icc09.pdf.