
 ?Mathematical formulae have been encoded as MathML and are displayed in this HTML version using MathJax in order to improve their display. Uncheck the box to turn MathJax off. This feature requires Javascript. Click on a formula to zoom.
ABSTRACT
China has experienced rapid and massive urban expansion in recent decades. To address the opportunities and challenges posed by urbanization, it is important to investigate this process. Although many studies have characterized China’s urbanization, mainly based on individual cities or urban agglomerations, few studies have compared the urban expansion patterns among cities of different regions and sizes at a national scale. Additionally, the source of the newly developed urban land has largely been ignored in previous research. To fill these gaps, we provide a comprehensive view of the growth patterns of 291 Chinese cities during 1990–2015, quantifying the rates, spatial forms, and corresponding landscape characteristics of the urban expansion. More importantly, we further investigate what their new urban land is converted from. Key findings include: (1) the annual expansion (AE) and annual growth rate (AGR) of all 291 cities were 1869.81 km2 and 4.81% during 1990–2015; (2) cropland and rural settlements were the predominant source, accounting for 65.22% and 17.49% of the new urban land during 1990–2015; (3) edge-expansion was the dominant growth form for most cities, followed by infilling and leapfrogging growth; and (4) the landscape characteristics of the occupied cropland differed across various cities.
1. Introduction
The world is experiencing urbanization at an unprecedented rate. The urban population of the world accounted for about 33% in 1950, but the fraction of the population living in cities had increased to 54% by 2014, and the figure is projected to reach 66% by 2050 (United Nations Citation2015). Currently, global urban land is expanding at twice the rate of population growth, and is expected to exceed 1.1 million km2 by 2050 (Angel et al. Citation2011). Urbanization, characterized by a demographic shift from rural to urban areas and physical land conversion, poses both opportunities and challenges for global development in the twenty-first century (Bai, Chen, and Shi Citation2011). The notion that cities can facilitate optimized delivery of social services, such as education, health care, and efficient governance, is widely accepted (Bettencourt et al. Citation2007). However, the continuous population migration from rural to urban areas raises challenges of both urban management and public safety (Kuang et al. Citation2014). The conversion of natural land into impervious surfaces has a profound impact on the carbon cycle (Normile Citation2008), the hydrological process (McDonald et al. Citation2011), and the surface energy balance of the land ecosystem (Kuang et al. Citation2015). Meanwhile, the accompanying environmental problems, such as the greenhouse effect (Zeng et al. Citation2017), air and water pollution (Chan and Yao Citation2008; Chi et al. Citation2016), the loss of natural habits and biodiversity (He et al. Citation2014), and the urban heat island effect (Kuang et al. Citation2015), are threatening our future development.
The developing countries are expected to be the urbanization hotspots in the following decades (United Nations Citation2015). As the world’s most populous developing country, China has undergone a marked urbanization process since the implementation of the reform and opening-up policy in 1978. The fraction of China’s urban population increased from 17.92% in 1978 to 56.10% in 2015 and its built-up area even expanded by nearly six-fold between 1981 and 2015, from 7.44 × 10³ to 5.21 × 10⁴ km2 (National Bureau of Statistics of China Citation[1978] 2016). The year 2011 was a milestone in the urbanization process of China as the urban population exceeded the rural population for the first time in history. After industrialization, urbanization has become a new engine to promote economic and social development (Ru, Lu, and Li Citation2012). Therefore, the urban expansion patterns after 2011 need to be further revealed to help the Chinese government to develop supporting policies in this new stage of development.
The rapid and massive urban expansion of China has aroused widespread concern. Many studies have investigated this process, mainly at the individual city level (e.g. Beijing (Li, Zhou, and Ouyang Citation2013), Shanghai (Zhang et al. Citation2011), Guangzhou (Kuang et al. Citation2014), and Shenzhen (Sui and Zeng Citation2001)) or the urban agglomeration level (e.g. the Yangtze River Delta (Li, Li, and Wu Citation2013), the Pearl River Delta (Li and Yeh Citation2004), and Jing-Jin-Ji (Gao et al. Citation2017; Hass and Ban Citation2014)). Nonetheless, experts have called for a more thorough consideration of China’s urbanization at the national scale, as such studies are important for the urban development of the whole country (Gu, Wu, and Cook Citation2012; Wu, Xiang, and Zhao Citation2014). However, there are still three research gaps with the national-scale studies. First, most such studies have used the entire country, regions, or provinces as the analysis unit (Kuang et al. Citation2016; Liu, Zhang, and Hu Citation2012; Xu et al. Citation2016), but the growth patterns of the cities, which are regarded as engines of economic growth and centers of culture and innovation, have not been well understood (Wu, Xiang, and Zhao Citation2014). Although Lin et al. (Citation2015) analyzed land urbanization and its driving forces in 658 Chinese cities from 2000 to 2010 with statistical data, they did not consider the spatial forms of urban growth. Wang et al. (Citation2012) investigated the urban expansion of 663 Chinese cities from 1990 to 2010, considering only the core area for each city, but the peri-urban areas and small-sized towns were omitted in their analysis. Second, limited by the relatively low urbanization level and development, the central, western, and northeastern cities have attracted much less concern than the eastern cities (Kuang et al. Citation2016; Qu, Zhao, and Sun Citation2014; Sun, Zhao, and Qu Citation2015). Furthermore, the small- and medium-sized cities have been neglected in most of the previous studies, despite the fact that they account for nearly 80% of Chinese cities (Gao et al. Citation2016). To date, few studies have focused on the comparison among cities of different regions and sizes (Kuang et al. Citation2016; Xu and Min Citation2013). Third, in the current literature, the spatiotemporal dynamics of urban expansion is always the research focus. However, few studies have tracked the source of newly developed urban land for Chinese cities over a long period of time and compared their land-use patterns. For instance, the question of how much cropland was expropriated due to urban expansion has not yet been fully solved for most Chinese cities, in spite of its great importance to food security for a country with limited arable land and an enormous population. To fill these gaps, we grouped 291 Chinese cities according to their sizes and geographical locations, and compared the urban expansion patterns of the various cities for different time periods from 1990 to 2015.
To the best of our knowledge, this study provides the first comprehensive analysis comparing the urban expansion patterns of 291 Chinese cities during 1990–2015. The major elements of this study were to: (1) quantify the spatiotemporal dynamics of urban expansion; (2) track the source of newly developed urban land; (3) investigate the urban growth forms; and (4) characterize the landscape patterns of the occupied cropland due to urban expansion. More importantly, we have compared the four points among cities of different regions and sizes.
2. Materials and methods
2.1. Study area
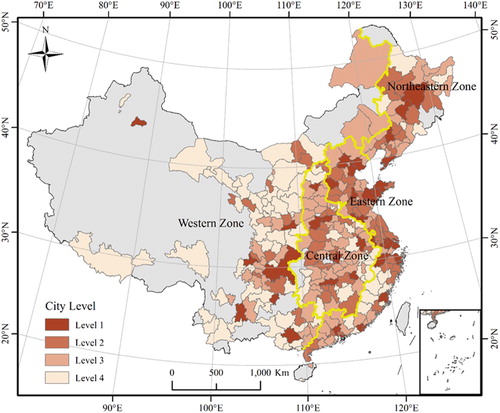
In this study, 291 Chinese cities (i.e. four municipalities directly under the administration of central government, 15 vice-provincial cities, and 272 prefecture-level cities) were selected as samples, and their boundaries were defined according to China’s official definition of administrative areas (Chan Citation2007). To compare the growth patterns across a range of city sizes, we used the urban population in 2014 to stratify the cities into four levels (Supplementary Table 1) (Bai, Shi, and Liu Citation2014; National Bureau of Statistics of China Citation2014). For the urbanization spatial analysis, we adopted China’s economic-geographical zoning scheme to divide the entire country into four zones (): (1) the eastern zone; (2) the central zone; (3) the western zone; and (4) the northeastern zone (Huang, Wei, et al. Citation2015; Xu and Min Citation2013).
Figure 1. Spatial distribution of the selected cities. The entire country is divided into four zones: (1) the eastern zone (including Shanghai, Beijing, Tianjin, Macau, Hong Kong, Shandong, Guangdong, Jiangsu, Hebei, Zhejiang, Hainan, Fujian, and Taiwan); (2) the central zone (including Anhui, Shanxi, Jiangxi, Henan, Hubei, and Hunan); (3) the western zone (including Chongqing, Yunnan, Sichuan, Guizhou, Shaanxi, Gansu, Qinghai, Inner Mongolia, Ningxia, Guangxi, Xinjiang, and Tibet); and (4) the northeastern zone (including Jilin, Heilongjiang and Liaoning). The yellow dividing lines are based on the provincial boundaries.
2.2. Data
We used six periods of the China Land Use/Cover Dataset (i.e. CLUD 1990, 1995, 2000, 2005, 2010, and 2015) provided by the Institute of Geographical Science and Nature Resources Research (IGSNRR, http://www.igsnrr.ac.cn/) of the Chinese Academy of Sciences (CAS). This dataset was mainly generated from Landsat TM/ETM+ and HJ-1A/1B images with a spatial resolution of 30 m × 30 m, and its classification system includes six primary land-cover categories and 25 subtypes. We reclassified the dataset into eight classes (cropland, woodland, grassland, water bodies, urban land, rural settlements, other construction land, and unused land; Supplementary Figure 13 shows the reclassification result for CLUD 2015). This dataset has been widely used to study the land-use/cover change of China, and accuracy assessment has been addressed in previous studies, except for CLUD 2015 (Liu et al. Citation2003; Liu et al. Citation2010; Liu et al. Citation2014; Liu, Liu, et al. Citation2005; Liu, Tian, et al. Citation2005), indicating average interpretation accuracies of more than 90% for the first five periods. CLUD 2015 was updated from the previous datasets by a human–computer interactive method, and its accuracy assessment is currently being conducted by the IGSNRR.
2.3. Study methods
2.3.1. Urban expansion rate
Two indexes – annual expansion (AE, km2) and annual growth rate (AGR, %) – were selected to quantify the rate of urban expansion. These indexes are defined as follows:(1)
(1)
(2)
(2)
where Astart and Aend are the urban land areas at the start and end points, respectively, and d is the time span from the start to the end point. AE directly measures the annual change of urban land areas, while AGR eliminates the size effect of cities and is used to compare the urban expansion among different cities during the same period (Wu et al. Citation2015).
2.3.2. Urban growth types
The urban growth type was summarized into three forms: infilling, edge-expansion, and leapfrogging (Camagni, Gibelli, and Rigamonti Citation2002). The urban growth types (E) were calculated using the following equation (Xu et al. Citation2007):(3)
(3) where Pnew represents the perimeter of a newly developed urban patch, and Lcom is the length of the common boundary of this newly developed urban patch and the existing urban land. The urban growth type is identified as infilling when E > 0.5, as edge-expansion when 0 < E ≤ 0.5, and as leapfrogging when E = 0.
2.3.3. Landscape analysis
A large number of landscape metrics have been used to measure landscape composition and spatial configuration (Fang, Li, and Wang Citation2016). In this study, six commonly used landscape metrics were selected to characterize the landscape pattern of the occupied land during the urban expansion between 1990 and 2015: number of patches (NP), mean patch size (MPS), largest patch index (LPI), edge density (ED), aggregation index (AI), and perimeter area weighted mean ratio (PARA_AM). The metrics were all calculated using FRAGSTATS at the class level (McGarigal et al. Citation2002). The NP metric is a measure of the discrete area for each individual class, and it increases with the degree of fragmentation (Fang, Li, and Wang Citation2016). MPS represents the relative size of each class and describes the form change (Fang, Li, and Wang Citation2016). LPI measures the proportion of total area occupied by the largest patch of an individual class (Wu et al. Citation2015). The ED measures the total edges of the patches divided by the total area, and a low ED value corresponds to a high level of contiguity (McGarigal et al. Citation2002). AI equals 1 when the class is maximally disaggregated, and equals 100 when it is maximally aggregated into a single compact patch (Tv, Aithal, and Sanna Citation2012). PARA_AM is an effective indicator to characterize the shape complexity of patches for an individual class (McGarigal et al. Citation2002). More details about these metrics are provided in .
Table 1. Selected landscape metrics in this study.
3. Results
3.1. Comparative analysis for the magnitude and rate of urban expansion
3.1.1. Magnitude of urban expansion
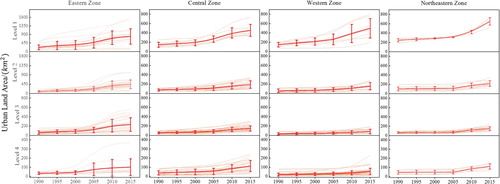
shows the magnitude of urban expansion by city and time period. In general, the larger cities experienced greater expansion. From 1990 to 2015, the urban land increased by an average of 466.16 km2, 210.66 km2, 107.25 km2, and 53.03 km2 for the level 1–4 cities (defined in Supplementary Table 1), respectively. The urban expansion of the eastern zone was more obvious than the other regions, particularly for the eastern level 1 cities. The eastern cities expanded by an average of 306.39 km2 during 1990–2015, which was much more than the central (111.86 km2), western (75.99 km2), and northeastern cities (126.52 km2). The growth variance between the eastern cities was more evident than for the cities of the other zones. The urban expansion map of the 291 cities from 1990 to 2015 is provided in Supplementary Figure 1.
Figure 2. Magnitude of urban expansion for the 291 Chinese cities. The pale brown lines represent the urban land area of each city, and the red lines and bars represent the corresponding average and standard deviation respectively.
3.1.2. Rate of urban expansion
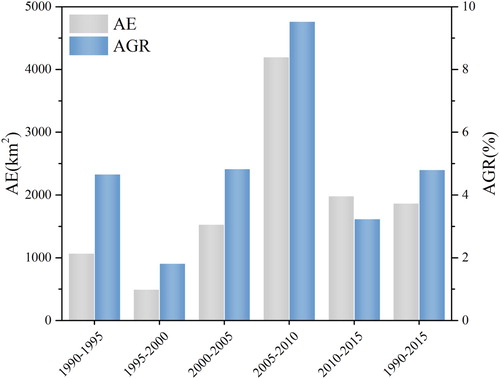
Between 1990 and 2015, China experienced rapid urban expansion. The AE and AGR were 1954.88 km2 and 4.75% at the national level during this period (Supplementary Figure 2). The urban expansion of China was slowest in the period of 1995–2000, where the AE and AGR were 532.72 km2 and 1.85%, respectively. The urban expansion rate then peaked during 2005–2010 with a significantly larger AE (4373.99 km2) and AGR (9.45%). The 291 cities cover most of China, and the expansion trend of all the cities was consistent with the whole country (). The AE and AGR of all 291 cities were 1869.81 km2 and 4.81% during 1990–2015.
Figure 3. Annual expansion (AE) and annual growth rate (AGR) of the urban land of the 291 cities across the five periods, 1990–2015.
The AGR distributions of the cities of different zones and sizes across the five periods are illustrated in , which also depicts the AGR trajectory dynamics of all these cities. In the northeast, the urban expansion remained quite slow before 2005, and it was after the implementation of the Northeast Area Revitalization Plan in 2004 that the growth of the northeastern cities significantly accelerated. The eastern cities grew at a relatively high rate from 1990 to 2010. However, their growth slowed down significantly in the period of 2010–2015. The western cities grew at a slighter higher rate during 1995–2000 and 2010–2015. The urban expansion of central cities was relatively slow from 1990 to 2015, but they experienced a short period of rapid urban expansion during 2005–2010 due to the Rise of Central China Plan.
Figure 4. AGR distributions of the cities. The box plot illustrates the AGR distribution of the cities of different sizes and regions. The black squares represent the mean of AGR, and the longer black lines represent the median of AGR. Red dashed lines represent the average AGR of the cities of a particular size.
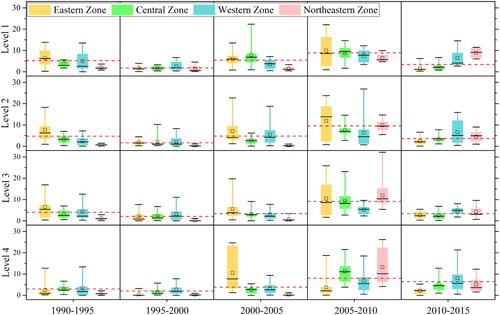
The urban expansion rate also differed across the range of city sizes. From 1990 to 2010, the level 1 cities expanded faster except for the period of 1995–2000, where the average expansion rates were nearly same for the level 1–4 cities. The growth of the level 1 cities tended to slow down after 2005. The level 2 cities experienced a similar expansion with the level 1 cities, but their expansion rate tended to slow down during 2010–2015. The growth rate of the level 3 and 4 cities remained relatively low between 1990 and 2005. Their expansion then accelerated particularly for the level 4 cities during 2010–2015. The level 3 and level 4 cities contributed more to the acceleration of urban expansion in the northeast during 2005–2010, while the rapider urban growth of western cities was due to the level 1 and level 2 cities during 2010–2015.
3.2. Sources of newly developed urban land
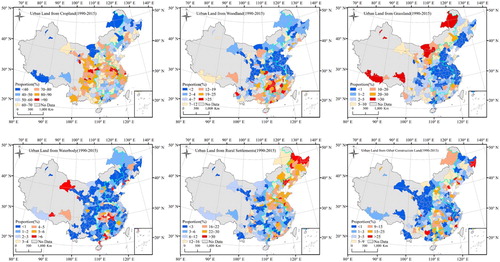
The spatial distribution of the proportion of newly developed urban land converted from other land between 1990 and 2015 is displayed in . The proportion of new urban land from cropland was much higher than 50% in the vast majority of the selected cities, and the high values were mainly distributed between latitudes 30°N and 40°N. For example, the new urban land converted from cropland accounted for over 90% in Shanghai from 1990 to 2015. The fractional distribution of the new urban land converted from woodland, grassland, and rural settlements exhibited remarkable spatial differences. The corresponding proportions of new urban land converted from woodland and grassland were higher in the southern and northwestern cities, and the higher proportion of new urban land converted from rural settlements was concentrated in the northeast, the North China Plain, and the Pearl River Delta. The water bodies contributed less to the urban expansion of most cities, but it is worth noting that there were some relatively high proportions in the middle reaches of the Yangtze River (e.g. Wuhan). The corresponding proportion of new urban land converted from other construction land was generally low in the western zone, and the highest value was found in Anshan (38.28%).
Figure 5. The proportion of new urban land converted from cropland, woodland, grassland, waterbody, rural settlements, and other construction land during the period of 1990–2015.
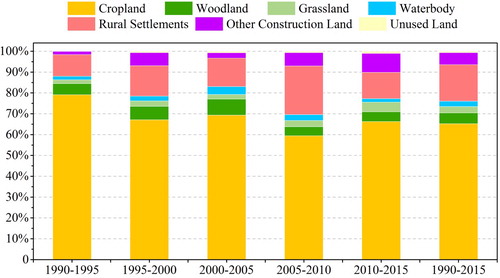
According to the statistical results of all 291 cities (), cropland took a major role in the urban expansion process. The proportion of new urban land converted from cropland was above 50% in all five periods from 1990 to 2015, and the corresponding proportion peaked in the period of 1990–1995 (79.09%). Rural settlements were also an important urban expansion contributor, and over 17% of the newly developed urban land was converted from rural settlements during 1990–2015. The proportion of new urban land converted from other construction land fluctuated. It was only 1.60% in the period of 1990–1995, and was 6.31% during 1995–2000. The value gradually increased from 2000 to 2015 and peaked between 2010 and 2015 (9.09%). The percentage of urban land converted from woodland, grassland, and water bodies was relatively stable but low, at 5.20%, 3.02%, and 2.60%, from 1990 to 2015, respectively. The corresponding proportion of new urban land converted from unused land was vanishingly low, and the following analysis does not include this category.
Figure 6. Land sources of urban expansion. The statistical results of the proportions of newly developed urban land converted from other land (i.e. cropland, woodland, grassland, water bodies, rural settlements, other construction land, and unused land) for the 291 cities during 1990–2015.
From the perspective of the various regions, the differences between the sources of newly developed urban land are quite evident (Supplementary Figure 3). The percentage of new urban land converted from cropland was clearly lower in the northeast compared to the other zones, particularly for the periods of 1995–2000 and 2005–2010. It was only 54.19% during 1990–2015, but the corresponding proportions were 65.47%, 69.46%, and 65.68% in the eastern, central, and western zones, respectively. The proportion of newly developed urban land converted from rural settlements was higher in the northeastern and eastern regions. The analysis shows that 23.99% and 19.94% of the new urban land came from rural settlements in the northeast and east, respectively, from 1990 to 2015, but the corresponding proportions were only 12.57% and 10% in the central and western zones. Grassland was of great significance to the urban expansion of western cities. The proportion of newly developed urban land converted from grassland increased in the western zone from 1990 to 2015, and it reached 14.18% during 2010–2015. The corresponding proportions were only 1.43%, 1.84%, and 2.23% in the eastern zone, central zone, and northeastern zone, respectively, during 1990–2015.
The proportional compositions of the sources of newly developed urban land also varied between cities of different sizes (Supplementary Figure 3). Cropland contributed less to the urban expansion for the smaller cities, and the proportions of new urban land converted from cropland were 64.87%, 67.09%, 64.71% and 62.12% for the level 1–4 cities, respectively, during 1990–2015. Similarly, the corresponding proportion of new urban land converted from rural settlements was also lower for the level 4 cities, especially in the period of 2005–2010, and the value was 17.10%, 19.89%, 17.62%, and 11.39% for the level 1–4 cities, respectively, from 1990 to 2015. However, Woodland and grassland were important land sources of urban growth for the level 4 cities. The fraction of the level 4 cities’ new urban land converted from woodland and grassland was obviously higher than for the other cities, and it reached 16.06% in the period of 1990–2015. The corresponding proportion of other construction land was lower for the level 2 cities than for the other cities. The proportion of new urban land converted from water bodies was quite low, and it was difficult to discern the difference among cities of various sizes.
3.3. Analysis of the urban expansion forms
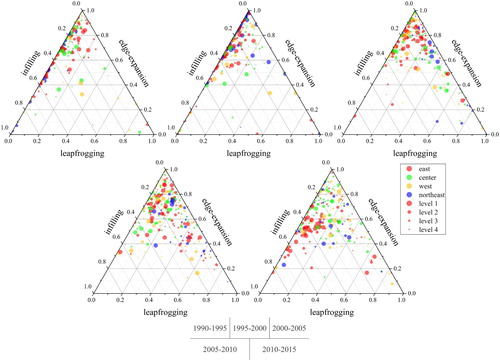
The proportional compositions of the urban expansion forms varied among the different cities, but edge-expansion was the dominant growth type for most cities (). From the perspective of the average of the 291 cities, the proportion of edge-expansion was above 60% during all five periods from 1990 to 2015, and peaked in the period of 1995–2000, with a value of 68.72% (Supplementary Table 2). The fraction of infilling and leapfrogging underwent obvious changes between 1990 and 2015. In the period of 1990–2000, the proportion of infilling was higher than leapfrogging. It then gradually decreased to around 15% during 2000–2010, and later rebounded to 21.66%. In contrast, the proportion of leapfrogging was relatively low in the early period and then experienced a notable jump. The peak value for leapfrogging (18.99%) was in the period of 2005–2010.
Figure 7. The proportional composition of the three urban expansion types (i.e. infilling, edge-expansion, and leapfrogging). This was calculated from the corresponding patch areas across cities and periods.
From the viewpoint of the various regions, the proportional composition differences are also quite obvious (Supplementary Table 3). During 1990–2000, the northeastern cities experienced more compact growth, as the mean fraction of leapfrogging was lower, but infilling was higher than for the other regions. However, this was very different when it came to 2000–2010, when most cities tended to grow as a less compact form, especially the northeastern cities. During 2010–2015, obvious increases of the proportion of infilling were observed in the eastern and northeastern zones, mainly at the cost of a decline in edge-expansion and leapfrogging, respectively. This indicates that the expansion of the eastern and northeastern cities was more compact than the central and western cities during this period.
The urban growth forms are also different across the range of city sizes (Supplementary Table 4). The mean fraction of infilling was always larger than leapfrogging in terms of the level 1 cities, but the gap narrowed between 2000 and 2010. It was same the case for level 2–3 cities during 1990–2000. However, the average proportion of leapfrogging was larger than infilling for the level 2 and level 3 cities in the period of 2000–2010. The larger cities tended to be more compact during 2010–2015, due to the correspondingly smaller proportion of edge-expansion and the larger proportion of infilling.
3.4. Landscape analysis of the occupied cropland due to urban expansion
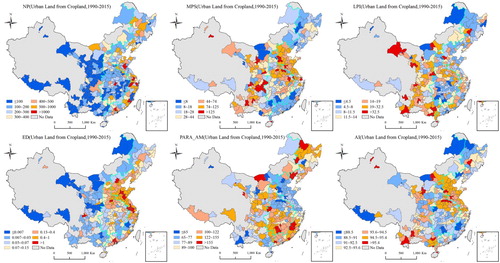
During the period of 1990–2015, a great deal of cultivated land was swallowed up in the dramatic urban expansion process. The landscape forms of the occupied farmland exhibited significant spatial differences (). The NP was larger in the eastern zone and northeastern zone, and the larger NP generally mirrors a fragmentary landscape for the occupied cropland. From the perspective of the MPS, the smaller values, which indicate fragmentary occupied cropland, were found in the southeast coastal areas and the northeast, identified by the correspondingly larger NP. The LPI value was clearly higher in the western zone. This indicates that occupied farmland tended to gather together forming larger patches in the western cities, and the smaller NP and larger MPS also support this. The larger ED in the Jing-Jin-Ji area, the Yangtze River Delta, the Pearl River Delta, Shanxi, Shandong, and Henan provinces denotes a low value of contiguity compared to the other regions. The perimeter area weighted mean ratio (PARA_AM) reflects the patch shape complexity, and small values denote simple shapes, which can be mainly found in the Jing-Jin-Ji area, Shandong, Jiangsu, and Henan provinces. Meanwhile, these regions correspond to the larger AI values. Some larger AI values were also found in the western cities, which means that the occupied farmland of these cities was more aggregated.
Figure 8. Landscape analysis for the cropland encroached by urban expansion during 1990–2015.
The landscape characteristics of the occupied cropland are also different across the range of city sizes (Supplementary Table 7). The NP was larger for the larger cities, and it indicated the occupied cropland was more fragmentary from the perspective of the NP. The patches of occupied cropland in the larger cities tended to aggregate into larger ones and exhibit a low value of contiguity, as the AI, LPI, MPS and ED were all larger in such cities. However, the PARA_AM of smaller cities was greater compared to the larger cities and it reflected that the patch shape of the occupied cropland was more complicated in the smaller cities.
The landscape forms of the occupied woodland, grassland, water bodies, rural settlements, and other construction land are illustrated in Supplementary Figures 4–8 and descripted in Supplementary Text.
4. Discussion
Urban expansion is a double-edged sword, and poses both opportunities and challenges for social development (Wang et al. Citation2012). China has made remarkable achievements in its urbanization since the implementation of the reform and opening-up policy in 1978, and studies of this progress have been the subject of great interest (Kuang et al. Citation2016). In this paper, we have painted a complete picture of the urban expansion of 291 Chinese cities from 1990 to 2015, including tracking their sources of newly developed urban land, which is an aspect that has been neglected in the current literature. It is of great importance for urban planning to figure out what the new urban land was converted from, as the land-use pattern is closely related to the sustainable development of the subsequent urban growth (Gu, Wu, and Cook Citation2012). We also simultaneously compared the urban expansion among cities of different regions and sizes, to discern the diversity of their growth pattern, which has great implications for promoting coordinated development (Kuang et al. Citation2016; Xu and Min Citation2013).
Our results indicated that China experienced more prominent urban expansion in the early period of the twenty-first century compared to the 1990s, and the urban expansion rate peaked during 2005–2010 (), which is essentially in agreement with previous research (Liu, Zhang, and Hu Citation2012; Schneider and Mertes Citation2014). We found that the growth of the eastern cities was slower than the other areas in the period of 2010–2015 (), as these cities experienced massive urban expansion from 1990 to 2010, and the land resources suitable for developing new urban land were gradually reduced (Gao et al. Citation2016; Xu et al. Citation2016). The growth of the northeastern cities was quite slow in the period of 1990–2005 (), and the contemporaneous economic development of the northeast may explain this (Supplementary Figure 9). However, the growth of the cities in the northeast significantly accelerated after the Northeast Area Revitalization Plan was implemented in 2004 (). Previous research has pointed out that urban expansion has been closely correlated with economic development and national policies in China (summarized in Supplementary Table 6) (Huang, Wei, et al. Citation2015; Li and Fang Citation2014). We also found that the growth of the central cities was similar to the western cities during 1990–2005, which is consistent with their economic development (Supplementary Figure 9). The relationship among growth rate and city sizes sometimes follows a power lower, and the relatively rapid growth of the larger-sized cities in the early stage was due to the large number of development opportunities provided by central government and the attraction of capital investment (Wei, Li, and Yue Citation2017; Zhao et al. “Spatial and Temporal Dimensions,” Citation2015). Between 2010 and 2015, it is worth noting the accelerating growth of the small- and medium-sized cities and distribution of urban areas became more even (Huang, He, et al. Citation2015). In 2014, the National New-Type Urbanization Plan (2014–2020) was issued, which emphasized the development of the small- and medium-sized cities. The support of national policies and the gradual saturation of land resources in the metropolitan areas contributed to the faster growth of such cities in this period.
Large swathes of farmland have been occupied during China’s urban expansion process, and the proportion of newly developed urban land converted from cropland was over 60% between 1990 and 2015 (). The unceasing encroachment on arable land has caused stress to China’s food security (He et al. Citation2017). Grain production is of great concern to China due to its limited arable land and the enormous population, and the unprecedented population growth has increased demand for food (Wei et al. Citation2015). The population of China grew by over 20% between 1990 and 2015, but grain production was unstable in the early period of the twenty-first century (Supplementary Figure 10). Moreover, imported grain increased from 7.05 million tons in 1990 to over 100 million tons in 2014, and the trend seems set to continue (Supplementary Figure 10). The growth of China’s grain production has been too dependent on the input of production factors (such as water resources, fertilizers, and pesticides), and it has resulted in significant environmental and economic costs (Tian et al. Citation2012; Wang et al. Citation2011). Under such circumstances, the encroachment on farmland poses a great threat to China’s food security, as land is such an important production factor in agriculture (Lichtenberg and Ding Citation2008). Accordingly, the Chinese government has promulgated a series of laws and regulations (e.g. the Basic Farmland Protection Regulation in 1994, the New Land Administration Law in 1999) to protect cultivated land (Li, Deng, and Seto Citation2013). The conversion from cropland to urban land during 1990–2015 was positively correlated with the proportion of cropland in 1990, and the expansion of the western cities tended to rely more on encroaching upon cropland, but this was not the case for the northeastern cities (Supplementary Figure 11). The proportional difference of new urban land converted from cropland across the various regions might be related to the cropland quality (Supplementary Figure 12). The larger percentage of high-quality farmland in the northeast and the higher cost of expropriating this land may have led to the lower proportion of new urban land converted from cropland. The conversion from rural settlements to urban land has been related to the liberation of the rural labor force (Wang Citation2013). The corresponding proportion of new urban land converted from rural settlements was clearly higher in the northeast and east (Supplementary Figure 3), which can be attributed to the locally higher level of agricultural mechanization (Supplementary Table 5).
Edge-expansion played a predominant role in China’s urban expansion process, and alternately rising proportions of infilling and leapfrogging were observed during the course of 1990–2015 (). In general, infilling and edge-expansion result in a compact urban form, considering that they do not increase the number of urban land patches, while leapfrogging leads to a fragmented city as the new patches growing in this way are not connected with the primary urban land. The compact and diffuse forms of urban expansion both have their respective benefits. Compact urban expansion can promote the efficiency of land use and can help to mitigate the subsequent impact on the environment, and the diffuse form can help to protect native natural habitats and support species diversity (Cairnes Citation1996; Wu et al. Citation2011). We found the urban growth types varied among cities of different regions and sizes, and the government should consider many factors (e.g. geographic location, economic development stage, the size of existing urban land areas, and possible ecological, social, and economic effects of urban expansion) to formulate proper urban growth plan for each city (Zhao et al. Citation2015).
Landscape metrics are widely used to measure composition and spatial configuration (McGarigal et al. Citation2002). This study depicted the landscape form of the occupied cropland from 1990 to 2015. We found that the landscape characteristics of the occupied farmland varied among the cities of different regions and sizes. For example, the occupied cropland was more fragmentized in the northeast and southeast coastal zones, as larger NP and smaller MPS values were found in these areas. However, this land-use pattern may not be conducive to the centralized management of agricultural production as it undermines the integrity of the arable land. To guide the subsequent urban growth, it is of great importance to understand the landscape patterns of occupied cropland, as inappropriate forms can have a negative impact on the environment (e.g. soil erosion) (Arnold and Gibbons Citation1996).
Limitations still remain in the results of this study. The five-year temporal resolution could be too coarse for the rapidly expanding areas (e.g. Shenzhen), as their urban expansion rate can change drastically within a short period of time (e.g. one or two years) under rapid economic development and policy support. High-frequency mapping of the urban areas, possibly even an annual frequency, is required to capture this kind of information. The understanding of the impacts of urban expansion on cropland is focused on quantity, but cropland quality remains to be investigated, due to data unavailability, and this is an aspect that is rather relevant to China’s food security. These questions will be addressed in our future research.
5. Conclusion
China has made remarkable achievements in its urbanization since the implementation of the reform and opening-up policy in 1978. In this study, we provide a comprehensive view of the urban expansion patterns of 291 Chinese cities from 1990 to 2015, based on six periods of the CLUD dataset. The AE and AGR of all 291 cities were 1869.81 km2 and 4.81%, respectively, during 1990–2015. Generally speaking, the urban expansion of the larger cities and eastern cities was more obvious (). According to the statistical results of all 291 cities, 65.22% and 17.49% of the newly developed urban land was converted from cropland and rural settlements, respectively, during 1990–2015. The proportional compositions of the source of newly developed urban land varied among cities of different regions and sizes (Supplementary Figure 3). Edge-expansion was the dominant growth form for most cities, followed by infilling and leapfrogging growth (Supplementary Table 2). The urban growth forms of different cities exhibited various characteristics in the different periods, but diffusion and coalescence coexisted in all periods from 1990 to 2015 (Supplementary Tables 3 and 4). The landscape characteristics of occupied cropland differed among cities of various regions and sizes. (). To accommodate the opportunities and challenges posed by urbanization, it is of great significance to investigate this process.
Supplementary_Material.doc
Download MS Word (10 MB)Disclosure statement
No potential conflict of interest was reported by the authors.
Additional information
Funding
Related Research Data
References
- Angel, Shlomo, Jason Parent, Daniel L. Civco, Alexander Blei, and David Potere. 2011. “The Dimensions of Global Urban Expansion: Estimates and Projections for All Countries, 2000–2050.” Progress in Planning 75: 53–107. doi: 10.1016/j.progress.2011.04.001
- Arnold, Chester L., Jr., and C. James Gibbons. 1996. “Impervious Surface Coverage: The Emergence of a Key Environmental Indicator.” Journal of the American Planning Association 62 (2): 243–258. doi: 10.1080/01944369608975688
- Bai, Xuemei, Jing Chen, and Peijun Shi. 2011. “Landscape Urbanization and Economic Growth in China: Positive Feedbacks and Sustainability Dilemmas.” Environmental Science & Technology 46 (1): 132–139. doi: 10.1021/es202329f
- Bai, Xuemei, Peijun Shi, and Yansui Liu. 2014. “Society: Realizing China’s Urban Dream.” Nature 509 (7499): 158–160. doi: 10.1038/509158a
- Bettencourt, Luís M. A., José Lobo, Dirk Helbing, Christian Kühnert, and Geoffrey B. West. 2007. “Growth, Innovation, Scaling, and the Pace of Life in Cities.” Proceedings of the National Academy of Sciences 104 (17): 7301–7306. doi:10.1073/pnas.0610172104.
- Cairnes, Lorraine. 1996. “The Compact City: A Sustainable Urban Form.” Urban Design International 1 (3): 293–294.
- Camagni, Roberto, Maria Cristina Gibelli, and Paolo Rigamonti. 2002. “Urban Mobility and Urban Form: The Social and Environmental Costs of Different Patterns of Urban Expansion.” Ecological Economics 40 (2): 199–216. doi:10.1016/S0921-8009(01)00254-3.
- Chan, Kam Wing. 2007. “Misconceptions and Complexities in the Study of China’s Cities: Definitions, Statistics, and Implications.” Eurasian Geography and Economics 48 (4): 383–412. doi:10.2747/1538-7216.48.4.383.
- Chan, Chak K., and Xiaohong Yao. 2008. “Air Pollution in Mega Cities in China.” Atmospheric Environment 42 (1): 1–42. doi: 10.1016/j.atmosenv.2007.09.003
- Chi, Peng, Yimin Cai, Tieyu Wang, Rongbo Xiao, and Weiping Chen. 2016. “Regional Probabilistic Risk Assessment of Heavy Metals in Different Environmental Media and Land Uses: An Urbanization-Affected Drinking Water Supply Area.” Scientific Reports 6: 37084. doi: 10.1038/srep37084
- Fang, Chuanglin, Guangdong Li, and Shaojian Wang. 2016. “Changing and Differentiated Urban Landscape in China: Spatiotemporal Patterns and Driving Forces.” Environmental Science & Technology 50 (5): 2217–2227. doi:10.1021/acs.est.5b05198.
- Gao, Bin, Qingxu Huang, H. E. Chunyang, and Yinyin Dou. 2017. “Similarities and Differences of City-Size Distributions in Three Main Urban Agglomerations of China from 1992 to 2015: A Comparative Study Based on Nighttime Light Data.” Journal of Geographical Sciences 27 (5): 533–545. doi: 10.1007/s11442-017-1391-7
- Gao, Bin, Qingxu Huang, Chunyang He, Zexiang Sun, and Da Zhang. 2016. “How Does Sprawl Differ Across Cities in China? A Multi-Scale Investigation Using Nighttime Light and Census Data.” Landscape and Urban Planning 148: 89–98. doi:10.1016/j.landurbplan.2015.12.006.
- Gu, Chaolin, Liya Wu, and Ian Cook. 2012. “Progress in Research on Chinese Urbanization.” Frontiers of Architectural Research 1 (2): 101–149. doi:10.1016/j.foar.2012.02.013.
- Hass, Jan, and Yifang Ban. 2014. “Urban Growth and Environmental Impacts in Jing-Jin-Ji, the Yangtze, River Delta and the Pearl River Delta.” International Journal of Applied Earth Observation and Geoinformation 30: 42–55. doi:10.1016/j.jag.2013.12.012.
- He, Chunyang, Zhifeng Liu, Jie Tian, and Qun Ma. 2014. “Urban Expansion Dynamics and Natural Habitat Loss in China: A Multiscale Landscape Perspective.” Global Change Biology 20 (9): 2886–2902. doi:10.1111/gcb.12553.
- He, Chunyang, Zhifeng Liu, Min Xu, Qun Ma, and Yinyin Dou. 2017. “Urban Expansion Brought Stress to Food Security in China: Evidence from Decreased Cropland Net Primary Productivity.” Science of The Total Environment 576: 660–670. doi:10.1016/j.scitotenv.2016.10.107.
- Huang, Qingxu, Chunyang He, Bin Gao, Yang Yang, Zhifeng Liu, Yuanyuan Zhao, and Yue Dou. 2015. “Detecting the 20 Year City-Size Dynamics in China with a Rank Clock Approach and DMSP/OLS Nighttime Data.” Landscape and Urban Planning 137: 138–148. doi:10.1016/j.landurbplan.2015.01.004.
- Huang, Zhiji, Yehua Dennis Wei, Canfei He, and Han Li. 2015. “Urban Land Expansion Under Economic Transition in China: A Multi-Level Modeling Analysis.” Habitat International 47: 69–82. doi:10.1016/j.habitatint.2015.01.007.
- Kuang, Wenhui, Wenfeng Chi, Dengsheng Lu, and Yinyin Dou. 2014. “A Comparative Analysis of Megacity Expansions in China and the U.S.: Patterns, Rates and Driving Forces.” Landscape and Urban Planning 132: 121–135. doi:10.1016/j.landurbplan.2014.08.015.
- Kuang, Wenhui, Jiyuan Liu, Jinwei Dong, Wenfeng Chi, and Chi Zhang. 2016. “The Rapid and Massive Urban and Industrial Land Expansions in China between 1990 and 2010: A CLUD-Based Analysis of Their Trajectories, Patterns, and Drivers.” Landscape and Urban Planning 145: 21–33. doi:10.1016/j.landurbplan.2015.10.001.
- Kuang, Wenhui, Yue Liu, Yinyin Dou, Wenfeng Chi, and Guangsheng Chen. 2015. “What Are Hot and What Are Not in an Urban Landscape: Quantifying and Explaining the Land Surface Temperature Pattern in Beijing, China.” Landscape Ecology 30 (2): 357–373. doi: 10.1007/s10980-014-0128-6
- Li, Jiang, Xiangzheng Deng, and Karen C. Seto. 2013. “The Impact of Urban Expansion on Agricultural Land Use Intensity in China.” Land Use Policy 35 (14): 33–39.
- Li, Guangdong, and Chuanglin Fang. 2014. “Analyzing the Multi-Mechanism of Regional Inequality in China.” The Annals of Regional Science 52 (1): 155–182. doi:10.1007/s00168-013-0580-2.
- Li, Cheng, Junxiang Li, and Jianguo Wu. 2013. “Quantifying the Speed, Growth Modes, and Landscape Pattern Changes of Urbanization: A Hierarchical Patch Dynamics Approach.” Landscape Ecology 28 (10): 1875–1888. doi:10.1007/s10980-013-9933-6.
- Li, Xia, and Anthony Gar-On Yeh. 2004. “Analyzing Spatial Restructuring of Land Use Patterns in a Fast Growing Region Using Remote Sensing and GIS.” Landscape and Urban Planning 69 (4): 335–354. doi:10.1016/j.landurbplan.2003.10.033.
- Li, Xiaoma, Weiqi Zhou, and Zhiyun Ouyang. 2013. “Forty Years of Urban Expansion in Beijing: What is the Relative Importance of Physical, Socioeconomic, and Neighborhood Factors?” Applied Geography 38: 1–10. doi:10.1016/j.apgeog.2012.11.004.
- Lichtenberg, Erik, and Chengri Ding. 2008. “Assessing Farmland Protection Policy in China.” Land Use Policy 25 (1): 59–68. doi:10.1016/j.landusepol.2006.01.005.
- Lin, Xueqin, Yang Wang, Shaojian Wang, and Dai Wang. 2015. “Spatial Differences and Driving Forces of Land Urbanization in China.” Journal of Geographical Sciences 25 (5): 545–558. doi:10.1007/s11442-015-1186-7.
- Liu, Jiyuan, Wenhui Kuang, Zengxiang Zhang, Xinliang Xu, Yuanwei Qin, Jia Ning, Wancun Zhou, et al. 2014. “Spatiotemporal Characteristics, Patterns, and Causes of Land-Use Changes in China Since the Late 1980s.” Journal of Geographical Sciences 24 (2): 195–210. doi:10.1007/s11442-014-1082-6.
- Liu, Jiyuan, Mingliang Liu, Hanqin Tian, Dafang Zhuang, Zengxiang Zhang, Wen Zhang, Xianming Tang, and Xiangzheng Deng. 2005. “Spatial and Temporal Patterns of China’s Cropland During 1990–2000: An Analysis Based on Landsat TM Data.” Remote Sensing of Environment 98 (4): 442–456. doi: 10.1016/j.rse.2005.08.012
- Liu, Jiyuan, Mingliang Liu, Dafang Zhuang, Zengxiang Zhang, and Xiangzheng Deng. 2003. “Study on Spatial Pattern of Land-Use Change in China During 1995–2000.” Science in China Series D: Earth Sciences 46 (4): 373–384. doi:10.1360/03yd9033 doi: 10.1360/02ye0285
- Liu, Jiyuan, Hanqin Tian, Mingliang Liu, Dafang Zhuang, Jerry M. Melillo, and Zengxiang Zhang. 2005. “China’s Changing Landscape During the 1990s: Large Scale Land Transformations Estimated with Satellite Data.” Geophysical Research Letters 32 (2): L02405.
- Liu, Jiyuan, Qian Zhang, and Yunfeng Hu. 2012. “Regional Differences of China’s Urban Expansion from Late 20th to Early 21st Century Based on Remote Sensing Information.” Chinese Geographical Science 22 (1): 1–14. doi:10.1007/s11769-012-0510-8.
- Liu, Jiyuan, Zengxiang Zhang, Xinliang Xu, Wenhui Kuang, Wancun Zhou, Shuwen Zhang, Rendong Li, et al. 2010. “Spatial Patterns and Driving Forces of Land Use Change in China During the Early 21st Century.” Journal of Geographical Sciences 20 (4): 483–494. doi:10.1007/s11442-010-0483-4.
- McDonald, Robert I., Pamela Green, Deborah Balk, Balazs M. Fekete, Carmen Revenga, Megan Todd, and Mark Montgomery. 2011. “Urban Growth, Climate Change, and Freshwater Availability.” Proceedings of the National Academy of Sciences 108 (15): 6312–6317. doi: 10.1073/pnas.1011615108
- McGarigal, Kevin, Sam A. Cushman, Maile C. Neel, and Eduard Ene. 2002. “FRAGSTATS: Spatial Pattern Analysis Program for Categorical Maps.”
- NBSC (National Bureau of Statistics of China). [1978] 2016. China Statistical Yearbook (1978–2016). Beijing: China Statistics Press.
- NBSC (National Bureau of Statistics of China). 2014. China Urban Construction Statistical Yearbook (2014). Beijing: China Statistics Press.
- Normile, D. 2008. “China’s Living Laboratory in Urbanization.” Science 319 (5864): 740–743. doi: 10.1126/science.319.5864.740
- Qu, Wenyuan, Shuqing Zhao, and Yan Sun. 2014. “Spatiotemporal Patterns of Urbanization Over the Past Three Decades: A Comparison between Two Large Cities in Southwest China.” Urban Ecosystems 17 (3): 723–739. doi:10.1007/s11252-014-0354-3.
- Ru, Xin, Xueyi Lu, and Perlin Li. 2012. Blue Book of China’s Society: Society of China Analysis and Forecast (2012). Beijing: Social Sciences Academic Press.
- Schneider, A., and C. M. Mertes. 2014. “Expansion and Growth in Chinese Cities, 1978–2010.” Environmental Research Letters 9 (2): 024008. doi: 10.1088/1748-9326/9/2/024008
- Sui, Daniel Z., and Hui Zeng. 2001. “Modeling the Dynamics of Landscape Structure in Asia’s Emerging Desakota Regions: A Case Study in Shenzhen.” Landscape and Urban Planning 53 (1–4): 37–52. doi:10.1016/S0169-2046(00)00136-5.
- Sun, Yan, Shuqing Zhao, and Wenyuan Qu. 2015. “Quantifying Spatiotemporal Patterns of Urban Expansion in Three Capital Cities in Northeast China Over the Past Three Decades Using Satellite Data Sets.” Environmental Earth Sciences 73 (11): 7221–7235. doi:10.1007/s12665-014-3901-6.
- Tian, Hanqin, Chaoqun Lu, Jerry Melillo, Wei Ren, Yao Huang, Xiaofeng Xu, Mingliang Liu, et al. 2012. “Food Benefit and Climate Warming Potential of Nitrogen Fertilizer Uses in China.” Environmental Research Letters 7 (4): 044020. doi: 10.1088/1748-9326/7/4/044020
- Tv, Ramachandra, Bharath H. Aithal, and Durgappa D. Sanna. 2012. “Insights to Urban Dynamics Through Landscape Spatial Pattern Analysis.” International Journal of Applied Earth Observation and Geoinformation 18: 329–343. doi:10.1016/j.jag.2012.03.005.
- United Nations, Department of Economic and Social Affairs, Population Division. 2015. “World Urbanization Prospects: The 2014 Revision, (ST/ESA/SER.A/366).”
- Wang, G. X. 2013. “The Basic Theory of Urbanization and Problems and Countermeasures of China’s Urbanization.” Population Research 6: 43–51.
- Wang, Xiaobin, Dianxiong Cai, Willem B. Hoogmoed, and Oene Oenema. 2011. “Regional Distribution of Nitrogen Fertilizer Use and N-Saving Potential for Improvement of Food Production and Nitrogen Use Efficiency in China.” Journal of the Science of Food and Agriculture 91 (11): 2013–2023. doi: 10.1002/jsfa.4413
- Wang, Lei, CongCong Li, Qing Ying, Xiao Cheng, XiaoYi Wang, Xueyan Li, Luanyun Hu, et al. 2012. “China’s Urban Expansion from 1990 to 2010 Determined with Satellite Remote Sensing.” Chinese Science Bulletin 57 (22): 2802–2812. doi: 10.1007/s11434-012-5235-7
- Wei, Yehua Dennis, Han Li, and Wenze Yue. 2017. “Urban Land Expansion and Regional Inequality in Transitional China.” Landscape and Urban Planning 163: 17–31. doi:10.1016/j.landurbplan.2017.02.019.
- Wei, Xing, Zhao Zhang, Peijun Shi, Pin Wang, Yi Chen, Xiao Song, and Fulu Tao. 2015. “Is Yield Increase Sufficient to Achieve Food Security in China?” PLoS ONE 10 (2): e0116430. doi:10.1371/journal.pone.0116430.
- Wu, Jianguo, G. Darrel Jenerette, Alexander Buyantuyev, and Charles L. Redman. 2011. “Quantifying Spatiotemporal Patterns of Urbanization: The Case of the Two Fastest Growing Metropolitan Regions in the United States.” Ecological Complexity 8 (1): 1–8. doi:10.1016/j.ecocom.2010.03.002.
- Wu, Jianguo, Wei-Ning Xiang, and Jingzhu Zhao. 2014. “Urban Ecology in China: Historical Developments and Future Directions.” Landscape and Urban Planning 125: 222–233. doi:10.1016/j.landurbplan.2014.02.010 doi: 10.1016/j.landurbplan.2014.01.018
- Wu, W. J., S. Q. Zhao, C. Zhu, and J. L. Jiang. 2015. “A Comparative Study of Urban Expansion in Beijing, Tianjin and Shijiazhuang Over the Past Three Decades.” Landscape and Urban Planning 134: 93–106. doi:10.1016/j.landurbplan.2014.10.010.
- Xu, Min, Chunyang He, Zhifeng Liu, and Yinyin Dou. 2016. “How Did Urban Land Expand in China between 1992 and 2015? A Multi-Scale Landscape Analysis.” PLoS ONE 11 (5): e0154839. doi:10.1371/journal.pone.0154839.
- Xu, Chi, Maosong Liu, Cheng Zhang, Shuqing An, Wen Yu, and Jing M. Chen. 2007. “The Spatiotemporal Dynamics of Rapid Urban Growth in the Nanjing Metropolitan Region of China.” Landscape Ecology 22 (6): 925–937. doi:10.1007/s10980-007-9079-5.
- Xu, Xinliang, and Xibi Min. 2013. “Quantifying Spatiotemporal Patterns of Urban Expansion in China Using Remote Sensing Data.” Cities 35: 104–113. doi:10.1016/j.cities.2013.05.002.
- Zeng, Zhao-Cheng, Liping Lei, Kimberly Strong, Dylan B. A. Jones, Lijie Guo, Min Liu, Feng Deng, et al. 2017. “Global Land Mapping of Satellite-Observed CO2 Total Columns Using Spatio-Temporal Geostatistics.” International Journal of Digital Earth 10 (4): 426–456. doi:10.1080/17538947.2016.1156777.
- Zhang, Qian, Yifang Ban, Jiyuan Liu, and Yunfeng Hu. 2011. “Simulation and Analysis of Urban Growth Scenarios for the Greater Shanghai Area, China.” Computers, Environment and Urban Systems 35 (2): 126–139. doi:10.1016/j.compenvurbsys.2010.12.002.
- Zhao, S. Q., D. C. Zhou, C. Zhu, W. Y. Qu, J. J. Zhao, Y. Sun, D. Huang, W. J. Wu, and S. G. Liu. 2015. “Rates and Patterns of Urban Expansion in China’s 32 Major Cities Over the Past Three Decades.” Landscape Ecology 30 (8): 1541–1559. doi:10.1007/s10980-015-0211-7.
- Zhao, Shuqing, Decheng Zhou, Chao Zhu, Yan Sun, Wenjia Wu, and Shuguang Liu. 2015. “Spatial and Temporal Dimensions of Urban Expansion in China.” Environmental Science & Technology 49 (16): 9600–9609. doi:10.1021/acs.est.5b00065.