
ABSTRACT
Terrain reversal effect (TRE) causes reversed 3D shape perception in satellite images and shaded relief maps (SRMs), and introduces difficulties in identifying landforms such as valleys and ridges. With this paper, in a controlled laboratory experiment, we compare how well 27 participants could identify valleys and ridges over 33 locations using SRMs, color satellite images and grayscale satellite images. The main depth cue is shadow both in vertical-view images and SRMs. However, the presence of texture and color in images also affect 3D shape perception. All our participants experience the illusion strongly: with the SRMs, it is very severe (2% accuracy), with grayscale images low but considerably better than SRMs (17.6% accuracy), and slightly worse with color imagery (15.3% accuracy). These differences between SRMs and imagery suggest that the participants who are able to bypass the illusion consciously or subconsciously interpret the photographic information. We support this observation further with a cue-strength analysis. Furthermore, we provide exploratory analyses of the effects of expertise, global convexity bias, and bistable perception. Our original empirical observations serve towards a better understanding of this visual illusion, and contribute towards nuanced and appropriate solutions to correcting for TRE differently for satellite images and SRMs.
1. Introduction and background
The terrain reversal effect (TRE), also termed as the relief inversion effect (Imhof Citation1967), or false topographic perception phenomenon (Saraf et al. Citation1996), describes a perplexing visual illusion that occurs in earth imagery (e.g. Saraf et al. Citation1996; Rudnicki Citation2000; Toutin Citation2006; Bernabé-Poveda and Çöltekin Citation2015), lunar imagery (e.g. Wu, Li, and Gao Citation2013), as well as in shaded relief maps (SRMs) (e.g. Biland and Çöltekin Citation2017). When the illusion is present, convex landforms appear concave and vice versa (i.e. ridges appear as valleys, and valleys as ridges). This phenomenon can also occur with abstract drawings or everyday objects if the shadows in the scene are displaced, and thus is strongly connected to the position of the light source (Sun and Perona Citation1998). Light direction is pivotal for 3D perception, because the human brain attempts identifying shape from shading (e.g. Brewster Citation1847). If the shadows are not where they should be (based on an assumed light source), the perceptual system produces visual illusions that affects the depth perception (Gerardin, de Montalembert, and Mamassian Citation2007), as shown in .
Figure 1. Most viewers perceive the marked landform (ABC) ‘clearly as a ridge’ despite its true form (a valley in North Korea) and despite knowing where the light source is.
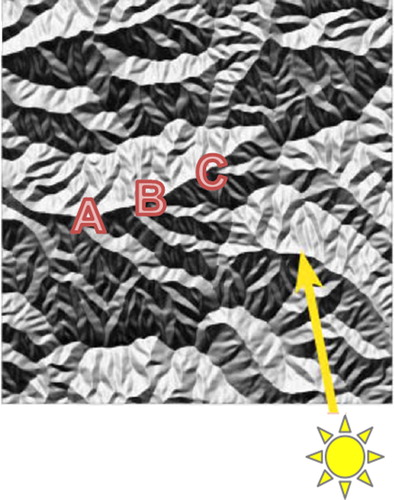
Even when the viewer is explicitly informed about the position of the light source, it is still very hard to see the 3D shape correctly. For example, in , a valley in North Korea (marked as ABC) is shown with an incident light at azimuth 168.1° and a solar zenith angle of 64.7° (marked by an arrow) as an SRM. Despite the explicit knowledge of the position of the light source, ABC appears as a ridge in to most viewers.
Identifying ‘which object in the scene casts which shadow’ is known as the shadow correspondence problem in perceptual psychology, which has a multitude of implications for understanding the spatial layout of a visual scene (Mamassian Citation2004). The shadow correspondence problem manifests itself in cartography through the relief inversion effect. The relief inversion effect and its relation to the position of the light source was identified (possibly independently from perceptual psychology), and noted for SRMs decades ago, e.g. by Imhof in late 1960s (Imhof Citation1967). Based on these observations, a widely followed cartographic convention for creating SRMs has been to place the light source at 315°NW. While this is roughly the right direction; in a recent experiment, Biland and Çöltekin (Citation2017) demonstrated that placing the light source at 337.5° (and even at 0°) yielded better results than 315° in terms of relief inversion effect with SRMs. At this point, it is important to note that the SRMs are rarely used without labels and possibly other visual information that might be helpful in interpreting the scene. However, for control reasons, we examine the SRMs as well as the satellite images without labels and any other annotations in the study presented in this paper.
As mentioned earlier, relief inversion (or terrain reversal) effect also occurs in satellite images, which are inherently different than SRMs. First, a satellite image holds much more information than an SRM. An SRM simply visualizes the terrain undulations based on a shading model for a chosen light direction. In contrast, a satellite image contains land cover information through texture and color, seasonality can be inferred, casted shadows are depicted, and the shading tone incorporates the reflectance characteristics of different surface materials. Another difference between the two can be in their geometry, that is, SRMs are perfectly controlled computer generated maps, while satellite images might have a weak perspective (images are not always taken precisely orthogonally, even though they are corrected later) and foreshortening.
Importantly, unlike with SRMs where the mapmakers can choose the illumination direction, the light source is ‘given’ for satellite images (the sun). Most remote sensing satellites acquire images at a sun-synchronous orbit (SSO, also termed ‘heliosynchronous’) (Shcherbakova, Beletskii, and Sazonov Citation1999). These SSO-bound satellites benefit from favorable lighting conditions and least haze during image acquisition, as they cross the equator in the morning hours (Saraf et al. Citation2005; Gil et al. Citation2014). Consequently, light source for sun-synchronous satellites falls somewhere between azimuth angles 140° and 175° in most cases for the Northern Hemisphere images (we deduced this range from various solar azimuth angles of images sourced from Google Earth). In simpler words, the sun shines from the south on the Northern Hemisphere during image acquisition, thus, the south-facing slopes are lit while the north-facing slopes are covered in shadow (for images of the Southern Hemisphere, the lighting conditions are the opposite). Consequently, displayed north-up, many of the Northern Hemisphere images contain complex shadow configurations, and are prone to TRE (Bernabé-Poveda and Çöltekin Citation2015).
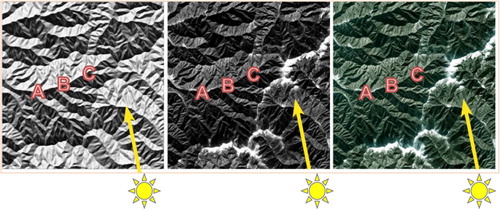
In images, besides the light direction, the presence of additional visual cues, such as land cover information can be relevant for the TRE. For example, when a ridge appears to be green whereas a valley bed seems to have snow, a viewer might knowingly or unknowingly pick up on this conflict and thus identify, and even perceive, the correct landform (). Thus, photographic texture might affect how viewers experience the TRE in satellite imagery. In addition, color is important in image interpretation, and even subtle differences in color play an important role in identifying land cover type and other recognizable features (Lillesand, Kiefer, and Chipman Citation2004); thus, we believe that color may also contribute in surpassing the illusion through a clearer identification of features such as snow and vegetation.
Figure 2. The SRM (left), GraySAT (center) and ColorSAT (right) of the same valley, all lit from azimuth 168.1°. With the satellite images, presence of texture, thus recognizable land cover (such as snow and vegetation) or features (such as rivers, volcanos, villages, etc.) might help identifying the landform correctly, and the color might further enhance the ability to identify the land cover information.
Currently, the contributions of texture and color in surpassing the TRE are not well-understood. Therefore, we conducted a controlled lab experiment to better understand whether and how much texture and color contribute to surpassing the TRE. Specifically, we compared the success and confidence rates of 27 participants in identifying landforms (valley or ridge) in 33 locations using SRMs, and their corresponding satellite images of the same spatial extent both in color and in grayscale (thus, a total of 99 images). In the following sections, we provide a review of the related work, our hypotheses based on the previous work, the details of the experiment setup, as well as our findings, and a discussion of their implications.
1.1. Related work
Most of the studies on shape from shading are conducted in perceptual psychology and they examine non-geographic media. In a seminal study featuring simple abstract objects (‘polo mints’), Kleffner and Ramachandran (Citation1992) demonstrated that our visual system assumes (a) the scene is illuminated by a single light source, and (b) the light shines from above. These concepts led to the theories called single-light-source assumption and the overhead illumination bias (Kleffner and Ramachandran Citation1992). In a curious twist, Sun and Perona (Citation1998) observed that the overhead illumination assumption had a left bias, that is, the assumption of the human visual system (HVS) is that the illumination source is not only above, but slightly above-left. In geographic visualizations, as introduced earlier, overhead illumination bias is clearly relevant in satellite images (Bernabé-Poveda and Çöltekin Citation2015) as well as in SRMs (Biland and Çöltekin Citation2017). As mentioned earlier, the left bias was also noted by cartographers, and Biland and Çöltekin (Citation2017) confirmed that there was a left bias in SRMs.
Besides the position of the light source, another important factor influencing the relief inversion appears to be familiarity with (or prior knowledge of) the viewed scene or objects within the scene. This has been well demonstrated, for example, with the ‘hollow-face illusion’ (Schröder Citation1852; Gregory Citation1997). In hollow-face (or hollow-mask) illusion, when a hollow face mask is viewed from behind, where the features are evidently concave, one still perceives a ‘normal face’ with convex features. In an experiment that included hollow face mask as well as other hollow objects modeled after toys, fruits, etc., Hill and Johnston (Citation2007) demonstrated that the more familiar an object is to the viewer, the stronger the illusion was. The fact that the level of familiarity correlates with the level of reversal (i.e. the illusion) offers strong evidence that the familiarity (thus the cognitive top-down interpretation of the scene) can change our bottom-up perceptual experiences. Hill and Johnston (Citation2007) further observed that in case of strong familiarity, where the light source was placed did not change the outcome. Another known bias, perhaps somewhat related to familiarity with convex shapes, is termed global convexity bias (Hill and Bruce Citation1994; Mamassian and Landy Citation1998; Langer and Bülthoff Citation2001; Liu and Todd Citation2004), in which the central observation is that in case of ambiguity, humans more often perceive convex shapes than concave shapes.
In the case of geographic features, especially in the case of valleys and ridges as featured in this study, one might argue that they are inherently different – in terms of familiarity – than faces and other hallow objects studied by Hill and Johnston (Citation2007). Valleys and ridges are both perfectly possible landforms (as opposed to an inverted face), and it is not necessarily clear if humans are more familiar with a valley than a ridge or vice versa. However, based on the global convexity bias theory, one might hypothesize that viewers are more likely to see ridges in case of ambiguity. Similarly, since humans often settle in valleys and planes (and historically are more familiar with terrestrial views than aerial views), it is plausible to suggest that humans look considerably more often at convex shapes, such as hills and mountains from a first-person (terrestrial) perspective. On the other hand, from an aerial perspective, we might be equally (un)familiar with both ridges and valleys, and thus, familiarity should not play a strong role in terms of global convexity bias in the case of TRE.
TRE has been noted in satellite imagery by several researchers both in earth imagery (e.g. Saraf et al. Citation1996; Rudnicki Citation2000; Toutin Citation2006) and planetary remote sensing (Wu, Li, and Gao Citation2013), although user experiments on this subject is rare. In a relatively recent study, Bernabé-Poveda and Çöltekin (Citation2015) investigated the prevalence of TRE in an online user experiment with 535 participants. Bernabé-Poveda and Çöltekin (Citation2015) reported successful identification of 3D landforms in only 40.3% of cases for satellite images sampled from the Northern Hemisphere, while the participants reached a success rate of at least 75.5% with images sampled from the Southern Hemisphere. Other researchers, as well as our self-experimentation with systematic image sampling, confirm that the TRE in earth imagery is largely a problem for the Northern Hemisphere images, especially pronounced in rugged/hilly terrain, and in mid-latitudes (Saraf et al. Citation1996; Bernabé-Poveda, Sánchez-Ortega, and Çöltekin Citation2011). Biland and Çöltekin (Citation2017) demonstrated with SRMs that, southern light directions between 112.5° and 225° yield no more than 10% success rate in landform identification for valleys and ridges. SSO-bound satellites acquire Northern Hemisphere images lit from southern directions falling into this window. The 33 images we selected in this study were acquired while the median solar azimuth was 162°; thus, in principle, we expect similarly low accuracy rates in landform identification for our SRM stimuli. We also expect low accuracy rates for the satellite images as the main depth cue is shadow, however prior knowledge of the land cover features (e.g. snow, vegetation and rivers) might remedy the illusion to some degree.
Another point related to familiarity and/or prior knowledge is the level of this knowledge based on individual or group differences. As opposed to faces and other everyday objects that (one might assume) everyone is familiar with, in the case of SRMs and satellite images, expertise might be important to consider (Bernabé-Poveda and Çöltekin Citation2015). Experts (in domains related to geography) work with satellite imagery more often than non-experts, and their knowledge of geomorphology, weather phenomenon and land-use patterns might affect their interpretation of the landforms, possibly surpassing the illusion (TRE). Furthermore, experts who perform visuo-spatial analysis on imagery often are more familiar with how the Earth looks from above than non-experts. We also assume that geo-experts from Europe, North America or Asia largely work with satellite imagery of the Northern Hemisphere (and possibly less often with images of the Southern Hemisphere). Therefore, they might be accustomed to a southern light direction, irrespective whether they are aware of it or not. Thus, they may be (unconsciously) assuming the light to shine from the South, and possibly cognitively ‘auto-correct’ against the TRE. Previous user studies tackling the contribution of expertise on this topic are rare. Bernabé-Poveda and Çöltekin (Citation2015) reported that experts indeed surpassed the illusion more often (thus were on average a little better in identifying the correct landform on a satellite image that was illuminated from the south-east) than non-experts with satellite images. With the SRMs, Biland and Çöltekin (Citation2017) did not observe an effect based on expertise, although descriptive statistics suggested a small advantage for experts. Based on these previous findings, we assume that experts will achieve a better accuracy in this study in landform identification with satellite images of the Northern Hemisphere.
Another potentially important factor that might affect terrain perception might be the presence or absence of color. For example, early satellite images were acquired in grayscale and are still relevant for time-series analyses or change detection studies; and to this day some panchromatic images are captured. Even though color can be important in recognizing land cover information (Wichmann, Sharpe, and Gegenfurtner Citation2002; Lillesand, Kiefer, and Chipman Citation2004), we know little to nothing about the contribution of color in surpassing the TRE. The studies we reviewed (Imhof Citation1967; Mamassian and Landy Citation1998; Sun and Perona Citation1998; Hill and Johnston Citation2007) worked with grayscale visualizations, or when color was present, it was not a comparative study. Similarly, Biland and Çöltekin (Citation2017) used only grayscale SRMs and Bernabe and Çöltekin (Citation2015) only used color satellite images. We assume, as mentioned earlier, color might help in surpassing the TRE, as it would potentially make it easier to identify land cover features such as snow, rivers, etc.
Last but not least, some studies on relief inversion as well as other illusions in perceptual psychology (e.g. Kornmeier and Bach Citation2006) identified the so-called bistable perception, in which the perception switches between two opposing views (e.g. convex becomes concave, or a motion illusion changes direction halfway). Bistable perception could be relevant for a study such as ours, because it would possibly affect the responses in some way, but also interestingly, as far as we are aware, this effect (bistable perception) has not been linked to terrain perception until now.
1.2. Hypotheses
Our literature review, as summarized above, revealed that no comparative studies were conducted to understand how TRE might differ in satellite images and in SRMs. While the main depth cue is shadow both in SRMs and satellite images, we identified various differences between SRMs and satellite images that might affect depth perception in the context of TRE, and thus we hypothesized that:
the land cover information contained in both grayscale and color satellite images should weaken the TRE, and consequently, decrease participants’ confidence in their answers (i.e. when the effect is strong, participants are more sure of their answers than if the effect is somewhat weak, which is when more of the participants detect something is wrong in the scene);
color images should further weaken the TRE in satellite images, as they should allow inferring information such as seasonal patterns better than a black-and-white satellite image. Furthermore, we conducted exploratory analyses with the following post-experimental hypotheses: (a) clearer/stronger land cover cues should help surpassing the illusion in satellite images, (b) experience (i.e. frequency of working with satellite images) should help surpassing the TRE with satellite images, and (c) there should be a global convexity bias both in SRMs and in satellite images because people are exposed to convex shapes more often than concave shapes. Aside from these, we checked for the so-called bistable perception, which we expected should occur part of the time at least with the SRMs.
2. Methods
To test our hypotheses, we compared the three visualization/map types in a controlled laboratory experiment: SRMs, color satellite images (henceforth ColorSAT) and black-and-white satellite images (henceforth GraySAT). Participants were asked to identify landforms (valleys or ridges). Below we detail our methods.
2.1. Experimental design
Using a within-subject factorial design, we studied the prevalence of the TRE in 33 different locations: Each location was presented three times, using three distinct visualization/map types (henceforth ‘image types’ for simplicity), thus participants each worked with a total of 99 stimuli. Therefore, the independent variable in this study is image type, and has three levels (SRM, GraySAT and ColorSAT).
We counterbalanced for various factors that can be important contributors to the TRE, or might affect the results otherwise. For example, a possible global convexity bias can affect the TRE (elaborated in Section 2.2.2). Furthermore, we ensured that landform configuration (number of valleys and ridges), sun-landform alignment (orientation of the valley/ridge in relation to the light source) and varying amounts of land cover cue (snow, vegetation and rivers) occurred approximately evenly across the satellite images. Additionally, to account for possible order effects (e.g. fatigue and learning), we presented the 99 stimuli in a random order and 15 humorous memory distractors were added in random intervals. Note that the 99 stimuli were jointly shown with 128 other stimuli for a (related but) separate study; reducing the likelihood of a specific terrain occurring in succession.
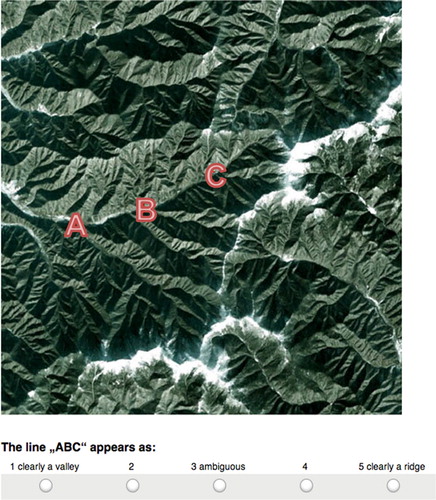
As dependent variables, we measured participants’ accuracy in identifying landforms, and their confidence in their judgment as an indication of if they were aware of the effect. We used a 5-point Likert scale to collect responses while the participants marked if a landform was clearly a valley or clearly a ridge (see for an example). If the participants were not very confident about their responses, they could balance with options ‘2’ and ‘4’; and in case of indetermination, they could choose ‘3’ (ambiguous).
Figure 3. An example stimulus and task.
2.2. Materials
We selected the 33 terrains from mountainous landscapes of the Northern Hemisphere; mostly located in the Caucasus, the Himalaya, the Plateau of Tibet and the Tien Shan, but also in Japan and North Korea. We avoided terrains from the participants’ home country (Switzerland) and nearby regions to stay clear of potential effects of prior knowledge. Mainly QuickBird – but also a few WorldView-2 – satellite images were sampled as screenshots from Google Earth 7.1.2.2041. The solar zenith angles of the satellite images range from 29.4° to 69.2° and the median is at 55.0°. The solar azimuth angles range from 154.3° to 170.8° and the median is at 162.2°. The coverage of the selected terrains on the ground varies between 15 and 17 km.
2.2.1. Sampling of the satellite images
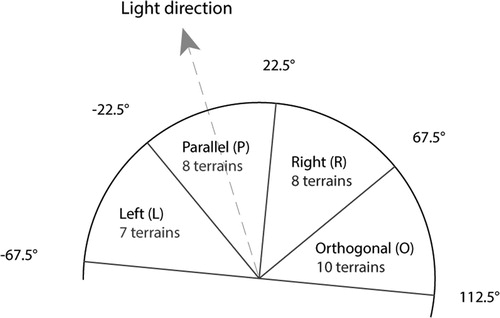
We sampled the images so that TRE is present in the images (based on our own judgement). We confirmed the true landform configuration using information from Google Earth (altitude above sea level). We ensured that the two landform configurations valley and ridge occur evenly (17 valleys and 16 ridges), to avoid any effects of a potential global convexity bias. Furthermore, we collected images with varying ‘strengths’ of land cover cue: We considered mild and clear cues, to ensure they both were presented in the images. Clear cues refer to land cover features that give a clear indication about what the true landform configuration might be, e.g. a snow patch or a well discernible river. Mild cues refer to land cover features with little or no hints, such as a vegetation line, a rocky or in forest-covered landscape (some of these cues can be considered moderate, but for ease of communication, we call this category ‘mild’). Selected valleys and ridges were also counterbalanced for the orientation of the valleys and ridges. As mentioned earlier, the sun’s position (i.e. the illumination source) is usually somewhere in the south-east in the satellite images of the Northern Hemisphere (between 140° and 175° solar azimuth). Depending in which angle the valley or the ridge is aligned to the light direction, the light/shade relationship would be entirely different. If the incident light is parallel to the landform, the contrast between the two slopes is reduced (in some cases entirely removed), thus the terrain would appear flat, or at least the 3D impression would be impaired. To prevent a possible bias imposed by this relationship, we controlled for this variable that we call sun-landform alignment. Note that the light source in SRMs technically is not the sun, but since it ideally simulates the sun, we find the wording appropriate both for satellite images and SRMs. We defined four categories and selected terrains from each category ().
Figure 4. Sun-landform alignment explained as a graph. In this illustration, the light direction is as marked with the dashed line (light shines from the south-east in the illustration). For example, if a landform feature’s orientation lies between −22.5° and +22.5° from its light direction, we assume the feature to be approximately parallel to its light direction.
For practical sampling reasons, it is not possible to entirely counterbalance for the three variables landform configuration, land cover cue and sun-landform alignment, i.e. to evenly distribute these among different image types, and among each other. However, we believe the distribution accounts of the potential effects of each variable, and thus, distributes the sources of bias.
2.2.2. Creation of the stimuli
To derive a satellite image’s solar zenith and azimuth angle (and to create the corresponding SRM), we must know its coordinates, acquisition date, and the source satellite. Google Earth provides the first two directly, and for the third, indicates the satellite operating company. Based on this information, and to ease sampling, we limited our focus on QuickBird 2 satellite images before September 2007 when WorldView-1 satellite was launched. We then verified with the CEOS Visualization Environment (COVE) suite of tools (www.ceos-cove.org) whether QuickBird 2 indeed has passed over given place on that specific day. The COVE suite enables users to visualize satellite sensor coverage areas of a given satellite and date. We checked the swath width of the satellite image on Google Earth and reassured that it is typical to that of QuickBird 2, which is 16.8 km at nadir (DigitalGlobe, https://www.digitalglobe.com/). This way, we could eliminate potential other satellites as the source satellites, such as Ikonos 2. After this verification process, using COVE, we derived the satellite image’s solar zenith and azimuth angle (Committee on Earth Observing Satellites (CEOS), http://ceos.org/). Next, the screenshots taken from Google Earth were georeferenced to the corresponding SRMs to obtain image congruence. In a last step, the ColorSAT were transformed into GraySAT with Landserf 2.0.
The corresponding SRMs were created using ASTER GDEM V2 (http://asterweb.jpl.nasa.gov/gdem.asp), provided by the United States Geological Survey (USGS) freely at http://earthexplorer.usgs.gov, at a resolution of 1 arc-second (approximately 30 m at the equator). These rough digital elevation models were first smoothed using the Terrain Sculptor software (Jenny Citation2010–Citation2018) and then hillshaded with Landserf 2.3 (Wood Citation2009–Citation2018) applying Lambertian reflectance. The illumination elevation and azimuth angles were set according to the sun illumination angles inherent in the corresponding satellite images. The rendering parameter vertical exaggeration was set to 0.4 and aspect bias to 70% for all DEMs (see Wood Citation2009–Citation2018 for a precise definition of these parameters). We deemed the resulting quality of SRMs based on these settings overall satisfactory based on our subjective visual evaluation.
2.3. Participants
We originally recruited 29 participants, however, excluded 2 of them from the analysis for technical reasons. For the 27 participants (14 female, 13 male), the age range was 19–79 with an average of 35.1 years. Seven participants held high school degrees, 14 bachelor’s, and 6 master’s or doctoral degree. All participants were right-handed except one, and all participants had normal or corrected-to-normal vision. One participant had a mild red–green color deficiency, however, their mean was not significantly different than the sample mean, thus, we did not remove this participant from the analysis. Thirteen participants reported to never/rarely use satellite images, nine occasionally and five often/daily. For the SRMs, 16 participants indicated that they never/rarely use them, 8 occasionally, 3 often and none daily.
2.4. Technical setup
We conducted the experiment in a controlled lab at the Department of Geography, at the University of Zurich. The stimuli and tasks were displayed through a browser on a Windows workstation with a 23-inch flat screen at 1920 × 1080 screen resolution. The stimuli height was kept constant at 550 pixels and the width varied between 508 and 640 pixels. Environmental factors such as viewing position, room lighting and temperature were kept constant.
2.5. Procedure
After welcoming the participants, we asked them to sign a consent form, and fill a background questionnaire on gender, age, education, frequency of use of satellite imagery/SRMs, expertise in geography and visual issues/abilities. Then, we seated the participants at the computer, and explained them the task (see ). Task explanation, interaction and written tasks were delivered in German, or, if preferred by the participant, in English. We told the participants that there was no wrong or right answer, and that they were testing the images for us, and they were not being tested. Furthermore, we told the participants to answer promptly, based on their perceptual experience, and not based on logical reasoning. We informed them that the experiment would take about 15–20 min, and that there were 242 images in total (together with 128 stimuli included for a related study, reported in Biland and Çöltekin Citation2017), so that they could estimate their progress through the experiment. After the task instructions, and as the participants confirmed that they understood the task, the main experiment started. They could ask clarification questions to the session moderator throughout the experiment if needed.
Following the main experiment, participants filled in a post-questionnaire, where they reported whether they noticed contradictions between perceived 3D shapes and the scene content. In another question, they reported whether their perception has switched between convex and concave shapes during a task (i.e. seen a valley, then a ridge, then perhaps again a valley; we called this ‘terrain flipping’), to understand whether they may have experienced the so-called bistable perception (Kornmeier and Bach Citation2006). Note that the participants did not know that the experiment was about terrain reversal until after the main experiment. Finally, the participants were debriefed, thanked and have received a 5-CHF voucher for the university cafeteria as well as a chocolate bar to reward their participation.
3. Results
Below we report response accuracy and response confidence analyses for all our variables following standard statistical procedures. Values for accuracy and confidence are both normalized to percentage after grouping the 5-point Likert responses into binary variables. For accuracy, ‘neutral’ responses are considered as ‘failure to identify’ and thus grouped with wrong responses, and wrong vs. right responses are then aggregated together irrespective of how strongly they were stated (see for an example task). Confidence is inferred from the ‘strength’ of these responses, that is, if participants marked 1 (clearly a valley) or 5 (clearly a ridge) in the Likert scale, we considered them highly confident. The other two (2 and 4) responses meant participants express hesitation, and thus were treated as a sign of ‘lower confidence’. ‘3’ responses were treated as ambiguous, and thus they were excluded from the analyses.
3.1. TRE in SRMs vs. satellite images
Overall accuracy and confidence plots immediately reveal that an overwhelming majority of the participants experience the illusion with all image types ().
Figure 5. Accuracy (left) and confidence (right) of the participants in identifying valleys and ridges using the three image types. Error bars show ±SEM, **p < .01, ***p < .001.
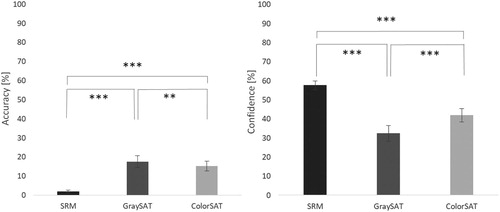
(left) shows, as expected, that the TRE is especially strong with the studied SRMs (mean accuracy = 2.0%, SE = 0.7), whereas it is weaker with both kinds of satellite imagery (GraySAT mean accuracy = 17.6%, SE = 3.1; ColorSAT mean accuracy = 15.3%, SE = 2.6). Surprisingly, we see that the illusion is a little stronger (by 2.3%) with the color images than with grayscale images. The confidence rates (, right) confirm that participants felt most confident where the illusion was strongest as expected: SRM mean confidence = 57.6%, SE = 2.3, followed by ColorSAT (mean confidence = 41.9%, SE = 3.5) and GraySAT (mean confidence = 32.4%, SE = 4.1). ‘Ambiguous’ ratings (not shown in ) further confirm these observations: on average, with the SRMs, participants marked ‘ambiguous’ only in 4.9% of the cases, while with the GraySAT this was 15.5%, and with the ColorSAT 12.3%.
Using a one-tailed McNemar (Citation1947) test, we confirmed that all observed differences in accuracy are statistically significant: between SRM and GraySAT (p < .001), SRM and ColorSAT (p < .001), and GraySAT and ColorSAT (p < .01). Similarly, using a Wilcoxon signed-rank test (Field Citation2009), we confirmed that all observed differences in confidence are statistically significant: between SRMs and GraySAT (z = −8.79, p < .001), SRMs and ColorSAT (z = −5.74, p < .001), as well as ColorSAT and GraySAT (z = −3.72, p < .001).
Based on these analyses, we retain our first hypothesis (information found in satellite images weaken the TRE in comparison to SRMs), however, we reject our second hypothesis (color should further weaken the effect). On the contrary, color makes the effect slightly stronger (by 2.3%).
3.2. Exploratory analyses
After we established that the illusion was considerably weaker in the satellite images in comparison to SRMs; we conducted exploratory analyses to examine whether this effect was possibly explained by land cover cue-strength or expertise of the participants. Additionally, we analyzed if a global convexity bias is observed in the satellite images and the SRMs we tested.
3.2.1. Cue-strength in satellite images
As introduced earlier, land cover cues sometimes clearly contradict the perceived landform. There are also mild/moderate cues which would require careful examination before one notices a conflict with the landform. We reasoned that if a cue seemed clear to us (authors), participants would be more likely to notice it too, and (consciously or subconsciously) use this information to surpass the effect. Consequently, they would also feel less confident when the land cover cue strongly contradicted the landform perception based on shadows. Thus, we comparatively analyzed the results for clear (13 locations) vs. mild (20 locations) cues. (left) confirms that participants were indeed more successful in identifying the true landforms (valleys and ridges) when the land cover cue was clear, both in GraySAT and ColorSAT conditions. We also see that, as expected, participants were more confident when the land cover cues were mild (, right).
Figure 6. Accuracy (left) and confidence (right) rates with land cover cues with varying strength in the two types of satellite images. Clearer cues lead to more accurate answers and lower confidence rates in both conditions. Error bars show ±SEM, *p < .05, **p < .01.
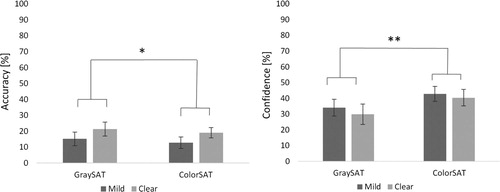
A one-tailed McNemar test for the accuracy and confidence measurements with the cue-strength types mild and clear for GraySAT and ColorSAT revealed that the observed differences are statistically significant in all comparisons (p < .05). Furthermore, a McNemar test confirmed that the absence of color information leads to consistently (but very slightly) higher accuracy in GraySAT as opposed to ColorSAT for both clear and mild. For confidence ratings, a one-tailed Wilcoxon signed-rank test revealed that for both mild and clear cues, differences between ColorSAT and GraySAT are statistically significant (mild z = −2.65, p < .01; clear z = −2.65, p < .01).
In summary, we see that clear land cover cues increase accuracy, and the confidence results suggest that clear land cover cues also lead to a more frequent realization of contradictions between perceived shape and the cue itself.
3.2.2. Experience with satellite imagery
We grouped the participants based on how frequently they used satellite images: we assigned those who marked never and rarely to low level of experience (n = 14), those who marked occasionally to medium (n = 9), and those who marked often and daily to high level of experience (n = 4). shows that both in GraySAT and ColorSAT conditions, as expected, there is a consistent raise in accuracy (left) and a consistent fall in confidence (right) as the level of experience increases. We report these group differences only based on descriptive statistics, because after splitting them into three groups, the sample sizes are too small for inferential statistics.
Figure 7. The influence experience in using satellite imagery on the accuracy and confidence.
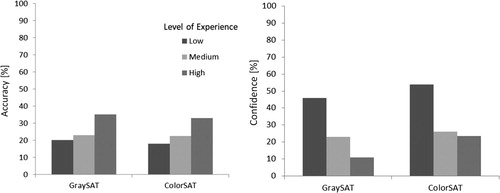
After examining the group differences at the aggregate level, we analyzed if the clearer land cover cues were specifically helpful for participants with high- or low-experience levels. For both GraySAT and ColorSAT, the response accuracy of the low-experience group barely increases with clear land cover cues in comparison to the mild (the differences are 0% and 4% increase respectively). This is true also for the group medium (differences are 2% and 3% respectively). However, high-experience group’s accuracy increases substantially as they move from mild cues to clear ones (differences are 22% with the GraySAT and 18% with the ColorSAT), suggesting that they are the ones interpreting the features.
3.2.3. Global convexity bias
Because a global convexity bias was reported in several prior perceptual experiments (Hill and Bruce Citation1994; Mamassian and Landy Citation1998; Langer and Bülthoff Citation2001; Liu and Todd Citation2004), we also explored if our participants would overall mark ridge (convex) more often than valley (concave). Because the number of valley and ridge stimuli in the study was counterbalanced (17 valleys and 16 ridges), if the participants marked ‘ridge’ more often, this could suggest a convexity bias. Descriptive statistics suggest that convexity bias might exist also with our stimuli, and participants marked ‘convex’ more often than ‘concave’ forms with all image types ().
Figure 8. Amounts of convex and concave ratings for each image type. Error bars show ±SEM. *p < .05. Error bars indicate very high variability in responses for both satellite image conditions.
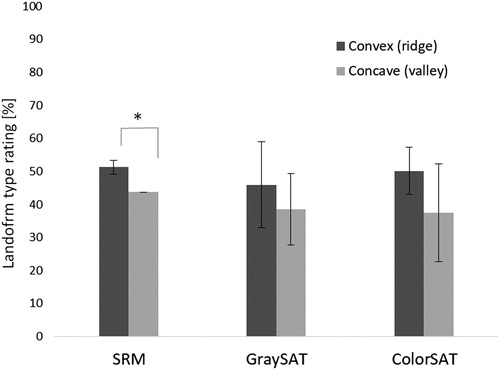
A Mann–Whitney U test revealed that the participants gave more accurate responses with the ridges than the valleys (U = 199.5, z = 2.754, p < .05), only with the SRMs. A closer look at the responses with the SRM revealed that a clear majority of the participants (19 out of 27) marked more convex than concave shapes (one marked more concave than convex, and seven of them marked even amounts of convex and concave). Note that light direction with the SRMs was not a factor in this case, because the range and the means are nearly identical (mean light directions for ridges: 162.54°, valleys: 162.56°). Despite the descriptive differences in the means, inferential tests have shown no statistically significant differences for the satellite images (p > .05). Therefore, at this point, we can confirm that there is a global convexity bias with the SRMs, but this cannot be confirmed for the satellite images.
3.2.4. Bistable perception
We first checked participants’ responses on whether they noticed a contradiction between the perceived landform (3D shape) and the land cover, as this could indicate awareness of the TRE. Awareness of the effect could affect the stability of their perception (i.e. could alter their perception). 77.8% of the participants reported that they noticed a contradiction at least once during the experiment. The reported contradictions were almost always with satellite images, and they were the land cover (snow in a valley, or river on a ridge). We also asked whether participants experienced ‘terrain flipping’. 70.4% of the participants have reported experiencing terrain flipping (thus, bistable perception) at least once at some point during the entire experiment, that is, over all 242 images. 70.4% appears very high at first sight, however, we also asked them to estimate how many times they experienced this, and with which map type. Participants’ average is roughly 10 times over 242 images, that is, participants reported experiencing terrain flipping only about 4% of the time. Of those who reported experiencing bistable perception; 47.4% reported it only with the SRMs, 42.1% with both SRMs and satellite images, and only 10.5% only with the satellite images. Thus, these results indicate that, overall, bistable perception occurred more often with the SRMs than with the satellite images in our study.
4. Discussion
Images provide valuable geographic information, whether they are terrestrial (e.g. Straumann, Çöltekin, and Andrienko Citation2014), oblique, or aerial. TRE occurs when the main depth cue is shadow, thus it is more often encountered in aerial-view SRMs and aerial/satellite imagery where perspective, relative size and other cues do not provide additional information. One of the puzzling aspects of TRE is the variation of how individuals experience it; where one person identifies a valley, the other might identify the same landform as a ridge. In Bernabé-Poveda and Çöltekin’s (Citation2015) online study, participants were able to bypass the illusion with satellite images up to 40% of the time. We reasoned that those who are able to bypass the illusion might consciously or subconsciously process the additional cues found in the scene. In the case of SRMs expert geomorphological knowledge (e.g. how a river bed would look like) could play a role, and with satellite images, land cover cues (such as vegetation, snow, built-areas, rivers, etc.) could affect the perceptual experiences of some. Our main goal in this paper was to obtain some early evidence on why some people do not seem to experience this illusion (or at least not as strongly as others), and we hypothesized that they do process these additional visual cues. We studied the question by comparing 33 illusion-prone SRMs with the (again illusion-prone) satellite images of the same locations in a user study where participants identified valleys and ridges. We counterbalanced for a number of factors, for example, the number of valleys and ridges, the orientation of these features (i.e. sun-landform alignment), and participants’ frequency of satellite image use.
We demonstrated that, indeed, when working with SRMs, only as little as 2% of the participants were able to bypass the illusion as they identified the valleys and ridges; while this number raised up to 17.6% with GraySAT and 15.3% with ColorSAT. While the difference between the SRMs and satellite images is striking, one should not overlook the fact the 17.6% and 15.3% success rates with the GraySAT and ColorSAT are still very low, demonstrating the severity of the effect.
Note that the 15.3% success rate with ColorSAT in our study is considerably lower than the 40% in the Bernabé-Poveda and Çöltekin (Citation2015) study, which was also conducted with ColorSAT. The differences in the results might be explained by two important differences in the study setups: (1) our experiment is a controlled lab study where all participants worked under similar conditions (e.g. on their own, used the same computer screen, etc.), and they were instructed to rely on their ‘perceptual judgement’ rather than interpretations, whereas Bernabé-Poveda and Çöltekin’s (Citation2015) study was conducted online, and the participants were not instructed specifically how to arrive at their conclusions regarding the landforms. (2) As opposed to Bernabé-Poveda and Çöltekin’s (Citation2015) study, we did not have labels indicating locations. Furthermore, while the scale and the extent the images between Bernabé-Poveda and Çöltekin’s (Citation2015) study and ours are roughly comparable, the proportion of images with very strong cues in their study might not be as high as in ours. They randomly sampled images from the Northern Hemisphere, whereas we selected ours carefully to contain the illusion. Our findings (that 15.3% can bypass the illusion with ColorSAT) might be more robust because the experiment was controlled. On the other hand, Bernabé-Poveda and Çöltekin (Citation2015) had more than 500 participants while we had 27 in this study, thus it is important to add more evidence on this subject in future experiments to establish what portion of the population can indeed bypass the illusion. Whether it is 15.3% as in our study, or ∼40% as in Bernabé-Poveda and Çöltekin’s (Citation2015), it is clear that a group of people are able to bypass the illusion with satellite images. With the SRMs, the success rate is 2%, and thus we extrapolate that it is likely everyone experiences the illusion when photographic cues are not present. It is important to note, though, that SRMs would be rarely used without any additional cues as we did in our study. In our study, we used ‘bare’ terrain without any labels or rivers or other markers of the landform to keep the SRMs as a ‘baseline’ to build the comparison with the satellite images. Furthermore, aspect and steepness calculations were kept constant, meaning that the low lands were not generalized to look flat, which may be contributed to strengthening of the illusion. In real life SRM-use, the amount of people who are able to interpret the scene might be more than 2%, especially if they were not told to judge the landform purely based on their perception.
Confidence rates (as shown in ) corroborate the accuracy rates: participants’ confidence in their success is stronger with the SRMs than with the satellite images. This maps linearly to the other conditions as well, best performance is with the GraySAT, with which, the participants are also the least confident. This inverse relationship between confidence and accuracy has also been observed by Biland and Çöltekin (Citation2017) in relation to terrain reversal (relief inversion) effect. As mentioned earlier, this is to be expected; if a viewer succeeds in identifying the landform despite the presence of a strong illusion, their perceptual and cognitive systems might be in conflict during this process (e.g. one perceives valley, but the previous knowledge of landform characteristics such as ‘odd’ river beds, or snow in unusual places in the scene might suggest otherwise). Therefore, they would feel less certain than others who clearly see a valley or a ridge, and sense no conflict based on other features in the scene.
Strengthening the argument that those who can bypass the illusion make use of photographic cues, we further demonstrated the success rates depend on the land cover cue-strength; i.e. the clearer the land cover cues are, the more successfully the participants identify the landform (valley or ridge); and again, as their success goes up, their confidence goes down, indicating that they are able to detect that something in the scene is ‘off’. This is the first empirical evidence demonstrating that the strength/clarity of the land cover cue indeed matters for this illusion and should be factored in when thinking, explaining or further studying this effect in satellite images.
The next finding, based on descriptive statistics, strengthens our arguments even more: the more frequently participants work with satellite images, the more likely they are to bypass the illusion. An interesting addition to this observation is that the land cover cue-strength matters only to those who have medium or high levels of experience with satellite images. In other words, those who have little experience with satellite images will get the illusion no matter if there are obvious cues, but those who work with satellite images often subconsciously learn to bypass it more. Specifically, we see that the accuracy of the highly experienced users in identifying landforms increases from 24% to 46% (22% difference) for GraySAT, and from 24% to 42% (18% difference) with the ColorSAT. Thus, our results suggest that the experienced users of satellite imagery consciously or subconsciously pick up on the land cover cues. Based on this observation, one can also speculate on the nature vs. nurture debate in the context of satellite image interpretation: our findings suggest that humans learn to interpret 3D landforms from such photographs rather than innately possess this ability.
Whether interpretation of landforms truly affects perception (do the experts really see the scene differently than others) is hard to measure except through self-reporting. From participant’s self-reporting, we believe their perception is affected. An eye movement analysis comparing the visual behavior of experts and non-experts could confirm if and how much they make use of land cover information. Nonetheless, it is important to note that ‘the increased success’ with expertise is still very low; that is highest success rate among the experts is still less than 40%.
Another interesting, but not necessarily surprising observation is that confidence rates go down as the experience goes up, similarly to Biland and Çöltekin (Citation2017). In the case of a TRE, experts tend to consciously or subconsciously identify that something is wrong with the scene and do not necessarily trust what they see.
While the general findings regarding the SRMs vs. satellite images, the land cover cue-strength and the level of experience confirmed our expectations, to our surprise, color was not helping against the illusion. In fact, the participants are slightly (2.3%) more successful with the grayscale images. This appears to be a small difference, but inferential statistics suggest that it is not due to chance. Our original proposition that color would make the land covers clearer was based on studies that tested the effect of color in other contexts (such as image interpretation, or feature recognition, e.g. Wichmann, Sharpe, and Gegenfurtner Citation2002; Lillesand, Kiefer, and Chipman Citation2004) but not based on studies linked to illusions. Color is a known contributor to many visual illusions (Brychtova and Çöltekin Citation2017), and can influence depth perception – for example, the so-called chromostereopsis (Allen and Rubin Citation1981) effect is known and (sometimes) exploited in cartography. While it is speculative at this point, it is possible that some of the images we had in our study had color configurations that were rather confusing in terms of depth perception than helpful. Importantly, if the color images do not have many features that specifically stand out because of their color, color may not contribute to the TRE at all. In our study, the ‘clear’ cues were often snow (which is white), and white could be even more pronounced in grayscale images, because it would be salient compared to its surroundings and would have no other salient colors competing for the viewer’s attention. A future study that counterbalances for different kinds of color features in images could confirm these speculations.
In an additional analysis, we checked for global convexity bias, which was observed in various perceptual experiments earlier (e.g. Hill and Bruce Citation1994; Mamassian and Landy Citation1998; Langer and Bülthoff Citation2001; Liu and Todd Citation2004), and is highly relevant to terrain reversal illusion. We could only confirm the global convexity bias for the SRMs, possibly because land cover cues in the satellite images interfere too much with identification of the landforms. Unlike in the Biland and Çöltekin (Citation2017) study, we do observe a convexity bias in this study with the SRMs. The reason for this difference could be that Biland and Çöltekin (Citation2017) have studied the entire spectrum of light directions, including SRMs that were not prone to the relief inversion effect, where in this case we only had the terrains that were lit from the south-east (i.e. all our input terrains were prone to the illusion, as the 2% success rate illustrated). It is important to note that, Biland and Çöltekin (2016) studied eight terrains with the ‘troubling’ light direction, whereas we studied 33 of them. Therefore, an important difference is the number of observations. We could not confirm a global convexity bias with satellite images, which we believe is largely because of the presence of the land cover cues (individual variability is very high in the responses with the satellite images).
Our last exploratory analysis on the presence of the bistable perception showed that 70.4% of participants experienced switches between convex and concave forms at least once, but altogether only around 4% of the time. There are various limitations about this observation. First of all, this information is based on self-reporting and self-reported measures should be taken with some caution. Nevertheless, our participants reported that they experienced bistable perception more with the SRMs; and this suggests that the photographic information does ‘interfere’ with the perception. In other words, presence of land cover cues might help ‘stabilizing’ the perception. Despite the reported switching, the landform identification accuracy with the SRMs is very low (2%) and participant confidence is very high; thus, one can speculate that experiencing bistable perception did not lead to considerable improvement in the landform identification task (valleys or ridges) that our participants solved. A future study controlling specifically for the effects of bistable perception on the TRE with different map types could confirm this speculation.
5. Conclusions and outlook
The TRE is an interesting perceptual illusion which can negatively affect photo/image-interpretation tasks, or simply confuse map readers about the landforms. Thus it can be detrimental to the usability and usefulness of 3D geospatial displays (Çöltekin, Lokka, and Zahner Citation2016). In this study, we contribute towards understanding this illusion better, and how various factors (such as photographic cues/texture, color, experience levels of the participants) contribute to its prevalence. With this paper, we mainly show that those who are able to bypass the illusion are mostly making use of the photographic cues, and are mostly people experienced in using satellite images. This new empirical evidence helps us caution the expert users to be self-aware in their communications when interpreting the landforms based on satellite images. The SRMs can also lead to this illusion, and, with the SRMs, the illusion is strong irrespective of expertise levels. However, SRMs are relatively easy to control, given that we can control the light direction. With this study, we further demonstrate that the global convexity bias and bistable perception phenomena that were demonstrated with abstract stimuli in earlier perceptual studies are replicated with terrain perception in SRMs. Thus, we demonstrate that cartography and remote sensing researchers can benefit from (and contribute to) perceptual psychology studies and such interdisciplinary work offers new knowledge to both communities. Finally, understanding what contributes to this illusion (which adds to the perceptual complexity of maps and map-like displays) might help with finding better-informed solutions, and improve the map-use experience of everyone with SRMs and satellite images. As a next step, informed by this study, it would be possible to examine how well the existing solutions (correction methods) to this perceptual problem with satellite images work; for example, if we can correct for the terrain reversal yet preserve the land cover cues, or if the proposed solutions work equally well for all users. Similarly, it would be valuable to reflect on how various depth cues (other than shading and shadows), or use of labels, and similar design solutions might help against the TRE. Such efforts would strengthen our findings to arrive at practicable design guidelines.
Acknowledgements
We are grateful to all our participants for their patient collaboration as well as the reviewers for their valuable time and intellectual effort.
Disclosure statement
No potential conflict of interest was reported by the authors.
ORCID
Arzu Çöltekin http://orcid.org/0000-0002-3178-3509
Julien Biland http://orcid.org/0000-0002-2977-5577
Additional information
Funding
References
- Allen, R. C., and M. L. Rubin. 1981. “Chromostereopsis.” Survey of Ophthalmology 26 (1): 22–27. doi:10.1016/0039-6257(81)90121-1.
- Bernabé-Poveda, M.-A., and A. Çöltekin. 2015. “Prevalence of the Terrain Reversal Effect in Satellite Imagery.” International Journal of Digital Earth 8 (8): 640–655. doi:10.1080/17538947.2014.942714.
- Bernabé-Poveda, M.-A., I. Sánchez-Ortega, and A. Çöltekin. 2011. “Techniques for Highlighting Relief on Orthoimaginery.” Procedia – Social and Behavioral Sciences 21: 346–352. doi:10.1016/j.sbspro.2011.07.028.
- Biland, J., and A. Çöltekin. 2017. “An Empirical Assessment of the Impact of the Light Direction on the Relief Inversion Effect in Shaded Relief Maps: NNW is Better than NW.” Cartography and Geographic Information Science 44 (4): 358–372. doi:10.1080/15230406.2016.1185647.
- Brewster, D. 1847. “On the Conversion of Relief by Inverted Vision.” Transactions of the Royal Society of Edinburgh 15 (4): 657–662. doi: 10.1017/S0080456800030234
- Brychtova, A., and A. Çöltekin. 2017. “Calculating Color Distance in Choropleth Maps with Sequential Colors – A Case Study with Color Brewer 2.0.” Kartographische Nachrichten 2/2017: 53–60.
- Çöltekin, A., I.-E. Lokka, and M. Zahner. 2016. “On the Usability and Usefulness of 3D (Geo)visualizations – A Focus on Virtual Reality Environments.” In International Archives of the Photogrammetry, Remote Sensing and Spatial Information Sciences, Prague, Vol. XLI-B2, 387–392. doi:10.5194/isprs-archives-XLI-B2-387-2016.
- Field, A. P. 2009. Discovering Statistics Using SPSS. 3rd ed. London: SAGE Publications.
- Gerardin, P., M. de Montalembert, and P. Mamassian. 2007. “Shape from Shading: New Perspectives from the Polo Mint Stimulus.” Journal of Vision 7 (11): 13. doi:10.1167/7.11.13.
- Gil, M. L., M. Arza, J. Ortiz, and A. Ávila. 2014. “DEM Shading Method for the Correction of Pseudoscopic Effect on Multi-Platform Satellite Imagery.” GIScience & Remote Sensing 51 (6): 630–643. doi:10.1080/15481603.2014.988433.
- Gregory, R. L. 1997. “Knowledge in Perception and Illusion.” Philosophical Transactions of the Royal Society B: Biological Sciences 352 (1358): 1121–1127. doi:10.1098/rstb.1997.0095.
- Hill, H., and V. Bruce. 1994. “A Comparison Between the Hollow-Face and ‘Hollow-Potato’ Illusions.” Perception 23 (11): 1335–1337. http://www.perceptionweb.com/abstract.cgi?id=p231335. doi: 10.1068/p231335
- Hill, H., and A. Johnston. 2007. “The Hollow-Face Illusion: Object-Specific Knowledge, General Assumptions or Properties of the Stimulus?” Perception 36 (2): 199–223. doi:10.1068/p5523.
- Imhof, E. 1967. “Shading and Shadows.” In Cartographic Relief Representation, edited by H. J. Steward, Vol. 2007, 159–212. Berlin: Walter de Gruyter GmbH & Co KG.
- Jenny, B. 2010–2018. “Terrain Sculptor. A Specialized Application for the Generalization of Terrain Models for Relief Shading.” Accessed January 5, 2018. http://terraincartography.com/terrainsculptor/.
- Kleffner, D. A., and V. S. Ramachandran. 1992. “On the Perception of Shape from Shading.” Perception & Psychophysics 52 (1): 18–36. http://www.ncbi.nlm.nih.gov/pubmed/1635855. doi: 10.3758/BF03206757
- Kornmeier, J., and M. Bach. 2006. “Bistable Perception—Along the Processing Chain from Ambiguous Visual Input to a Stable Percept.” International Journal of Psychophysiology 62 (2): 345–349. doi:10.1016/j.ijpsycho.2006.04.007.
- Langer, M. S., and H. H. Bülthoff. 2001. “A Prior for Global Convexity in Local Shape-from-Shading.” Perception 30 (4): 403–410. http://www.kyb.tue.mpg.de/publications/pdfs/pdf1546.pdf. doi: 10.1068/p3178
- Lillesand, T. M., R. W. Kiefer, and J. W. Chipman. 2004. Remote Sensing and Image Interpretation. 5th ed. New Jersey: John Wiley.
- Liu, B., and J. T. Todd. 2004. “Perceptual Biases in the Interpretation of 3D Shape from Shading.” Vision Research 44 (18): 2135–2145. doi:10.1016/j.visres.2004.03.024.
- Mamassian, P. 2004. “Impossible Shadows and the Shadow Correspondence Problem.” Perception 33 (11): 1279–1290. doi: 10.1068/p5280
- Mamassian, P., and M. S. Landy. 1998. “Observer Biases in the 3D Interpretation of Line Drawings.” Vision Research 38 (18): 2817–2832. http://www.ncbi.nlm.nih.gov/pubmed/9775328. doi: 10.1016/S0042-6989(97)00438-0
- McNemar, Q. 1947. “Note on the Sampling Error of the Difference Between Correlated Proportions or Percentages.” Psychometrika 12: 153–157. doi:10.1007/BF02295996.
- Rudnicki, W. 2000. “The New Approach to the Relief Shading Applied in Satellite Image Maps.” In Proceedings of High Mountain Cartography, KB 18, 105–106.
- Saraf, A. K., J. D. Das, B. Agarwal, and R. M. Sundaram. 1996. “False Topography Perception Phenomena and its Correction.” International Journal of Remote Sensing 17 (18): 3725–3733. doi:10.1080/01431169608949180.
- Saraf, A. K., P. Ghosh, B. Sarma, and S. Choudhury. 2005. “Cover: Development of a New Image Correction Technique to Remove False Topographic Perception Phenomena.” International Journal of Remote Sensing 26 (8): 1523–1529. doi:10.1080/0143116031000101648.
- Schröder, H. 1852. “Ueber eine optische Inversion mit freiem Auge.” Annalen Der Physik Und Chemie 163 (10): 306–312. doi:10.1002/andp.18521631009.
- Shcherbakova, N. N., V. V. Beletskij, and V. V. Sazonov. 1999. “Stabilization of Heliosynchronous Orbits of an Earth’s Artificial Satellite by Solar Pressure.” Koheskie Issle-dovaniia, Tom 37 (4): 417–427.
- Straumann, R. K., A. Çöltekin, and G. Andrienko. 2014. “Towards (Re)constructing Narratives from Georeferenced Photographs Through Visual Analytics.” The Cartographic Journal 51 (2): 152–165. doi:10.1179/1743277414Y.0000000079.
- Sun, J., and P. Perona. 1998. “Where is the Sun?” Nature Neuroscience 1 (3): 183–184. doi:10.1038/630.
- Toutin, T. 2006. Encyclopedia of Analytical Chemistry, edited by R. A. Meyers. Chichester: John Wiley. doi:10.1002/9780470027318.
- Wichmann, F. A., L. T. Sharpe, and K. R. Gegenfurtner. 2002. “The Contributions of Color to Recognition Memory for Natural Scenes.” Journal of Experimental Psychology 28 (3): 309–320. doi:10.1037//0278-7393.28.3.509.
- Wood, J. 2009–2018. “Landserf. A Freely Available Geographical Information System (GIS) for the Visualisation and Analysis of Surfaces.” Accessed January 5, 2018. http://www.landserf.org/.
- Wu, B., H. Li, and Y. Gao. 2013. “Investigation and Remediation of False Topographic Perception Phenomena Observed on Chang’E-1 Lunar Imagery.” Planetary and Space Science 75: 158–166. doi:10.1016/j.pss.2012.10.018.