
 ?Mathematical formulae have been encoded as MathML and are displayed in this HTML version using MathJax in order to improve their display. Uncheck the box to turn MathJax off. This feature requires Javascript. Click on a formula to zoom.
ABSTRACT
Worldwide, forest degradation is a serious environmental issue, and in Pakistan, forest wealth is depleting at the highest rate in South Asia. To ensure sustainable development goals of environmental stewardship, social development and economic growth, a sound monitoring and regulatory mechanism is essential for tracking forest cover changes. This study aims to quantify the decline of forest reserves and associated temperature variations in a relatively unexplored biodiversity hotspot of Islamabad, Margalla Hills National Park (MHNP). Imagery acquired by Landsat TM (Thematic Mapper) for the year 1992, 2000 and 2011 are used to assess the spatial and temporal changes occurred over the last two decades (from 1992 to 2011). A robust hybrid-classification routine is implemented to monitor the changes in forest cover and ANOVA along with Tukey’s HSD (Honestly Significant Difference) test is used to test the significance of temperature variation associated with a shift in land cover classes. The results showed a significant growth in settlements, agricultural area and barren soil whereas water body, lower vegetation, scrub and pine forest are diminishing. In both decades, the temperature alteration associated with a change in land cover classes are statistically significant (confirmed by ANOVA and Tukey’s HSD tests) for most of the land use/land cover classes. Based on these findings, this study concludes that forests are dwindling at MHNP and the degrading condition of the forest is below par and necessitates the promotion of conservation practices to minimize ecological disturbances.
1. Introduction
Forests as renewable natural resources are the most potential sources of wealth that provide various economic, social and environmental benefits (Haque, Murty, and Shyamsundar Citation2011). Forests host most of the earth’s animal and plant species and play a crucial role in the balancing of an ecosystem (Peh et al. Citation2014). Forests ecosystem provide food, medicines to benefit humankind and is a major sink of carbon dioxide (CO2) emissions, thus plays an essential role in regulating global weather (Chiesi et al. Citation2005; UNFCCC Citation2009; Baccini et al. Citation2012; Chen et al. Citation2016). According to UNDP, at least 25% of the land should be under forest for a healthy balance economy of a country (FAO Citation2012). Because of its prime importance, the policy-makers are enforcing policies and conventions to protect forests, sustain life and earth environment.
The world’s forest covering areas are shrinking at an alarming rate because of unsustainable logging and clearing ground for agriculture and settlement purposes (Hansen et al. Citation2013; IPCC Citation2013). Every year, the world is losing about 13–15 million hectares of forests due to deforestation (Chakravarty et al. Citation2012; FAO Citation2012). Scientists project that if deforestation continues at the current alarming rate, in the next 100 years, the entire world forests will be finished. The decline in forests is considered the major reason for climate change as it is a major natural sink, second only to oceans in their ability to minimize atmospheric carbon dioxide (CO2) by sequestering it in photosynthesis (Klein and Perkins Citation1987; Allen et al. Citation2010; Ghasemi, Sahebi, and Mohammadzadeh Citation2013). Large-scale conversion of forested land to other land covers results in climate warming (Nobre, Sellers, and Shukla Citation1991). Scientists report that the forests can store up to 1.5 metric tons of carbon per hectare per year (Gough et al. Citation2008). The world forests lock more than 1 × 10¹⁵ metric tons of carbon in biomass, detritus and soil (Dixon et al. Citation1994). Deforestation annually releases 1400–2000 teragrams of carbon into the atmosphere which equals 17–25% of global fossil fuel emissions every year (Ryan et al. Citation2007). The hike in CO2 concentration has led to the global temperature rise and has threatened the world environment (Fearnside Citation1996; Hansen et al. Citation2006). Intergovernmental Panel on Climate Change (IPCC) estimates a 5.2–9.5°F (2.9–5.3°C) increase in the Earth’s average surface temperature by the year 2100 (Nakicenovic and Swart Citation2000). This alarming rate has stirred concern among scientists world over to conduct researches on the decline of forest reserves, and have driven governments, regulative agencies and environmental protection authorities to frame regional and global policies (Chakravarty et al. Citation2012; FAO Citation2012; IPCC Citation2013).
In Pakistan, the forest covered area is not more than 5% of the total land (IUCN Citation2005; Shahbaz, Ali, and Suleri Citation2007). Majority of the country forests are located in Khyber Pakhtunkhwa (a province in the north and western part) which accounts for over 40% of national forest wealth and is continuously dropping over the years (IUCN Citation2005). Pakistan is reported to have the highest rate of deforestation in South Asia (World Bank Citation2013). This alarming situation demands detailed research efforts to quantify the decline of forest reserves. Various researchers have attempted to study forest attributes using old conventional techniques which are based on human observations and have rarely employed latest technologies like satellite remote sensing. As such, conventional methods are costly, more time consuming, demand large human resources and lack continuous spatial coverage, which hardly help the government in enforcing regulations and policies to mitigate deforestation. Remote sensing (especially satellite remote sensing) offers an effective alternative to monitor forests wealth at a low cost and more precisely to quantify forest cover changes at different scales. Moreover, using remote sensing technology, results can be reproduced. Remote sensing applications in forestry not only reduce the survey crew and cost, but can observe areas which are otherwise inaccessible by conventional approaches. Thus, remote sensing has emerged as a vital decision-support tool for forest managers to monitor forests over large areas at reparative intervals.
Several researches clearly validate the potential of integrating high resolution multi spectral remote sensing data and aerial photography for observing land pattern changes (Green, Kempka, and Lackey Citation1994; Shalaby and Tateishi Citation2007; Hansen et al. Citation2008). By means of remotely sensed data, forest structure has been effectively modeled in the state of Nepal over a span of 14 years (Gautam, Webb, and Eiumnoh Citation2002). In Changbai Mountain range of China, changes made in forest cover due to management-induced activities have been successfully investigated using Landsat TM images (Li et al. Citation2006). Quantifying and exploring vulnerability in forests of Kenya indicated their decline with a subsequent increase in agricultural parcels (Wachiye, Kuria, and Musiega Citation2013). Choropleth maps of the forested area in Pakistan have been formulated which highlight the dwindling coniferous forest over the last two decades (Ahmad et al. Citation2012).
For the efficient management of forest resources, and in particular, deforestation, forest cover change must be monitored at both the regional and global scale. National inventories and international treaties (United Nations Framework Convention on Climate Change (UNFCCC), REDD+, Kyoto Protocol, etc.) also demand an accurate assessment of forest attributes at large scale which is possible through the analysis of remote sensing imagery. Hence, this study aims to monitor forest pattern on Margalla hills from 1992 to 2011 using visible to short-wave-infrared (VSWIR) data of Landsat TM sensor. Besides tracking land cover changes, the impact of class shifts on surface temperature is also assessed using thermal infrared (TIR) band of Landsat TM.
2. Materials and methods
2.1. Study area
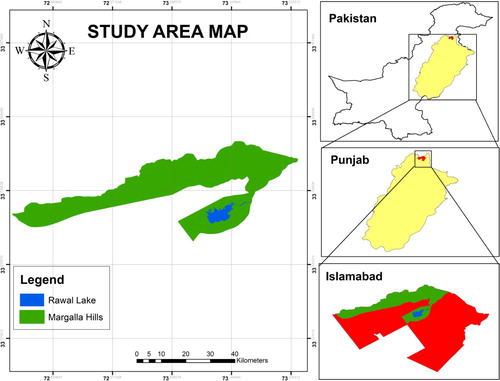
The study area is comprised of Margalla Hills and the adjacent Rawal Lake regions () of Islamabad, Pakistan. Margalla Hills National Park (MHNP: covers an area of 173.9 Sq. Km) is a hill range immediate north of Islamabad capital territory and is situated at the foothills of lesser Himalayan. MHNP, forming the northern boundary of the Potohar plateau is located between 33°40′01″–33°42′43″ N, 72°45′01″–72°52′32″E and is at an elevation varying from 1347 to 3907 feet above the mean sea level. MHNP was declared as a National Park in 1980 under Islamabad Wild Life Ordinance (Malik, Husain, and Benes Citation2003). The landscape is furrowed, rocky and mainly composed of limestone (Nasir and Akhter Citation1987). The weather is harsh in nature with hot summers and cold winters. In summer season (May and June), the temperature escalates up to 42°C, whereas in winter (months of December and January) the temperature falls below zero (Hussain Citation1986; Khalid et al. Citation2015). The Margalla Hills occurs at the far end of monsoon zone and the precipitation mostly falls in July and August (in these months the mean rainfall is 254 mm). The mean relative humidity varies between 59% and 67% during monsoon period (Masroor Citation2011). The area is rich in plant biodiversity and hosts 616 species of flora. The dominant ecological zones are subtropical coniferous pine (evergreen) and subtropical deciduous scrub (deciduous) forests. The common plant species found in Margalla hills are Chir (Pinus roxburghii), Kao or Kahu (Olea ferruginea), Sanatha (Dodonaea viscosa), Phulai (Acacia modesta), Toot (Morus alba) and Shisham (Dalbergia sissoo). MHNP also provides shelter to a large number of animal biodiversity including 30 mammals, 27 fish, 21 amphibians and reptiles, 238 birds, 39 butterflies and several other invertebrate species (WWF Citation2009). MHNP inhabits 100,000 people dwelling in 37 small villages and hamlets. About 60% of the population residing in MHNP premises is practicing rain-irrigated agriculture and domesticating animals for milk and meat supply. Besides Sorghum, corn and wheat are the main crops of the area (WWF Citation2009).
Figure 1. Study area map showing Margalla Hills National Park and Rawal Lake.
2.2. Dataset and preprocessing
The datasets comprised of multispectral Landsat TM imagery for the year 1992, 2000 and 2011. The VSWIR bands of Landsat TM were used to categorize various land cover classes. Landsat TM TIR band for the same dates were acquired to compute land surface temperature (LST). The satellite imagery acquired was from a nearly identical time of the year (i.e. from 21 May 1992, 31 May 2000 and 5 June 2011). Besides satellite images, ground truth and ancillary data of maximum, minimum and average temperature were also acquired from the field and the Pakistan Meteorological Department (PMD), respectively.
Atmospheric correction was performed to eliminate atmospheric effects (such as Rayleigh scattering, Mie scattering, etc. which is the dominant atmospheric affect in Landsat TM) (Song et al. Citation2001) and the retrieval of normalized reflectance across different bands. This is necessary to carry out quantitative analysis and change detection with multi-temporal or multi-sensor data (Brunn et al. Citation2003).
Pixels of Landsat TM Level-1 data expressed as digital numbers (DNs) were radiometrically calibrated to retrieve absolute at-sensor Radiance (W m−2 sr−1 μm−1) using gain and bias values (see Equation (1)).(1)
(1)
where, ‘Lλ’ is the radiance pixel value, ‘DN’ is the digital number cell value, ‘gain’ is the gain value for a specific band and ‘bias’ is the bias value for a specific band.
Radiance was then converted to atmospherically corrected spectral Reflectance using the FLAASH (Fast Line-of-sight Atmospheric Analysis of Spectral Hypercubes) algorithm. Standard radiance rescaling factors for each band provided in the metadata were used. With initial visibility set to 40 km, a 2 band Kaufman-Tanre Aerosol retrieval method was used on a Tropospheric Aerosol model and a Tropical atmospheric model. Multispectral sensors (like Landsat TM) do not have appropriate bands to perform water retrieval but the average water amount was set to 1.096 atm-cm. The cirrus cloud masking was performed using wavelength range 1.55–1.75 µm.
The VSWIR bands of satellite images were then stacked and re-projected in Universal Transverse Mercator (UTM) and World Geodetic System (WGS) 1984. The study area (MNHP and Rawal Lake) were extracted from the images by subsetting the images using shapefile of the region of interest. The TIR bands were also cropped according to the size of the study area for the year 1992, 2000 and 2011.
2.3. Categorization of land cover classes and change detection
A classification procedure called hybrid maximum-likelihood routine was adopted to categorize the study area into various land cover classes and to assess the shift in forest cover. The hybrid classification encompasses the advantages of both supervised and unsupervised classification and is considered a robust routine (Kuemmerle et al. Citation2006; Li et al. Citation2013; Zhang et al. Citation2014). First, the subset images were subjected to unsupervised classification for spectral clustering and self-organization. In the spectral clustering, if a class of significant size was absent after unsupervised classification, a supervised routine was followed to add their signature. All the spectral signatures were then combined to form one signature file. The final signature file (ensuing both unsupervised and supervised classification) was then used to classify the entire image in different land use and land cover classes such as agricultural land, barren soil, coniferous forest, scrub forest, built-up area, lower vegetation and water body. The evaluation of classification results is an essential process in the procedure of satellite image classification to find the degree of accuracy. In doing so error/confusion matrices were used. This is the frequently employed approach for evaluating per-pixel classification (Lu and Weng Citation2007). To assess the accuracy of results, 120 random points (reference data) were created on the unclassified subset image. Confusion matrix was constructed for the three years and the points were given reference on the basis of best guess of their representative class. Classification was followed by post-classification procedures like vectorization, class extraction, merging and area calculation. To quantify the shift that has occurred in various classes, land cover maps for the three years (1992, 2000 and 2011) were overlaid and changed maps were generated to quantify the shift between the years from 1992 to 2000 and then 2000 to 2011.
2.4. ANOVA and Tukey’s HSD
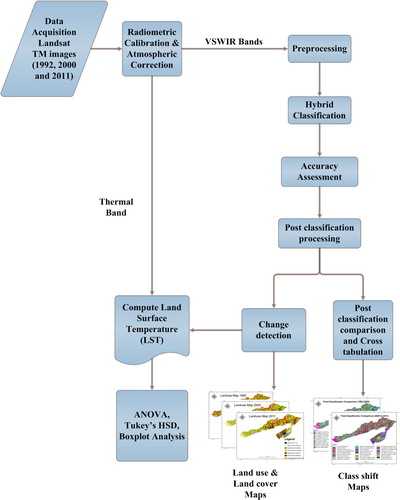
The statistical tests such as one-way analysis of variance (ANOVA) followed by Tukey’s HSD (Honest Significance Difference) were applied to the LST data retrieved from TIR band of Landsat TM. ANOVA was used to determine whether the temperature variance among various group means differs statistically. The null hypothesis stated that the variance of temperature means for all changed classes is the same, i.e. there is no significant difference between them. ANOVA was tested at confidence level of 99% (p < .01). Once it was established that spatial temperature means were statistically different for various classes, post hoc Tukey’s HSD tests were implemented for pairwise comparison to ascertain that altered (shift) classes were statistically different from their ancestor class (parent class). Pairwise comparisons for temperature were first made for the year 1992 and 2000 and then 2000 and 2011. The schematic flow diagram of the methodology followed for the research is shown in .
Figure 2. Schematic flow of the implemented methodology. Preprocessing included band stacking, reprojection and subsetting. And post-classification processing included reclassification (or recoding), vectorization of classes, class extraction, merging and geometry computation.
3. Results
3.1. Multi-temporal land covers classification
Based on hybrid classification of sensor data for the years 1992, 2000 and 2011, specifies the area (percentages and hectares) of various land use and land covers in thorough detail. In the year 1992, the lower vegetation was the dominant class enveloping an area of 5700 ha (equal to 29% of the total MHNP). This class encompassed range lands, shrubs, herbs and grass lands. Coniferous pine (composed of Pinus roxburghii) forest was the second major class having total area coverage of 5007 ha (occupying 25% of the total study site). Water bodies covered the rest of the area (594 ha) which was 3% of the total land (). In the year 2000, lower vegetation was again the dominating land cover class covering an area of 4398 ha (22% of the total area). The second major class was settlements with an area of 3524 ha (18% of the study area). The spatial extent of Water was 316 ha (2%-of the study area) and remained the lowest class in the year 2000. In 2011, lower vegetation covered an area of 4131 ha (21% of the total surface of MHNP) and was the major class. Next major classes were the settlements and the scrub forest covering 19% and 17% of land, respectively (– ).
Figure 3. Pie-charts showing percentage of area coverage of land cover classes on MHNP in 1992, 2000 and 2011.
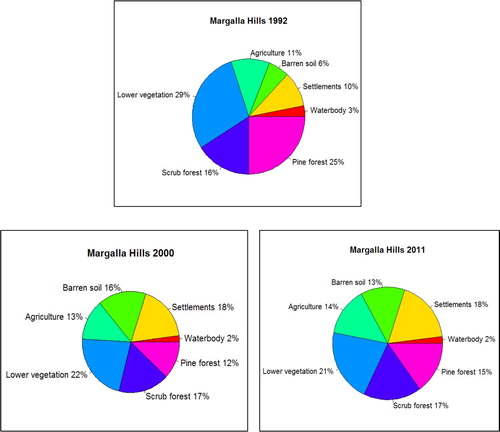
Figure 4. Land use and Land cover map of Margalla Hills National Park for the year 1992.
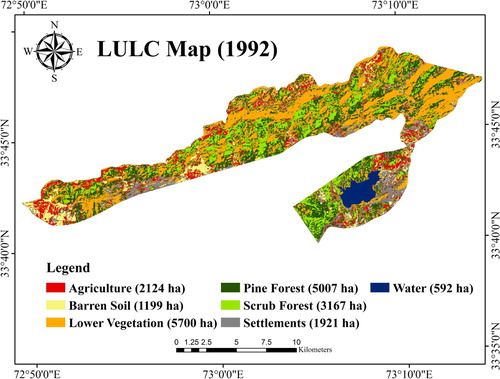
Figure 5. Land use and Land cover map of Margalla Hills National Park for the year 2000.
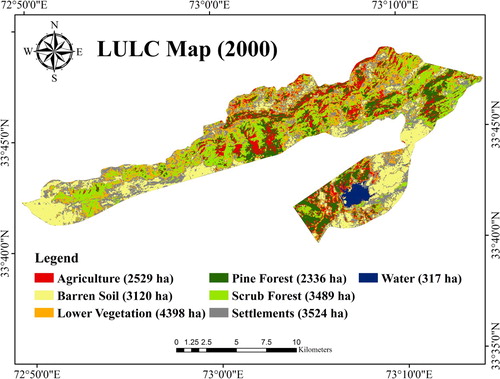
Figure 6. Land use and Land cover map of Margalla Hills National Park for the year 2011.

Table 1. The area coverage (both in hectare and percentage) of different land cover classes in MHNP for the year 1992, 2000 and 2011.
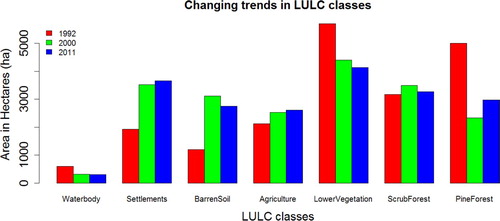
The changing trends in land use and land cover classes over the years are illustrated in . The built-up region and agricultural land consistently increased. While the graph of the water body and lower vegetation reveals a continuous decreasing trend from 1992 to 2011, for other LULC classes such as barren soil, scrub forest and pine forest, the pattern did not transform with uniformity from 1992 to 2000 and then from 2000 to 2011.
Figure 7. LULC changes in Margalla Hills from the year 1992–2011.
3.2. Temporal shifts in the LULC classes
The post-classification comparison between the years revealed spatial and temporal shifts among classes and also pointed out classes that are relatively stable over time (see and ). The major LULC classes which the forests transformed into were the agricultural land, barren soil and built-up areas. However, the drop in lower vegetation class contributed to an increase in forest class (i.e. lower vegetation shifted mainly to pine and scrub forest).
Figure 8. Post-classification comparison between the classified images of 1992 and 2000 presenting the shift among classes.
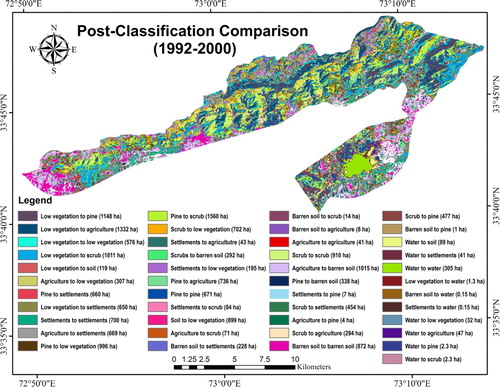
Figure 9. Post-classification comparison between the classified images of 2000 and 2011 presenting the shift among classes.
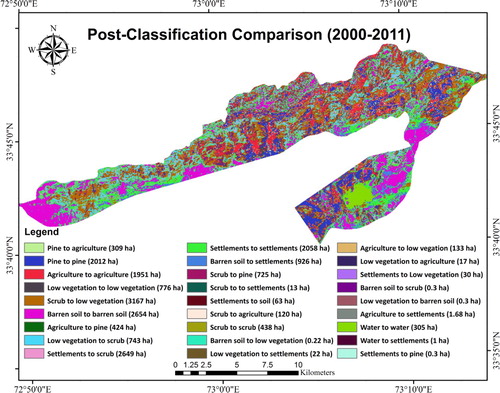
Considering the entire area covered by all the classes of MHNP in 1992, a total of only 22% remained unchanged in 2000 while 77% of the area was shifted to other classes (see ). This shift that occurred was a combined effect from all classes, i.e. 11.2% scrub forest area transformed while 21% of the change was contributed by Pine forest, etc. However, in the year 2011 in MHNP, the change occurred was 49%. An area of 10.2% out of the total land continued to exist as pine forest in the year 2011, while 1.78% transformed to other classes. Estimations revealed that 2.2% of Scrub forest persisted as so, while 20.4% shifted to other feature classes (see ).
3.3. Accuracy assessment and kappa statistics
The assessment of classification accuracy of the images for the years 1992, 2000 and 2011 was carried out to determine the quality of information derived from the data. The results attained through this method comprised of the overall classification accuracy report, Kappa statistics () and Cell report. The accuracy results indicated a high rate of classification accuracy that was 99.17%, 98.33% and 98.33% again for the years 1992, 2000 and 2011, respectively. Kappa accounts for all elements of the confusion matrix and excludes the agreement that occurs by chance. Consequently, it provides a more rigorous assessment of classification accuracy. The overall accuracy and Kappa statistics achieved for the classification of the images for 1992, 2000 and 2011 are reasonably acceptable in order to conduct the analysis and change detection.
Table 2. Overall classification accuracy and kappa statistics.
3.4. Change in temperature associated with class transition
The results of ANOVA (one-way analysis of variance) shows that the variances of the mean temperature of various classes were statistically significant (p = .000) indicating that the mean temperature of at least one group was statistically different (see ). Once the null hypothesis (i.e. classes mean temperatures do not differs from each other) was rejected, post hoc Tukey’s HSD was used for pairwise comparisons. The Tukey’s HSD reveals that the mean temperatures of changed classes are statistically different from their ancestor class in most cases between the years 1992–2000 and 2000–2011 (see and ).
Figure 10. Boxplots for temperature difference and graph of P-values for the change classes from 1992 to 2000.
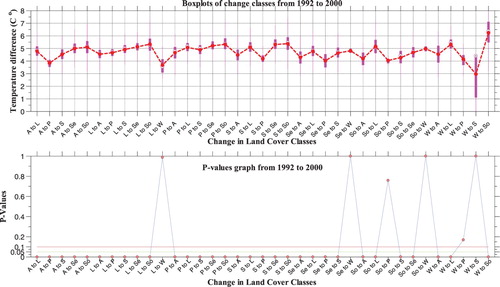
Figure 11. Boxplots for temperature difference and graph of P-values for the change classes from 2000 to 2011.
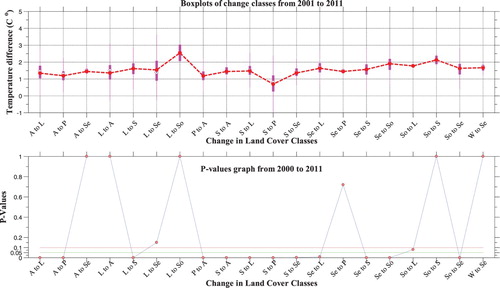
Table 3. Summary of ANOVA of the changed classes land surface temperature in the years 1992–2000 and 2000–2011.
The boxplots () reveals that from the year 1992 to 2000, the transition in classes such as Water to Agriculture (W to A), Scrub forest to Soil (S to So) show a wider range of temperature differences. Some classes such as Settlements to Water (Se to W), Soil to Pine (So to P) and Soil to Water (So to W) show very little range of temperature difference. For the majority of the classes, the P-values resulting from the Tukey’s HSD were statisticaly significant (p < 0.05).This means that for these classes the temperature change is statistically significant with the transition in cover classes. The pairwise comparison of few classes such as transitions from Soil to Pine (So to P) and Water to Pine (W to P) rendered p-values higher than 0.05, which means that the mean temperature difference of these transitions classes is not statistically significantly different from their parent/ancestor classes. Low vegetation to Water (L to W), Settlements to Water (Se to W), Soil to Water (So to W) and Water to Scrub (W to S) forest also yielded relatively higher p-values.
For the year 2000–2011, the boxplots show that some transitions such as Low vegetation to Agriculture (L to A), Scrub to Pine (S to P) and Low vegetation to Settlements (L to Se) cover a wide range of temperature differences (see ). Other classes such as Settlements to Pine (Se to P) and Soil to Low Vegetation (So to L) had minimum ranges of temperature difference. The p-values for majority of the classes were statiscally significant () except a few, such as Soil to Scrub (So to S), Water to Settlements (W to Se) and Low vegetation to Agriculture (L to A).
4. Discussion
4.1. Transitions in cover classes
In Pakistan, the forests cover is over an area of nearly 4.6 million hectares which is almost 2% of the total land (Rich Citation2013). The forest cover is continuously dropping over the years and the country is regarded to have a very high percentage of annual deforestation as a function of the forest area (Allen and Barnes Citation1985). Since the creation of Pakistan (1947), about 61,000 ha of the valuable forested land has been deforested. There are many factors responsible for the decline of forest resources, one of the principal reasons influencing it is a competitive and flourishing world economy. Although the forest reserves of Pakistan are meager but they contribute considerably to the economy (Triana et al. Citation2013). Margalla Hills provide fodder, timber, non-timber forest products (NTFPs) and wood for fuel (Haque, Murty, and Shyamsundar Citation2011). The findings specified in the cross-tabulation (see and ) summarized the changes and shifts in land cover classes in a more simplistic way. In Margalla Hills, the major transitions in land cover classes happened between the years 1992–2000. During this period, 77% of the total land of transformed to other classes while only 22% of the area remained unchanged. From 2000 to 2011, the proportion of changed and unchanged area was 49% and 51%, respectively.
Table 4. Summary of the class shift from the year 1992 to 2000.
Table 5. Summary of the class shift from the year 2000 to 2011
Scrubs forest is one of the dominating land cover class in MHNP. Some scrub forests are perennial (evergreen) while others are deciduous or semi-evergreen. Margalla Hills mainly populate the deciduous type of scrubs which shed their foliage and thrive well in tropical wet and dry climate. These forests shed leaves and are adaptive to the scarcity of water in long dry seasons (Khalid et al. Citation2015). In this study, the scrub forest initially showed an increase of 10% from the year 1992 to 2000 followed by a decrease of 6% in the next decade (from 2000 to 2011). Since the year 1992, 13.9% of the land occupied by scrub forest transformed to other classes while 10.4% sustained as previous. The clearance of scrub forest could be attributed to the spread of settlements, timber mafia, population boost and urbanization. A prevailing practice in MHNP is the removal of strips of forest to grow crops by farmers (Khalid et al. Citation2015). The periodic wild forest fires which turn down the vegetation to ashes could be another cause possible for the reduction in forests of MHNP (PARC Citation2009).
Subtropical pine forest is another major class in the hills. The chir pine (Pinus roxburghii) is the most abundant species growing at an elevation of 1000 m above the sea level. The pine forest class declined by 53% between the years 1992 and 2000. In the year 1992, the pine forest occupied a total land of 5007 ha that colossally declined to 2336 hectares in the year 2000. Within the premises of MHNP, 21% of the total pine forest changed to other land covers while 3.4% continued as pine forest class. The forest may have been influenced by prolonged drought, inclement weather and climate conditions, when there is no downpour for months and temperature soars up to 45°C (Sykes and Prentice Citation1996; Zonneveld et al. Citation2009; Lindner et al. Citation2010). Extensive cum recurrent cattle grazing and fuel wood retrieval by the local communities have warped the vascular plants (higher plants) to non-vascular plants or bushes (Shafiq et al. Citation1997). The clearing of valuable pine forest for agriculture practice could also be the reason of decline in pine forests (Khalid et al. Citation2015). Cement industries exploit Margalla Hills for the acquisition of limestone and shale and hence, contribute to deforestation (Khan Citation2003; Iqbal, Khan, and Malik Citation2013). The outcome of this study is in line with the findings of Sykes and Prentice (Citation1996) and Lindner et al. (Citation2010). Between 2000 and 2011, an increasing trend (27% increase) was observed in the pine forest. Estimations let out that 10.2% maintained as so, while 1.78% shifted to other classes. The increase in pine forest acreage between 2000 and 2011 could be accredited to the better management activities such as ban on cutting pine trees for fuel wood and timber purposes. The plantation campaign of pine forest in MHNP could also be a reason for the increase in pine forest area.
Over a period of two decades, a total of 13% increase was observed in agriculture area in Margalla Hills. Initially, there was 9% increase between the years 1992 and 2000, whereas after a period of 11 years (from 2000 to 2011), the agriculture area increased by 4%. About 60% of the population living in MHNP is dependent on agriculture for their livelihood (Ayaz Citation2005). The inhabitants are involved in agricultural practices and herding their cattle in the park area. Expansion of road network is one of the many reasons for the burgeoning agriculture in the study site. Roads provide farmers an easy access to encroach and fragment the forests for growing crops (Khalid et al. Citation2015).
With increasing human population and migration towards the cities, the demand for new settlements has risen in Islamabad and its surrounding areas. This unplanned urbanization has adversely affected the ecosystem of MHNP. Just in one decade (1992–2000), the settlements class increased by 83%, from 1921 ha to 3524 ha. In the next decade (2000–2011), the settlements class increased further by 4% (reached to an area of 3656 hectares). The surging built-up area could be associated with the ever-increasing population and conurbation, which led to the development of housing projects and residential colonies to accommodate them. Other setups include road networks, recreational pursuits (i.e. Daman-e-Koh, Lake View Park, PirSuhawa and Said-pur village), industrial and commercial units. These developments happened at the cost of forest decline, shrinking water bodies and increase in barren soil.
Lower vegetation in MHNP shows a decline of 22% from the year 1992 to 2000. In 2011, it further dropped by 6%. The locals are relying on MHNP for herding their livestock; hence, overgrazing could be a major reason behind the decline in lower vegetation. Wild fires also cause rapid desertification of range lands to the barren soil. Apart from overgrazing and forest fires, urban sprawl and construction of settlements are other factors causing the decline in lower vegetation acreage.
The 160% upsurge in Barren soil could be linked to anthropogenic activities like haphazard bush burning, stone crushing, over grazing of pastures, fuel wood collection and wild fires. Much of the abandoned land was then transformed into settlements after year 2000. The class thus exhibited a rise of 11% from 2000 to 2011.
In the year 1992, the water body (Rawal Lake) occupied an area 594 ha which shrank to 316 ha in the year 2000. The class further dropped to 311 ha in the year 2011. Rawal Lake is the chief supplier of water to the twin cities, supplying 23 Million Gallons per Day (MGD) for drinking and domestic usage to Rawalpindi city, and a limited amount to Islamabad capital for irrigational purposes (Hashmi, Qaiser, and Farooq Citation2012). The regime of water in Rawal Lake has altered because of the deforestation and rapid urban expansion in the catchment areas. The recharging capacity of the aquifer in Islamabad and Rawalpindi is adversely affected by the formation of road network, pavements and other structures. The concrete surfaces restrict infiltration that eventually affects the surface and subsurface hydrology of the region. The storage capacity of Rawal Lake that used to be 47,230 ha in the year 1960 has been dropped to approximately 35%, owing to the process of sedimentation (IUCN Citation2005).
4.2. Temperature change associated with the class shift
Different land cover classes have a different temperature, due to evapotranspiration, forests and vegetated areas are always cooler than the surrounding barren soil and rocky grounds. The temperature drift associated with temporal transitions of land cover classes are tested by analyzing the spatial variation of LST derived from a thermal band of Landsat TM. The temporal images of TIR belong to the nearly identical time of the year from the years 1992,2000 and 2011 (). LST was derived from 21 May 1992, 31 May 2000 and 5 June 2011. It is assumed that the temperature remained similar during this time. The air temperature data recorded by PMD confirmed that the average air temperature at the time of image acquisition was nearly equal (see ). So, it is hypothesized that if there is any change in class temperature that would be associated with the class shift over a period of two decades.
Table 6. Summary of air temperature recorded for the month at which the images were acquired.
The majority of changed classes show a considerable variation in temperature (see boxplot of and ) and the difference in mean temperature are statistically significant (see p-value plot of and ). The changed classes such as Agriculture to Low vegetation (A to L), Agriculture to Pine (A to P), Low vegetation to Scrub (L to S), Pine to Agriculture (P to A), Scrub to Agriculture (S to A), Scrub to Low vegetation (S to L), Scrub to Pine (S to P), Scrub to Settlements (S to Se), Settlements to Low vegetation (Se to L), Settlements to Scrub(Se to S, Settlements to Soil (Se to So), Soil to Settlements (So to Se) all yielded results that were statistically significant (p < .05) in both decades. This reveals that the temperature change is statistically significantly related to the changed classes. However, some classes in 1992–2000 such as Settlements to Water (Se to W), Soil to Pine (So to P) and Soil to Water (So to W) and a few classes in 2000–2011 such as Settlements to Pine (Se to P) and Soil to Low Vegetation (So to L) showed very little range of temperature differences because of less spatial extent covered by the classes, i.e. the areas covered by the shifted classes were too small to give statistically significant temperature change with the classes. The switch of vegetation/forest cover class to other land cover types yielded a drift in temperature which is significantly different from their parent class. Previous research also found that deforestation and clearing of vegetation lead to an increase in temperature and dust storms (Ellis, Taylor, and Masood Citation1994) which is in line with the finding of this study. It has been established that changes in temperature and soil moisture is a critical determinant of vegetation spatial distribution (Lookingbill and Urban Citation2003). Sea and Whitlock (Citation1995) have developed an inventory of the plant species and climatic history of a region, which suggested that vegetation flux has been influenced greatly by temperature variability over the last 14,000 years. Research focusing on the relationship between LST and vegetation abundance shows that the surface radiant temperature response is a function of changes in soil moisture content and vegetation cover. LST increases in sparsely vegetated areas such as urban areas (Weng, Lu, and Schubring Citation2004).
5. Conclusion
Earth observation data provides a sound monitoring and regulatory mechanism for tracking forest cover changes and associated temperature variations. The present study is conducted in a relatively unexplored biodiversity hotspot and reveals that land cover and land use practices have altered in MHNP since the last two decades. The transitions in land use and land cover classes have influenced the LST and are significantly different from their ancestor cover class. Based on the spatio-temporal analysis of earth observation data, this study concluded that the forest reserves are dwindling, whereas built-up and agriculture land is growing. The expansion of agriculture and settlements has subsequently affected the forest cover and water bodies. The findings of this study highlight the needs to conserve forest resources by controlling human interference in MHNP and its surrounding areas. Land use/cover must be monitored using continuous spatially explicit earth observation data and forest restoration activities should be initiated wherever needed. To ensure sustainable forest management, proper planning for urbanization is essential and areas with less ecological importance must be utilized for domestic, industrial and commercial settlements.
Acknowledgement
We thankfully acknowledge Pakistan Meteorological Department (PMD) for providing us data, World Wildlife Fund (WWF) for sending us their report on MHNP and Environment department of Capital Development Authority (CDA) for providing information vital to conduct this research.
Disclosure statement
No potential conflict of interest was reported by the authors.
References
- Ahmad, S. S., Q. Abbasi, R. Jabeen, and M. T. Shah. 2012. “Decline of Forest Cover in Pakistan: A GIS Approach.” Pakistan Journal of Botany 44: 511–514.
- Allen, J. C., and D. F. Barnes. 1985. “The Causes of Deforestation in Developing Countries.” Annals of the Association of American Geographers 75: 163–184. doi: 10.1111/j.1467-8306.1985.tb00079.x
- Allen, C. D., A. K. Macalady, H. Chenchouni, D. Bachelet, N. McDowell, M. Vennetier, T. Kitzberger, et al. 2010. “A Global Overview of Drought and Heat-induced Tree Mortality Reveals Emerging Climate Change Risks for Forests.” Forest Ecology and Management 259: 660–684. doi: 10.1016/j.foreco.2009.09.001
- Ayaz, S. 2005. “Ecological Zonation and Identification of core biodiversity zones in Margallah Hills National Park.” M. Phil thesis., Dept. of Biological Sciences, Quaid-e-Azam University, Islamabad.
- Baccini, A., S. J. Goetz, W. S. Walker, N. T. Laporte, M. Sun, D. Sulla-Menashe, J. Hackler, et al. 2012. “Estimated Carbon Dioxide Emissions From Tropical Deforestation Improved by Carbon-density Maps.” Nature Climate Change 2: 182–185. doi: 10.1038/nclimate1354
- Brunn, A., C. Fischer, C. Dittmann, and R. Richter. 2003. “Quality Assessment, Atmospheric and Geometric Correction of Airborne Hyperspectral HyMap Data.” Proceedings 3rd EARSeL Workshop on Imaging Spectroscopy, Herrsching, 13–16 May. ISBN 2-908885-26-3
- Chakravarty, S., S. K. Ghosh, C. P. Suresh, A. N. Dey, and G. Shukla. 2012. “Deforestation: Causes, Effects and Control Strategies.” In Global Perspectives on Sustainable Forest Management, edited by C. A. Okia, 978–953. InTech.
- Chen, Y., G. Luo, B. Maisupova, X. Chen, B. M. Mukanov, M. Wu, B. T. Mambetov, J. Huang, and C. Li. 2016. “Carbon Budget from Forest Land use and Management in Central Asia During 1961-2010.” Agricultural and Forest Meteorology 221: 131–141. doi: 10.1016/j.agrformet.2016.02.011
- Chiesi, M., F. Maselli, M. Bindi, L. Fibbi, P. Cherubini, E. Arlotta, G. Tirone, G. Matteucci, and G. Seufert. 2005. “Modelling Carbon Budget of Mediterranean Forests Using Ground and Remote Sensing Measurements.” Agricultural and Forest Meteorology 135: 22–34. doi: 10.1016/j.agrformet.2005.09.011
- Dixon, R. K., A. M. Solomon, S. Brown, R. A. Houghton, M. C. Trexier, and J. Wisniewski. 1994. “Carbon Pools and Flux of Global Forest Ecosystems.” Science 263: 185–190. doi: 10.1126/science.263.5144.185
- Ellis, S., D. M. Taylor, and K. R. Masood. 1994. “Soil Formation and Erosion in the Murree Hills, Northeast Pakistan.” CATENA 22: 69–78. doi: 10.1016/0341-8162(94)90066-3
- FAO. 2012. State of the World’s Forests. Rome: FAO.
- Fearnside, P. M. 1996. “Amazonian Deforestation and Global Warming: Carbon Stocks in Vegetation Replacing Brazil’s Amazon Forest.” Forest Ecology and Management 80: 21–34. doi: 10.1016/0378-1127(95)03647-4
- Gautam, A. P., E. L. Webb, and A. Eiumnoh. 2002. “GIS Assessment of Land use/Land Cover Changes Associated with Community Forestry Implementation in the Middle Hills of Nepal.” Mountain Research and Development 22: 63–69. doi: 10.1659/0276-4741(2002)022[0063:GAOLUL]2.0.CO;2
- Ghasemi, N., M. R. Sahebi, and A. Mohammadzadeh. 2013. “Biomass Estimation of a Temperate Deciduous Forest Using Wavelet Analysis.” IEEE Transactions on Geoscience and Remote Sensing 51: 765–776. doi: 10.1109/TGRS.2012.2205260
- Gough, C. M., C. S. Vogel, H. P. Schmid, and P. S. Curtis. 2008. “Controls on Annual Forest Carbon Storage: Lessons from the Past and Predictions for the Future.” Bioscience 58: 609–622. doi: 10.1641/B580708
- Green, K., D. Kempka, and L. Lackey. 1994. “Using Remote Sensing to Detect and Monitor Land-cover and Land-use Change.” Photogrammetric Engineering and Remote Sensing 60: 331–337.
- Hansen, M. C., P. V. Potapov, R. Moore, M. Hancher, S. A. Turubanova, A. Tyukavina, D. Thau, et al. 2013. “High-Resolution Global Maps of 21st-century Forest Cover Change.” Science 342: 850–853. doi: 10.1126/science.1244693
- Hansen, M. C., D. P. Roy, E. Lindquist, B. Adusei, C. O. Justice, and A. Altstatt. 2008. “A Method for Integrating MODIS and Landsat Data for Systematic Monitoring of Forest Cover and Change in the Congo Basin.” Remote Sensing of Environment 112: 2495–2513. doi: 10.1016/j.rse.2007.11.012
- Hansen, J., M. Sato, R. Ruedy, K. Lo, D. W. Lea, and M. Medina-Elizade. 2006. “Global Temperature Change.” Proceedings of the National Academy of Sciences 103: 14288–14293. doi: 10.1073/pnas.0606291103
- Haque, A. K. E., M. N. Murty, and P. Shyamsundar. 2011. Environmental Valuation in South Asia. City: Cambridge University Press.
- Hashmi, I., S. Qaiser, and S. Farooq. 2012. “Microbiological Quality of Drinking Water in Urban Communities, Rawalpindi, Pakistan.” Desalination and Water Treatment 41: 240–248. doi: 10.1080/19443994.2012.664721
- Hussain, M. 1986. Re-introduction of cheer pheasant in the Margalla Hills National Park. A report by World Wide Fund for Nature, Pakistan and Capital Development Authority, Islamabad.
- IPCC. 2013. “Climate Change 2013: The Physical Science Basis.” In Contribution of Working Group I to the Fifth Assessment Report of the Intergovernmental Panel on Climate Change, edited by T. F. Stocker, D. Qin, G.-K. Plattner, M. Tignor, S. K. Allen, J. Boschung, A. Nauels, Y. Xia, V. Bex, and P. M. Midgley, 1535–1536. Cambridge: Cambridge University Press.
- Iqbal, M. F., M. R. Khan, and A. H. Malik. 2013. “Land use Change Detection in the Limestone Exploitation Area of Margalla Hills National Park (MHNP), Islamabad, Pakistan Using geo-Spatial Techniques.” Journal of Himalayan Earth Sciences 46: 89–98.
- IUCN. 2005. Rapid Environmental Appraisal of Developments In and Around Murree Hills, Pakistan. Report of International Union of Conservation of Nature.
- Khalid, N., S. S. Ahmad, S. Erum, and A. Butt. 2015. “Monitoring Forest Cover Change of Margalla Hills Over a Period of Two Decades (1992-2011): A Spatiotemporal Perspective.” Journal of Ecosystem & Ecography, 6: 1–8.
- Khan, K. M. 2003. Impacts of Margalla Hills Crushing Plants on the Environment.
- Klein, R. M., and T. D. Perkins. 1987. “Cascades of Causes and Effects of Forest Decline.” Ambio, 16: 86–93.
- Kuemmerle, T., V. C. Radeloff, K. Perzanowski, and P. Hostert. 2006. “Cross-border Comparison of Land Cover and Landscape Pattern in Eastern Europe Using a Hybrid Classification Technique.” Remote Sensing of Environment 103: 449–464. doi: 10.1016/j.rse.2006.04.015
- Li, Z., D. Limin, G. Shao, X. Dong, W. Hui, and B. Jianwei. 2006. “GIS-based Analysis of Forest Degradations in Baihe Forestry Bureau, Northeast China.” Science in China Series E: Technological Sciences 49: 167–176. doi: 10.1007/s11431-006-8118-9
- Li, X., Q. Meng, X. Gu, T. Jancso, T. Yu, K. Wang, and S. Mavromatis. 2013. “A Hybrid Method Combining Pixel-based and Object-oriented Methods and its Application in Hungary Using Chinese HJ-1 Satellite Images.” International Journal of Remote Sensing 34: 4655–4668. doi: 10.1080/01431161.2013.780669
- Lindner, M., M. Maroschek, S. Netherer, A. Kremer, A. Barbati, J. Garcia-Gonzalo, R. Seidl, S. Delzon, P. Corona, and M. Kolstram. 2010. “Climate Change Impacts, Adaptive Capacity, and Vulnerability of European Forest Ecosystems.” Forest Ecology and Management 259: 698–709. doi: 10.1016/j.foreco.2009.09.023
- Lookingbill, T. R., and D. L. Urban. 2003. “Spatial Estimation of air Temperature Differences for Landscape-scale Studies in Montane Environments.” Agricultural and Forest Meteorology 114: 141–151. doi: 10.1016/S0168-1923(02)00196-X
- Lu, D., and Q. Weng. 2007. “A Survey of Image Classification Methods and Techniques for Improving Classification Performance.” International Journal of Remote Sensing 28: 823–870. doi: 10.1080/01431160600746456
- Malik, R. N., S. Z. Husain, and T. Benes. 2003. “Evaluating Deforestation Using Landsat TM and SPOT XS Data in dry sub-Tropical Forest of Margalla Hills, Northwest of Pakistan.” Geoinformation for European-Wide Integration, 429–434.
- Masroor, R. 2011. “An Annotated Checklist of Amphibians and Reptiles of Margalla Hills National Park, Pakistan.” Pakistan Journalof Zoology 43: 1041–1048.
- Nakicenovic, N., and R. Swart. 2000. “Special report on emissions scenarios.” Special Report on Emissions Scenarios, edited by Nebojsa Nakicenovic and Robert Swart, 612. Cambridge: Cambridge University Press. ISBN 0521804930.
- Nasir, Y. J. and Akhter, R. 1987. A Check List of Wild Trees, Shrubs, and Climbers of the National Park, Margalla Hills, Islamabad. Biologia, 33: 149–176.
- Nobre, C. A., P. J. Sellers, and J. Shukla. 1991. “Amazonian Deforestation and Regional Climate Change.” Journal of Climate 4: 957–988. doi: 10.1175/1520-0442(1991)004<0957:ADARCC>2.0.CO;2
- PARC. 2009. “Forest Fires: Their Causes, Effects and Control.” Pakistan Agricultural Research Council. Progressive Farming 7: 32.
- Peh, K. S. H., B. Sonke, O. Sene, M.-N. K. Djuikouo, C. K. Nguembou, H. Taedoumg, S. K. Begne, and S. L. Lewis. 2014. “Mixed-forest Species Establishment in a Monodominant Forest in Central Africa: Implications for Tropical Forest Invasibility.” PLoS ONE 9: 1–15. doi: 10.1371/journal.pone.0097585
- Rich, B. 2013. Mortgaging the Earth: The World Bank, Environmental Impoverishment, and the Crisis of Development. Island Press. ISBN 978-1-61091-515-1
- Ryan, M. G., M. E. Harmon, R. A. Birdsey, C. P. Giardina, L. S. Heath, R. A. Houghton, R. B. Jackson, D. C. McKinley, J. F. Morrison, and B. C. Murray. 2007. “A Synthesis of the Science on Forests and Carbon for US Forests.” Issues in Ecology 13: 1–16.
- Sea, D. S., and C. Whitlock. 1995. “Postglacial Vegetation and Climate of the Cascade Range, Central Oregon.” Quaternary Research 43: 370–381. doi: 10.1006/qres.1995.1043
- Shafiq, M., S. Ahmad, A. Nasir, M. Z. Ikram, M. Aslam, and M. Khan. 1997. “Surface run-off from Degraded Scrub Forest Watershed Under High Rainfall Zone.” Journal of Engineering and Applied Sciences 16: 7–12.
- Shahbaz, B., T. Ali, and A. Q. Suleri. 2007. “A Critical Analysis of Forest Policies of Pakistan: Implications for Sustainable Livelihoods.” Mitigation and Adaptation Strategies for Global Change 12: 441–453. doi: 10.1007/s11027-006-9050-9
- Shalaby, A., and R. Tateishi. 2007. “Remote Sensing and GIS for Mapping and Monitoring Land Cover and Land-use Changes in the Northwestern Coastal Zone of Egypt.” Applied Geography 27: 28–41. doi: 10.1016/j.apgeog.2006.09.004
- Song, C., C. E. Woodcock, K. C. Seto, M. P. Lenney, and S. A. Macomber. 2001. “Classification and Change Detection Using Landsat TM Data: When and How to Correct Atmospheric Effects?” Remote Sensing of Environment 75: 230–244. doi: 10.1016/S0034-4257(00)00169-3
- Sykes, M. T., and I. C. Prentice. 1996. “Climate Change, Tree Species Distributions and Forest Dynamics: a Case Study in the Mixed Conifer/Northern Hardwoods Zone of Northern Europe.” Climatic Change 34: 161–177. doi: 10.1007/BF00224628
- Triana, E. S., Afzal, J., Biller, D., and Malik, S. 2013. Greening Growth in Pakistan Through Transport Sector Reforms: A Strategic Environmental, Poverty, and Social Assessment. Washington: World Bank, 102 p.
- UNFCCC. 2009. UNFCCC Frame Work Convention on Climatic Change. Copenhagen Climate Change Conference, December.
- Wachiye, S. A., D. N. Kuria, and D. Musiega. 2013. “GIS Based Forest Cover Change and Vulnerability Analysis: A Case Study of the Nandi North Forest Zone.” Journal of Geography and Regional Planning 6: 159. doi: 10.5897/JGRP12.063
- Weng, Q., D. Lu, and J. Schubring. 2004. “Estimation of Land Surface Temperature-vegetation Abundance Relationship for Urban Heat Island Studies.” Remote Sensing of Environment 89: 467–483. doi: 10.1016/j.rse.2003.11.005
- World Bank. 2013. Forest Carbon Relationships. Washington, DC: World Bank.
- WWF. 2009. Boundary Delineation of Margalla Hills National Park. Boundary Demarcation and Renotification of Protected Areas Project. World Wildlife Fund (WWF).
- Zhang, X., P. Xiao, X. Feng, J. Wang, and Z. Wang. 2014. “Hybrid Region Merging Method for Segmentation of High-Resolution Remote Sensing Images.” ISPRS Journal of Photogrammetry and Remote Sensing 98: 19–28. doi: 10.1016/j.isprsjprs.2014.09.011
- Zonneveld, M., J. Koskela, B. Vinceti, and A. Jarvis. 2009. “Impact of Climate Change on the Distribution of Tropical Pines in Southeast Asia.” Unasylva 231: 24–29.