
 ?Mathematical formulae have been encoded as MathML and are displayed in this HTML version using MathJax in order to improve their display. Uncheck the box to turn MathJax off. This feature requires Javascript. Click on a formula to zoom.
ABSTRACT
Identification and monitoring of species composition and richness is needed to formulate effective mangrove management and conservation priorities. Prior studies have used commercial satellite images which are cost prohibitive for national and global applications. Here, we used freely available Landsat satellite data and new indices to discriminate mangrove species in Maros Regency, South Sulawesi, Indonesia and Segara Anakan, West Java, Indonesia. We use sensitive algorithm of the principal polar spectral (PPS) indices to discriminate mangroves species. PPS Indices were produced from a set of 3-dimensional Landsat 8 Operational Land Imager (OLI) spectral indices (PPS Brightness, PPS Greenness, and PPS Wetness) determined by a polar change of the principal component axes of a spectral image of reference scene. We qualitatively compare this set of PPS indices with the set of conventional RGB multi-bands image composition and conventional Normalized Difference Vegetation Indices (NDVI) for mangroves species discrimination. The comparisons indicate that the set of PPS indices have the potential for regional and possibly global applications in mangroves species mapping and monitoring.
1. Introduction
Mangrove forests is one of the most productive ecosystems in the world, they provide food sources and habitats for diverse organisms. Mangrove forests also protect the coastal environments, such as erosion mitigation and stabilization of nearby landforms (Harty Citation2004; Zhou et al. Citation2010). Indonesia has the largest of mangrove forests in the world with most high assorted qualities with 43 genuine mangrove species and accounts for 22.6% of the total global mangrove forest coverage (Giri et al. Citation2011). In 2003, mangrove woodlands secured a zone of 3,062,300 ha along the seaside range of Indonesia (Papua, Kalimantan, Sulawesi, Java, and Sumatera Island) (FAO Citation2005).
A work by Murdiyarso et al. (Citation2015) emphasizes the importance of Indonesian mangroves forest to mitigate climate change events through the provision of extensive biological services such as carbon storage and feed production for fish as well as wood production. From an economic point of view, mangrove forests also have an important role in Indonesia’s shrimp industry, since it provides abundant habitat for shrimp. From 2010 to 2013, Indonesia’s shrimp industry generates revenue of more than US$ 1 billion annually (Ministry of Maritime Affairs and Fisheries of Indonesia Citation2013). However, this figure was dramatically changed from 2014 to 2016 where the total revenue was decreased to nearly US$ 1 billion annually (Ministry of Maritime Affairs and Fisheries of Indonesia Citation2017). The decline is partially due to the loss of mangrove forest in Indonesia.
The primary driver of mangrove loss in Indonesia is the transformation of the area for shrimp ranches (East Java, Sulawesi, and Sumatra), extreme logging, and to a lesser degree, change of area to horticulture or salt container (Java and Sulawesi). Different ranges have been debased by oil slicks (East Kalimantan) and contamination (FAO, Citation2005). The status of the mangrove environment in Indonesia has been surveyed in a few studies (Giri et al. Citation2015; Burbridge and Koesoebiono Citation1982; Choong, Wirakusumah, and Achmadi Citation1990; Ramdani, Rahman, and Setiani Citation2015). Besides, the financial environment linkages of mangrove usage in Indonesia have likewise been recorded (Dutrieux Citation1991; Verheugt et al. Citation1991; Ruitenbeek Citation1994; Babo and Froehlich Citation1998; Armitage Citation2004).
The mapping of mangrove species is of high importance to understand the different services and goods provided by the mangroves forest, as suggested by Ewel, Twilley, and Ong (Citation1998). Among the most vital roles, as explained by Polidoro et al. (Citation2010), is water purification services for the coastal community that is served by Avicennia species. The loss of this species and the mangroves forest they dominated will have a negative impact and consequences for water quality and coastal environment.
Each mangrove species plays different services for the environment. A lot of studies that have been conducted to discriminate mangroves species. For example, Myint et al. (Citation2008) trying to identify mangrove species using an object-oriented approach with a lacunarity spatial measure. Jia et al. (Citation2014) used hyperspectral data of EO-1 HYPERION sensor and high spatial resolution data of SPOT-5 sensor for mapping mangroves species, while Vaiphasa et al. (Citation2005) used hyperspectral data to discriminate mangroves species in laboratory scale. Another study by Wang et al. (Citation2004) employed IKONOS and QuickBird images of classifying mangroves species. Further, a study by Kamal, Phinn, and Johansen (Citation2015) was used an object-based method to understand what types of mangrove information can be mapped using different image datasets (Landsat TM, ALOS AVNIR-2, WorldView-2, and LiDAR). However, most of the studies used commercial satellite images which are costly.
This study examines the Principal Polar Spectral (PPS) indices for mapping mangroves forest with chosen record calculations utilizing the freely available Landsat 8 OLI images, BRDF (Bi-directional Radiance Distribution Function) rectified to top-of-atmospheric visible reflectance with consistent sun/sensor geometry and nadir-view (Danaher, Wu, and Campbell Citation2001). The PPS indices was introduced by Moffiet, Armston, and Mengersen Citation2010, and has been implemented in our previous study on oil palm plantation expansion and its correlation to the rise of surface temperature (Ramdani, Moffiet, and Hino Citation2014). In the previous study, PPS indices demonstrated a sensitive result on oil palm plantation foliage, while the commonly used Normalized Difference Vegetation Indices (NDVI) rapidly loses sensitivity (saturates) at moderate to high levels of cover. Due to its sensitivity, we hypothesize that the PPS indices could be implemented for mapping mangroves species. In this study, we pioneer the application of PPS indices for mapping mangrove forests which, due to its sensitivity, can be a reliable approach to differentiate mangrove species. The selected study areas are South Sulawesi and West Java in Indonesia, where the characterization of the mangrove forests in the two locations has not been observed previously.
2. Data and method
2.1 Data and study area
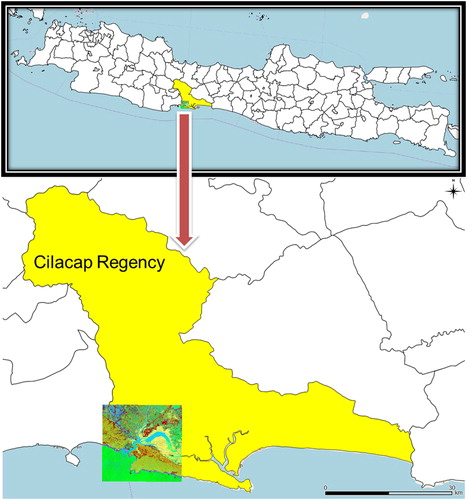
The data used for this study is Landsat 8 OLI derived from glovis.usgs.gov. The dataset consists of a single year 2014 for the two study areas. shows the location of Maros Regency (∼40 km2), the South Sulawesi Province, Indonesia, and shows the location of Segara Anakan, the West Java Province, which is also the largest mangrove forest in Indonesia. The dataset was acquired on 1 May 2014 (Path 121/Row 65), and 7 October 2014 (Path 114/Row 64) for Segara Anakan and Maros Regency, respectively. Using these images, comparison of PPS indices versus RGB bands combination and PPS indices versus conventional NDVI is made to differentiate mangroves species. The comparison provides insight into the differences between the conventional spectral and what they appear to be measuring.
Figure 1. Study Area 1, Maros Regency, South Sulawesi, Indonesia.
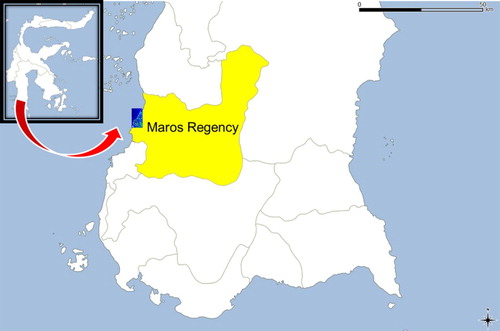
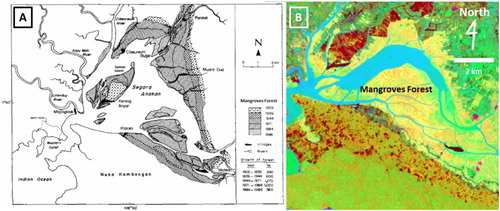
Figure 2. Study area 2, Segara Anakan, Cilacap Regency, West Java.
2.2. PPS indices transformation
This study applies the novel indices, i.e. Principal Polar Spectral Greenness, Wetness, and Brightness (PPSG-PPSW-PPSB), which classify mangrove species based on the value of greenness, wetness, and brightness of the spectral image.
The value of PPSG transformation is calculated using Equation (1):(1)
(1) where ρ1–ρ7 = top-of-atmosphere (ToA) reflectance for the Landsat 8 OLI bands 2–7 and SF = Spectral Focus.
For making subjective examinations with worldwide files crosswise over provincially scattered scenes, it will be incorporated as a steady organize (SF1, SF2) = (–0.25, –0.25) in the PPS change mathematical statements.
To calculate PPSB and PPSW transformation, three scores of principle reference (PR) is required. These values were derived by using Principal Component Analysis (PCA) which normalized data obtained from the spectral images and selected most optimum score.
The PPSB layer is a combination of the PR1 and PR2 layers of the temporary principal reference transformation (PRT) image produced using Equation (2). PPSB is equivalent to a distance measured from the spectral focus on the PR1, PR2 plane. That is, it is the vector length from the spectral focus to the observed pixel values for (PR1, PR2).
Meanwhile, PPSW layer is a combination of the PR3 layer of the temporary PRT image and the PPSB layer of the PPS image produced using Equation (3). PPSW is also an angle in radians. It gives the direction from the apparent spectral focus to the observed pixel value (PR1, PR2, PR3).(2)
(2)
(3)
(3) where
Principal Reference Scores
(4)
(4)
(5)
(5)
(6)
(6)
ρ2–ρ7 = top-of-atmosphere (ToA) reflectance for the Landsat 8 OLI bands 2–7. Therefore, conversion of DNs (digital numbers) into ToA is required before calculating PPS indices. Principle reference scores were derived from Principal Component (PC) Analysis, where the values are specific to the individual scene. PR1, PR2, PR3 = temporary image of the principal reference transformation (PRT) image
Then we create a three-layer (PPSG = red, PPSB = green, PPSW = blue) image and compare with a three-layer (Band5 = red, Band4 = green, Band2 = blue). More natural combinations of the three colors in the PPS image is compared to the conventional RGB image through visual inspection. We hypothesize that PPS indices will exhibit the greatest dynamic range of mangroves feature. A greater dynamic range of PPS indices will be useful for resolving small differences in mangroves cover and discriminate the species, particularly for large study areas. Furthermore, the PPS indices were also compared with the conventional NDVI to evaluate the accuracy. The NDVI was calculated using Equation (7).(7)
(7)
where ρNIR top-of-atmosphere (ToA) reflectance for the Landsat 8 OLI band NIR and ρRed: top-of-atmosphere (ToA) reflectance for the Landsat 8 OLI band Red.
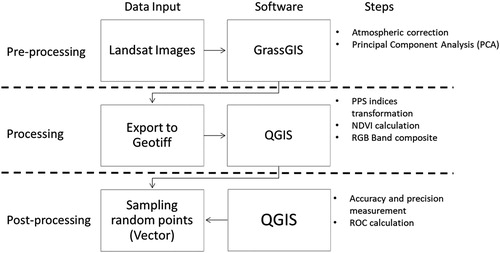
The methodology used in this study is summarized in . Grass GIS and QGIS open source software was used to generate the PPS indices. The Grass GIS was employed for pre-processing the Landsat images and for the Principal Component Analysis (PCA). The result then exported to GeoTIFF format and processed in QGIS environment for PPS indices transformation, NDVI calculation, and RGB band composite. For the accuracy and precision measurement, the result of fieldwork then imported to QGIS for post-processing analysis. The specification for computing platform used in this study is as following:
Processor: Intel ®Pentium Core i7-3612QM, CPU @ 2.10GHz
RAM: 8.00 GB
SSD: 500GB
Operating System: Windows 10, 64-bit Operating System, x64-based processor
VGA Card: NVIDIA GEFORCE® with CUDA™
Figure 3. Flowchart of PPS indices transformation and evaluation.
2.3 Receiver operating characteristics (ROC) for accuracy assessment
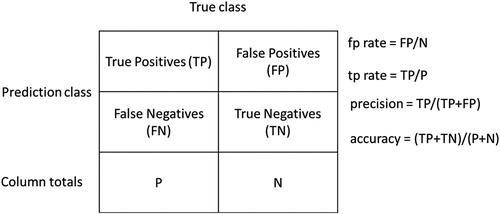
For accuracy assessment, we adopt the ROC method (Fawcett Citation2006; Powers Citation2011) to evaluate the accuracy and class precision of each classification. In the ROC method, there are four possible results; (1) True Positive (TP), if the result is positive and it is classified as positive; (2) False Negative (FN), if it is classified as negative; (3) True Negative (TN), if the result is negative, and it is classified as negative; and (4) False Positive (FP), if it is classified as positive. The contingency table then constructed representing the disposition of the set of result.
Further, the ROC graph then can be visualized, where the TP rate is plotted on the Y-axis and FP rate is plotted on the X-axis. When the line of the result of classification located upper the baseline of the graph, it is the evidence that the classification is correctly positive. On the other hand, when the line of the result of classification located under the baseline of the graph, it is considered as a lower classification result. The calculation of each outcome and the contingency table of ROC method are shown in .
Figure 4. Contingency table and performance metric calculation of ROC.
3. Results and discussion
Past study reported that the distribution of mangrove species are controlled by the condition of shorelines, such as mean sea level, elevation profile, and wave characters (Kathiresan and Bingham Citation2001). This phenomenon, as a rule, reasons strip-like pattern that are typically found in mangrove environment (Vilarrubia Citation2000; Satyanarayana et al. Citation2002). There are basically two sorts of affiliations found in the first study area, either that dominated by Rhizophora or that by Bruguiera.
3.1. Speciation of mangroves distribution in maros regency using PPS indices (comparison with RGB composite)
Mangrove species around the study area show obvious zonation in the measurement parallel to the shoreline. Rhizophora is predominantly found along the streams in lowland to the coastline (). While Bruguiera is predominantly found along the coastline, and located between Rhizophora (). Further, local community still utilized the mangroves trees. They cut down mangroves, and from , it can be seen from higher resolution of Google Earth images, the young mangrove they deliberately planted as a replacement. However, since the spatial resolution of Landsat 8 OLI is only 30 m, the replacement could not be seen from the PPS Indices image.
Figure 5. Mangroves species distribution in the study area.
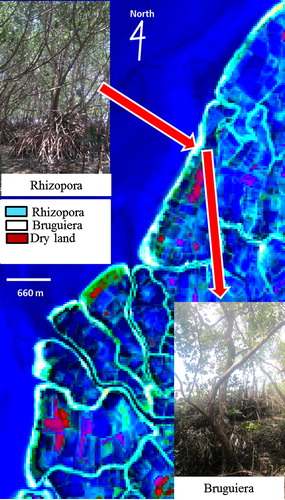
Figure 6. Mangroves species of Bruguiera is dominant along the coastline and located between Rhizophora.
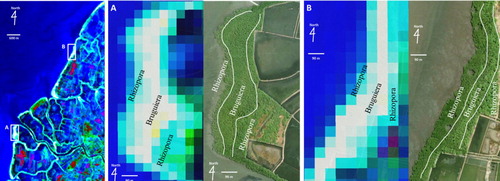
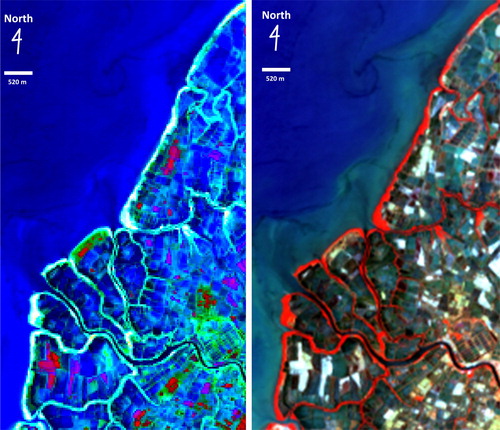
Figure 7. Processed image of mangrove forest in Maros Regency using PPS indices multi-bands (left) and conventional RGB (542) multi-bands without transformation (right).
A precision evaluation is crucial for land cover imagery analysis. Therefore, a fieldwork was conducted in February 2015 to collect information from the fields using high precision Trimble June 3B GPS. It could state how well the mapping result concurs with ground truth. Fifty points were selected randomly from each classification result and were then superimposed into PPS indices image in QuantumGIS, and then an accuracy assessment was then completed. To cover ∼40 km2 study area, we need to rent a boat to reach some difficult location, which is unreachable by walk.
The exactness of mapping mangrove species in the Maros Regency, South Sulawesi, Indonesia was as shown by the general accuracy are 92% and 89%, with class precision 86.2% and 84.2% for Bruguiera and Rhizophora, respectively ( and ). These outcomes showed that our mapping results are consistent with those outcomes acquired in the ground-truth survey.
Table 1. Accuracy assessment result of Bruguiera.
Table 2. Accuracy assessment result of Rhizophora.
shows the images obtained from processed image applying the PPS indices and RGB composition. It can be seen from that using conventional RGB multi-bands image composition of 542 of Landsat 8 OLI is unable to discriminate mangroves species. The image only shows the vegetation along the stream in the lowland and along the coastline. Sunlight has visible light and infrared light, as well light of other wavelengths. Sunlight interacts with the objects it hits. Some of it is absorbed, and some of it is reflected by those objects. Red, green, blue, and infrared light from the sun hit the mangrove tree and its leaves. While the infrared and green light are reflected from the tree, red and blue light are absorbed by the tree. Vegetation absorbs nearly all red light (it is sometimes called the chlorophyll absorption band). Water absorbs nearly all light at near-infrared wavelength water bodies appear very dark. This contrasts with bright reflectance for soil and vegetation, so it is a good band for defining the water/vegetation interface. However, it is still unable to discriminate mangrove species using an only conventional RGB combination.
While using PPS indices multi-bands composition the mangroves species are isolated using two colors: light blue (Rhizophora) and white (Bruguiera). This is a strong demonstration of the potential for PPS to be used as an index that is sensitive to foliage cover variation.
3.1. Speciation of mangroves distribution in segara anakan using PPS indices (comparison with NDVI)
Since the principle reference scores were derived from Principal Component (PC) Analysis, where the values are specific to the individual scene, we need to redo the PC analysis for each stack data sets.
The principle reference scores for the study area of Segara Anakan are shown in Equations (8–10):(8)
(8)
(9)
(9)
(10)
(10) where ρ2–ρ7 = top-of-atmosphere (ToA) reflectance for the Landsat 8 OLI bands 2–7. Therefore, conversion of DNs (digital numbers) into ToA is required before calculating PPS indices. Principle reference scores were derived from Principal Component (PC) Analysis, where the values are specific to the individual scene. PR1, PR2, PR3 = temporary image of the principal reference transformation (PRT) image
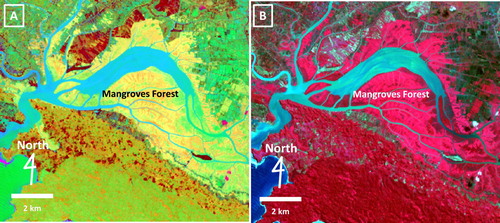
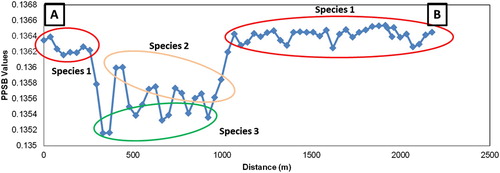
Our algorithm successfully highlighted three most dominance species inhabitants from the visual analysis. In , the PPS indices multi-bands composition the mangroves species are isolated within three colors: green, yellow, and orange, while conventional RGB (542) multi-bands without transformation only show the vegetation without differentiation. This is another proof that the PPS algorithm is sensitive to vegetation cover with specific reflectance characteristics.
Figure 8. Mangrove forests in Segara Anakan. A. Mangrove forests are isolated in three different colors; green, yellow, and orange, B. Conventional RGB (542) multi-bands without transformation only show the vegetation in red without any detail differentiation.
From the statistics analysis, we found that the areas of mangrove forests in Segara Anakan are about 33.1 km2 or equal to 33,100 hectares, this is consistent with the report of Segara Anakan Area Management Agency (BPKSA). For the consistency assessment, we compared the result with the previous researches by Suryono (Citation2006) and Susilawati (Citation1999), they research found that there are three species were dominant in the Segara Anakan; Avicennia marina, Sonneratia, and Rhizophora. This is consistent with our findings. Another study by White, Martosubroto, and Sadorra (Citation1989) also supports our findings that in Segara Anakan, there are three abundant species. Three species associations were observed: pure stands, paired associations, and mixed associations.
Furthermore, from the cross-section analysis of PPSB image, we found that three dominant species has very distinctive characteristics. The PPSB image was chosen as the base layer for cross-section analysis, since the PPSB values has the positive-strong correlation (r2 = 0.877) with conventional NDVI values, as shown in . The cross-section line location is shown in , while the extracted values of the cross-section line are shown in .
Figure 9. A. Scatterplot of a regression model of PPSB vs. NDVI, where r2 = 0.877. B. A regression model of PPSG vs. NDVI, where r2 = 0.021. C. A regression model of PPSW vs. NDVI, where r2 = 0.094.
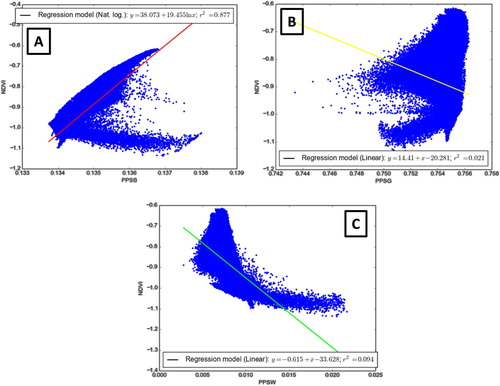
Figure 10. Cross-section line location (A to B) to extract PPSB values.
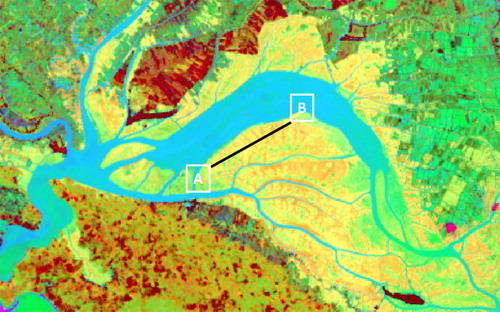
Figure 11. Extracted values of PPSB image from cross-section line features (A to B).
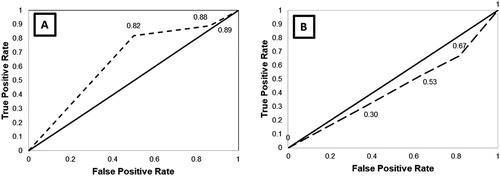
Fifty random points was collected to measure the accuracy, and the ROC graph analysis method was used to measure the accuracy as shown in . From the comparison of accuracy result obtained by PPS indices and NDVI using ROC graph, it is shown that the PPS indices outperformed the conventional NDVI.
Figure 12. ROC graph of PPS indices (A) and NDVI indices (B).
Furthermore, changes on mangrove forest of Segara Anakan are completely captured as shown in . Mangroves forest and shoreline in the year 2014 is much larger than in the year 1986 as found in the White, Martosubroto, and Sadorra Citation1989. This development is due to huge sedimentation from Citanduy river, Cimeneng river, and Cikonde river, which is settled in Segara Anakan lagoon. The general sedimentation inside the Segara Anakan lagoon is directed by the water course. If the energy, which is reflected in the level development of the water mass, is high, at that point the sediment will remain suspended and move with the water mass. If the water movement slows, such that the energy is not strong enough to keep the sediment suspended, at that point it begins falling, and deposition happens. In addition, the vitality of the water development will likewise act to sort the extent of silt that will be stored along the way of the streams. As soon as the bottom of the lagoon is shallow enough, there is normally an accretion of mangroves over the area (White, Martosubroto, and Sadorra Citation1989).
Figure 13. A. Shoreline and mangroves forest growth from 1903 to 1986 (White, Martosubroto, and Sadorra Citation1989); B. Mangroves forest in 2014.
4. Conclusions
The PPS indices algorithms, developed from the principal components analysis of a local image used as a reference, demonstrated useful properties when applied to mapping distributed vegetation cover. In particular, the PPSB index from the set was demonstrated to be sensitive to discriminate in the vegetation parameter of mangrove species.
Mangrove species in the Maros Regency, South Sulawesi, Indonesia were mapped utilizing Landsat 8 OLI sensor and supported by high spatial determination information of Google Earth taking into account new PPS indices method. The medium spectral resolution of Landsat 8 OLI images was found to be useful in mangrove species discrimination. From the visual inspection, the result supports the hypothesis that the PPS indices successfully discriminate the mangroves species. A precision and accuracy evaluation from 50 points random selection was conducted and shows that the general accuracy are 92% and 89%, with class precision 86.2% and 84.2% for Bruguiera and Rhizophora, respectively, which show that the discrimination result are consistent with the existing mangrove forest.
The limit is just the spatial resolution of 30 m which has confined its openness of little or limited mangrove environment. The mapping result demonstrates that there are mainly two mangrove species in the coastline of Maros Regency, that is, Rhizophora and Bruguiera. While, in the larger study area, Segara Anakan, there are three dominant mangrove species.
When the method employed in the larger study area, the result sounds promising. The characteristics of every suspected dominant species are clearly distinguishable. As shown in and , the mangrove forest is clearly highlighted in very distinctive color compared to conventional vegetation indices. The combinations of PPSG-PPSW-PPSB in the RGB canal successfully distinguish the mangrove forest of the larger scale of Segara Anakan and outperformed the conventional NDVI accuracy.
Further observation is examinations with another existing index or another satellite image such as Sentinel-2, to make further investigation for surveying the capability of the PPS indices. The more vital examination test is to make pragmatic utilization of the arrangement of PPS indices to enhance the exactness of remote sensing of vegetation parameters and other scene features of interest within the globe. Noteworthy pragmatic changes will not fundamentally be accomplished exclusively by execution of enhanced indices, or index sets, however, will likewise oblige enhancements to empirical modeling methods in general.
Indonesian mangroves forests are under threat, both by natural and anthropogenic factors. In the last three decades, mangroves forest losses as a result of anthropogenic elements have expanded essentially. The causes include coastal development, marine pollution, overfishing and destructive fishing, and watershed-based pollution. The rest of the mangrove forests are under tremendous threat from clear-cutting, land-utilization change, hydrological adjustments, synthetic spill and environmental change. In the near future, the rise of sea level will become a new threat to mangrove forests biologic and non-biologic ecosystems. The activities that contribute the most to mangrove forest loss in Indonesia are exploitation that orients in short-term profits instead of long-term and sustainable conservation. Hence, a practical and sensitive method to observe of changes in mangrove forest areas is vital to minimize the risk of clearing that may lead to permanent environmental destruction.
This study indicates that the georeferenced satellite datasets of Landsat OLI 8 could be utilized to discriminate mangrove species when processed with the set of PPS indices. We conclude that the PPS indices is sensitive to identify little changes in foliage spread at high amounts of cover to examine mangroves species along the coastline of South Sulawesi, and West Java, Indonesia. The novel methods developed in this study have the potential for regional and possibly global applications in mangroves species monitoring and mapping projects.
Disclosure statement
No potential conflict of interest was reported by the authors.
ORCID
Fatwa Ramdani http://orcid.org/0000-0002-8645-354X
References
- Armitage, D. 2004. “Socio-institutional Dynamics and the Political Ecology of Mangrove Forest Conservation in Central Sulawesi, Indonesia.” Continental Shelf Research 24: 2535–2551. doi: 10.1016/j.csr.2004.07.024
- Babo, N. R., and J. W. Froehlich. 1998. Community-based Mangrove Rehabilitation: A Lesson Learned from East Sinjai, South Sulawesi, Indonesia. Washington, DC: The World Bank.
- Burbridge, P. R., Koesoebiono. 1982. “Management of Mangrove Exploitation in Indonesia.” Applied Geography, 2: 39–54. doi: 10.1016/0143-6228(82)90016-9
- Choong, E. T., R. S. Wirakusumah, and S. S. Achmadi. 1990. “Mangrove Forest Resources in Indonesia.” Forest Ecology and Management 33/34: 45–57. doi: 10.1016/0378-1127(90)90183-C
- Danaher, T. J., X. Wu, and N. Campbell. 2001. “Bi-directional Reflectance Distribution Function Approaches to Radiometric Calibration of Landsat ETM+ imagery.” In: Proceedings of the IEEE International Geoscience and Remote Sensing Symposium (IGARSS), 9–13th July, 2001, Sydney, Australia.
- Dutrieux, E. 1991. “Study of the Ecological Functioning of the Mahakam Delta (East Kalimantan, Indonesia).” Estuary, Coastal and Shelf Science, 32: 415–420. doi: 10.1016/0272-7714(91)90053-E
- Ewel, K., Twilley, R. and Ong, J. 1998. “Different Kinds of Mangrove Forests Provide Different Goods and Services.” Global Ecology & Biogeography Letters 7: 83–94. doi:10.1111/j.1466-8238.1998.00275.x doi: 10.2307/2997700
- FAO. 2005. The World’s Mangroves 1980–2005. Rome: Food and Agriculture Organization of the United Nations. Accessed 11 February 2015. ftp://ftp.fao.org/docrep/fao/010/a1427e/a1427e00.pdf.
- Fawcett, T. 2006. “An Introduction to ROC Analysis.” Pattern Recognition Letters 27 (8): 861–874. doi:10.1016/j.patrec.2005.10.010.
- Giri, C., Long, J., Abbas, S., Murali, R. M., Qamer, F. M., Pengra, B., and Thau, D. 2015. “Distribution and Dynamics of Mangrove Forests of South Asia.” Journal of Environmental Management. doi:10.1016/j.jenvman.2014.01.020.
- Giri, C., E. Ochieng, L. L. Tieszen, Z. Zhu, A. Singh, T. Loveland, J. Masek, and N. Duke. 2011. “Status and Distribution of Mangrove Forests of the World Using Earth Observation Satellite Data.” Global Ecology and Biogeography 20 (1): 154–159. doi:10.1111/j.1466-8238.2010.00584.x. doi: 10.1111/j.1466-8238.2010.00584.x
- Harty, C. 2004. “Planning Strategies for Mangrove and Saltmarsh Changes in Southeast Australia.” Coastal Management 32 (4): 405–415. doi:1080/08920750490487386 doi: 10.1080/08920750490487386
- Jia, M., Y. Zhang, Z. Wang, K. Song, and C. Ren. 2014. “Mapping the Distribution of Mangrove Species in the Core Zone of Mai Po Marshes Nature Reserve, Hong Kong, Using Hyperspectral Data and High-Resolution Data.” International Journal of Applied Earth Observation and Geoinformation 33: 226–231. doi:10.1016/j.jag.2014.06.006.
- Kamal, M., S. Phinn, and K. Johansen. 2015. “Object-based Approach for Multi-scale Mangrove Composition Mapping Using Multi-resolution Image Datasets.” Remote Sensing 7: 4753–4783. doi: 10.3390/rs70404753
- Kathiresan, K., and B. L. Bingham. 2001. “Biology of Mangroves and Mangrove Ecosystems.” Advances Marine Biology 40: 81–251. doi: 10.1016/S0065-2881(01)40003-4
- Ministry of Maritime Affairs and Fisheries of Indonesia. 2013. Shrimp Production Volume. http://www.djpb.kkp.go.id/public/upload/statistik_series/Statistik%202009%20-%202013%20UDANG.pdf.
- Ministry of Maritime Affairs and Fisheries of Indonesia. 2017. Export of Fishery Products. http://statistik.kkp.go.id/sidatik-dev/2.php?x=9.
- Moffiet, T., J. D. Armston, and K. Mengersen. 2010. “Motivation, Development and Validation of a New Spectral Greenness Index: A Spectral Dimension Related to Foliage Projective Cover.” ISPRS Journal of Photogrammetry and Remote Sensing 65 (1): 26–41. doi: 10.1016/j.isprsjprs.2009.08.002
- Murdiyarso, Daniel, Joko Purbopuspito, J. Boone Kauffman, Matthew W. Warren, Sigit D. Sasmito, Daniel C. Donato, Solichin Manuri, Haruni Krisnawati, Sartji Taberima, and Sofyan Kurnianto. 2015. “The Potential of Indonesian Mangrove Forests for Global Climate Change Mitigation.” Nature Climate Change 5 (July): 1089–1092. doi:10.1038/nclimate2734.
- Myint, S. W., C. P. Giri, L. Wang, Z. Zhu, and S. Gillette. 2008. “Identifying Mangrove Species and Their Surrounding Land Use and Land Cover Classes Using an Object Oriented Approach with a Lacunarity Spatial Measure.” GIScience and Remote Sensing 45(2): 188–208. doi: 10.2747/1548-1603.45.2.188
- Polidoro, B. A., K. E. Carpenter, L. Collins, N. C. Duke, A. M. Ellison, J. C. Ellison, E. J. Farnsworth, et al. 2010. “The Loss of Species: Mangrove Extinction Risk and Geographic Areas of Global Concern.” PLoS One. doi:10.1371/journal.pone.0010095.
- Powers, D. M. W. 2011. “Evaluation: From Precision, Recall and F-measure to ROC, Informedness, Markedness & Correlation.” JournaL of Machine Learning Technologies 2 (1): 37–63. doi:10.1.1.214.9232.
- Ramdani, F., T. Moffiet, and M. Hino. 2014. “Local Surface Temperature Change Due to Expansion of Oil Palm Plantation in Indonesia.” Climatic Change 123: 189–200. doi: 10.1007/s10584-013-1045-4
- Ramdani, F., S. Rahman, and P. Setiani. 2015. “Inexpensive Method to Assess Mangroves Forest Through the Use of Open Source Software and Data Available Freely in Public Domain.” Journal of Geographic Information System 7: 43–57. doi:10.4236/jgis.2015.71004.
- Ruitenbeek, H. J. 1994. “Modelling Economy-ecology Linkages in Mangroves: Economic Evidence for Promoting Conservation in Bintuni Bay, Indonesia.” Ecological Economics 10: 233–247. doi: 10.1016/0921-8009(94)90111-2
- Satyanarayana, B., Raman, A.V., Dehairs, F., Kalavati, C., Chandramohan, P. 2002. “Mangrove Floristic and Zonation Patterns of Coringa, Kakinada Bay, East Coast of India.” Wetlands Ecology and Management 10 (1): 25–37. doi: 10.1023/A:1014345403103
- Suryono, C.C. 2006. “Struktur Populasi Vegetasi Mangrove di Laguna Segara Anakan Cilacap, Jawa Tengah.” Indonesian Journal of Marine Science 11 (2): 112–118. doi:10.14710/ik.ijms.11.2.112-118.
- Susilawati, A. 1999. “Distribusi Jenis-Jenis Flora Penyusun Hutan Mangrove di Segara Anakan Cilacap.” BioSMART 1 (2): 28–33.
- Vaiphasa, C., S. Ongsomwang, T. Vaiphasa, and A. K. Skidmore. 2005. “Tropical Mangrove Species Discrimination Using Hyperspectral Data: A Laboratory Study.” Estuarine, Coastal and Shelf Science 65: 371–379. doi:10.1016/j.ecss.2005.06.014.
- Verheugt, W. J. M., A. Purwoko, F. Danielsen, H. Skov, and R. Kadarisman. 1991. “Integrating Mangrove and Swamp Forests Conservation with Coastal Lowland Development: The Banyuasin Sembilang Swamps Case Study, South Sumatra Province, Indonesia.” Landscape and Urban Planning, 20: 85–94. doi: 10.1016/0169-2046(91)90096-5
- Vilarrubia, T. V. 2000. “Zonation Pattern of an Isolated Mangrove Community at Playa Medina, Venezuela.” Wetlands Ecology and Management 8 (1): 9–17. doi: 10.1023/A:1008458409143
- Wang, L., W. P. Sousa, P. Gong, and G. S. Biging. 2004. “Comparison of IKONOS and QuickBird Images for Mapping Mangrove Species on the Caribbean Coast of Panama.” Remote Sensing of Environment 91: 432–440. doi:10.1016/j.rse.2004.04.005.
- White, A. T., P. Martosubroto, M. S. M. Sadorra. 1989. The coastal environmental profile of Segara Anakan-Cilacap, South Java, Indonesia. International Center for Living Aquatic Resources Management (ICLARM) Technical Reports 25, 82p. Manila, Philippines.
- Zhou, Y. W., B. Zhao, Y. S. Peng, and G. Z. Chen. 2010. “Influence of Mangrove Reforestation on Heavy Metal Accumulation and Speciation in Intertidal Sediments.” Marine Pollution Bulletin 60 (8): 1319–1324. doi:10.1016/j.marpolbul.2010.03.010.