
 ?Mathematical formulae have been encoded as MathML and are displayed in this HTML version using MathJax in order to improve their display. Uncheck the box to turn MathJax off. This feature requires Javascript. Click on a formula to zoom.
ABSTRACT
Digital Elevation Models (DEMs) contain topographic relief data that are vital for many geoscience applications. This study relies on the vertical accuracy of publicly available latest high-resolution (30 m) global DEMs over Cameroon. These models are (1) the ALOS World 3D-30 m (AW3D30), (2) the Shuttle Radar Topography Mission 1 Arc-Second C-Band Global DEM (SRTM 1) and (3) the Advanced Spaceborne Thermal Emission and Reflection Global DEM Version 2 (ASTER GDEM 2). After matching their coordinate systems and datums, the horizontal positional accuracy evaluation was carried out and it shows that geolocation errors significantly influence the vertical accuracy of global DEMs. After this, the three models are compared among them, in order to access random and systematic effects in the elevation data each of them contains. Further, heights from 555 GPS/leveling points distributed all over Cameroon are compared to each DEM, for their vertical accuracy determination. Traditional and robust statistical measures, normality test, outlier detection and removal were used to describe the vertical quality of the DEMs. The test of the normality rejected the hypothesis of normal distribution for all tested global DEMs. Overall vertical accuracies obtained for the three models after georeferencing and gross error removal in terms of Root Mean Square (RMS) and Normalized Median Absolute Deviation (NMAD) are: AW3D30 (13.06 m and 7.75 m), SRTM 1 (13.25 m and 7.41 m) and ASTER GDEM 2 (18.87 m and 13.30 m). Other accuracy measures (MED, 68.3% quantile, 95% quantile) supply some evidence of the good quality of AW3D30 over Cameroon. Further, the effect of land cover and slope on DEM vertical accuracy was also analyzed. All models have proved to be worse in the areas dominated by forests and shrubs areas. SRTM 1 and AW3D30 are more resilient to the effects of the scattering objects respectively in forests and cultivated areas. The dependency of DEMs accuracy on the terrain roughness is evident. In all slope intervals, AW3D30 is performing better than SRTM 1 and ASTER GDEM 2 over Cameroon. AW3D30 is more representative of the external topography over Cameroon in comparison with two others datasets and SRTM 1 can be a serious alternative to AW3D30 for a range of DEM applications in Cameroon.
1. Introduction
Digital Elevation Models (DEMs) contain topographic data that are vital for many scientific, technical, and other applications. Among these applications, there are land researches (geomorphology, monitoring active volcanoes and observing eruptions (Vassilopouloua et al. Citation2002; Bisson et al. Citation2016), geological activities in mountainous and flat areas (Azzaro et al. Citation2012; Rebai et al. Citation2013), monitoring coastal erosions and sedimentations (Du et al. Citation2012, Citation2015; Wadey, Nicholls, and Hutton Citation2012; de Vente et al. Citation2013), etc …). There are also sea area and land water area researches (Pekel et al. Citation2016), analysis of sea surface temperatures of coastal zones, mapping and database creation of coral reef (Hedley et al. Citation2016; Hamylton Citation2017, etc …), snow, ice (monitoring of glacier (Kääb Citation2005; Fujita et al. Citation2008; Lenzano Citation2013; Liu et al. Citation2016)) and atmosphere studies (monitoring of clouds and ice in polar regions (Cook et al. Citation2012; Brunt et al. Citation2014; Li et al. Citation2015), research on types of cloud formation, etc.). Even when they are used indirectly in a study, topographic data are sometimes introduced in preparing visualization tools such as perspective or stereoscopic terrain views. DEMs are a set of heights of points, defined with respect to a specific reference system, and generally presented in the form of a digital raster file, or an ASCII text grid file. In these files, heights of unknown points can be interpolated. DEMs are also used to generate contour lines (representing specific height values) on topographic maps, where they can be easily interpreted in terms of the earth’s topography shape. These heights can also be used for 3D reconstitution of the real earth topography (terrain only), or 3D modeling accounting for the upper surface of the landscape. In the first case, the DEM is a Digital Terrain Model (DTM) and in the second, it is a Digital Surface Model (DSM), accounting for vegetation heights, buildings and other surface features. DTMs and DSMs are therefore identical in areas with no ground cover. However, most data providers and professional users use the term DEM for both DTM and DSM (Varga and Bašić Citation2015).
DEMs are generally produced from stereoplotting using stereoscopic aerial photography and satellite images. This 3D stereoplotting is a time-consuming and high-cost process, difficult to set up in developing countries, even on areas of small extent. However, regional and large scale DEMs are needed in many worldwide applications, such as geoid computation (Kiamehr and Sjöberg Citation2005; Kamguia et al. Citation2007), gravity and magnetic modeling, hydrological analyses, water flood simulations, etc. Therefore, some other flexible techniques like ground survey, airborne laser scanning or Light Detection and Ranging (LIDAR) (Lohr Citation1998), Radio Detection and Ranging (RADAR) altimetry (Hilton et al. Citation2003), Interferometric Synthetic Aperture Radar (InSAR) (Hanssen Citation2001) are used instead. All these techniques are not well integrated in developing countries. With the advent of spatial missions for earth’s topography modeling and the recent technology developments, global DEMs are now improving the knowledge of the earth’s topography in the developing world, poorly served with geospatial data infrastructures (Hirt, Filmer, and Featherstone Citation2010).
However, the DEM used should best represent the external topography of the study area. To determine their vertical accuracy, independent elevation data are appropriate. The latest can be produced with terrestrial topographic surveys. Cameroon is covered by topographic data only on small scale (1/500 000 and 1/200 000) topographic maps of the country. In addition, these maps were produced more than 50 years ago, and now exist only on paper sheets. Also, they were realized using a local reference system, based on the Clarke 1880 reference ellipsoid (Kande et al. Citation2016), while the above modern DEMs are now referenced on the World Geodetic reference System 1984 (WGS84). GPS/Leveling data are also available. They were collected during the construction of the Cameroun Geodetic Network (Carme Citation2012).
The present paper aims to assess the vertical accuracy of freely available latest high-resolution (30 m) global DEMs over Cameroon, using GPS/leveling ground control points and the investigation of the relationship between vertical accuracy and topographic characteristics (land cover and topography roughness) of the country. These global DEMs are AW3D30, SRTM 1 and ASTER GDEM Version 2. The important characteristics of these DEMs are their recent release and almost global coverage and their unprecedented horizontal resolution of 30-m. The three models are firstly described and compared to one another, in order to access random and systematic effects among the elevation data each of them contains. Further, they are compared to relief data, using 555 GPS/leveled points distributed all over Cameroon, for external validation.
This paper is justified by the fact that since the newest high-resolution (30 m) global DEMs (AW3D30, SRTM 1 and ASTER GDEM Version 2) are available, no comprehensive study about their vertical accuracy has yet been reported over Cameroon. In addition, good quality ground data derived from GPS/leveling locally in the country, are available and can be introduced in such validation. Also, there are now two ongoing projects, aiming to compute the new gravimetric geoid model over Cameroon and to produce new topographic maps, from high-resolution aerial photography. A local DEM of the country will thus be produced from a method completely different from the ones used to calculate the above DEMs.
2. State-to-art research progress and review of DEMs available
2.1. State-to-art research progress
With the increasing advanced remote sensing technologies in these recent decades (e.g. LIDAR, InSAR, stereo optical and laser altimetry), numerous studies validating the accuracy performance of various global DEMs have been performed over different regions of the world using many kinds of reference data and reference DEMs. In the area of China, Zhan, Tang, and Yang (Citation2010) using the 1/50 000 scale DEM evaluated the SRTM 3 DEM and showed that the vertical accuracy is negatively related to the average slope in the study area. Li et al. (Citation2013) also evaluated the absolute vertical accuracy of ASTER GDEM using GPS benchmarks and SRTM data over China. Their results suggest that ASTER GDEM has Root Mean Square (RMS) values ranging from 12.1 to 29.0 m against ground control points (GCPs), which are slightly greater than the RMS values of CSI SRTM (7.6–25.0 m). Du et al. (Citation2015) assessed vertical accuracy of SRTM and ASTER GDEM using Ice, Cloud, and land Elevation Satellite, Geoscience Laser Altimeter System (ICESat/GLAS) and Real Time Kinematic (RTK) Global Positioning System (GPS) field survey data over low-lying coastal plains. Their findings show that the DEM accuracy is better than the mission specifications over coastal plains. Furthermore, Li et al. (Citation2016) using the precise GPS ground data validated the newly released global DEMs (SRTM v4.1, NASA SRTM v3, SRTMX and ASTER GDEM v2). They reported that The SRTMX DEM performs best with a height RMS error of 9.7 m, while the RMS of the ASTER GDEM2 is slightly better than that of the SRTM v4.1, and SRTM v3 which have the largest RMS error of 16.6 m in the region. Likewise, Hu et al. (Citation2017) performed the evaluation of some DEMs over China (SRTM 3, SRTM 1, ASTER GDEM and AW3D30). They showed that, SRTM 1 and AW3D30 have the higher accuracy in all land cover classes compared to SRTM 3 and ASTER GDEM, and denoted that all four DEMs have an accuracy better than 5 m for the plains areas, and 11.7 m for hilly areas, whereas over mountainous areas, the DEM quality varies from 18 m to 24 m.
In Australia, Hirt, Filmer, and Featherstone (Citation2010) evaluated the quality (in terms of elevation accuracy and systematic errors) of three DEMs (ASTER GDEM version 1, SRTM DEM version 4.1 and GEODATA DEM-9S version 3, using GPS/levelling GCPs. They showed that the vertical accuracy of GEODATA DEM-9S is ∼ 9 m, SRTM ∼ 6 m and ASTER ∼15 m. However, the further study of Rexer and Hirt (Citation2014) based on the evaluation of the latest release of the ASTER GDEM2 and two DEMs based on the SRTM (SRTM3 USGS version 2.1 and SRTM CGIAR-CSI version 4.1) indicates that the vertical accuracy of ASTER GDEM2 is ∼ 8.5 m, SRTM3 USGS is ∼ 6 m and SRTM CGIAR-CSI is ∼ 4.5 m. Also, Rexer and Hirt (Citation2016) compared 12 m-resolution TanDEM-X intermediate digital elevation model (IDEM) with 30 m-resolution SRTM 1 USGS v3, 30 m-resolution ASTER GDEM2, the local 25 m-resolution DEM available over Tasmanian territory using more than 15 000 accurate GCPs from the Australian National Gravity Database (ANGD). A RMS of 8.8 m indicates a good agreement of TanDEM-X IDEM and SRTM, while ASTER shows almost twice the disagreement in terms of RMS (∼ 16.5 m). Again, terrain-type analyses reveal that the TanDEM-X IDEM is a very consistent elevation database over Tasmania and beyond.
The main paper published on GDEMs over Africa are focusing particularly in the northern part of Africa. Athmania and Achour (Citation2014) performed the vertical accuracy assessment of the ASTER GDEM version 2, SRTM version 4.1 (SRTM v4.1) and GMTED2010, using Global Navigation Satellite Systems (GNSS) validation points over southern Tunisia and north eastern Algeria. In Tunisia, the vertical accuracy of SRTM is estimated to 3.6 m (in terms of RMS), 5.3 m and 4.5 m for the ASTER GDEM2 and GMTED 2010 DEMs, respectively. In Algeria, the overall vertical accuracy shows a RMS of 9.8 m, 8.3 m and 9.6 m for ASTER GDEM 2, SRTM and GMTED2010 DEMs, respectively. Moreover, Ouerghi et al. (Citation2015) selected the north East of Tunisia to evaluate the elevation accuracy of ASTER-GDEM ver.2 and SRTM ver.4.1 using a 1/25 000 relatively high precision topographical map. They showed that from lower RMS errors values, SRTM is comparatively more accurate than ASTER-GDEM. Furthermore, Chaieb, Rebai, and Bouaziz (Citation2016) assessed the vertical accuracy of SRTM Ver 4.1 and ASTER GDEM Ver 2 using 23 GPS GCPs over Central West of Tunisia. The statistical analysis reveals that the RMS error was 8.88 m and 10.13 m respectively for SRTM and ASTER GDEMs in the region. These results are different from that of Athmania and Achour (Citation2014) in the same region. The vertical accuracy assessment of SRTM Ver 4.1 and ASTER GDEM Ver 2 using Differential GPS Measurements was also undertaken by Amans, Beiping, and Ziggah (Citation2013) in Nigeria (Ondo State). They concluded that in the mountainous region, the RMS error was quite small for SRTM DEM, ±7.75 m compared to ASTER GDEM, ±12.72 m, and while in the less mountainous region, it was ± 14.48 m for SRTM and ± 13.25 m for ASTER.
Although numerous studies assessing the vertical accuracy of various DEMs over the world (GTOPO3, GLOBE, GMTED2010 (30-, 15-, and 7.5-arc-sec, SRTM v4.1, NASA SRTM v3, SRTMX, ASTER GDEM v2, etc …) exist, the assessment works about AW3D30 (available only since May 2016) are very limited. In fact, the preliminary validation of new GDEM called the ‘ALOS World 3D 30 m mesh’ (AW3D30) DSM undertook by Tadono et al. (Citation2016) from independent 5,121 CPs distributed in 127 tiles showed a height accuracy equals to 4.40 m in term of RMS error. Also, the detailed accuracies of the AW3D30 products were evaluated with their respective appropriate reference data, i.e. the ICESat, GCPs, and the LiDAR/DEM by Takaku et al. (Citation2016). They indicated that all the results were almost consistent and met the target height accuracy of 5 m RMS except for some extreme terrains. Moreover, Santillan and Makinano (Citation2016) conducted a vertical accuracy assessment about AW3D30, ASTER GDEM and SRTM 1 in the Philippines using 274 GPS control points. They suggested that the AW3D30 has the smallest RMS error of 5.68 m and is more accurate than SRTM-30 m and ASTER GDEM2. Likewise, Jain et al. (Citation2017) also conducted over Lower Tapi Basin in India, the vertical accuracy evaluation of SRTM-GL1, GDEM-V2, AW3D30 and CartoDEM-V3.1 of 30 m resolution using Dual Frequency GNSS. They found that in terms of RMS error, the vertical accuracies are 2.88 m, 5.46 m, 2.45 m and 3.52 m for SRTM-GL1, GDEM-V2, AW3D30 and CartoDEM-V3.1 respectively and concluded that AW3D30 was found to be more accurate compared to other three DEMs.
2.2. Review of DEMs
DEMs are generally presented as 2D regular gridded arrays of elevations relative to a datum, and referenced to a geographic coordinate system (Forkuo Citation2010) and can be provided in the form of ASCII, text or image file (Burrough Citation1986; Shingare and Kale Citation2013). Generally, the southwest corner of the grid is the starting point of the values containing in the DEMs, with following values in the northward of previous ones. After the coverage of the first row in the south-northern direction, the next in the eastward is displayed in the same manner. Nowadays, some DEMs have origins in the grid top-left-hand corner and are provided in raster or in 2-byte integer binary formats. Some earth features as mountain peaks, lake surface, confluences of streams and landmarks (geodetic control points) are represented by points or spots. It is also the case of digitized contour line segments considered as vector lines that can also represent them and sounding depth estimates (for bathymetry). There exists some confusions between DSM, DTM and DEM. DSM depicts heights of vegetation canopy (e.g. the tops of trees with their leaves) and of man-made structures elevated above the bare earth (Hirt Citation2014; Croneborg et al. Citation2015). DSMs are particularly useful for telecommunications management, forest management, air safety, 3-D modeling, and simulation (Croneborg et al. Citation2015). DTMs represent the bare ground of the terrain. In a DTM, the distinctive terrain features defined by a set of discrete points with unique height values over 2D points are more clearly visible, and contours generated from DTMs more closely approximate the real shape of the terrain (Hirt Citation2014; Croneborg et al. Citation2015). In some countries, DEMs are synonymous with DTMs but often as an umbrella term to describe both DTM and DSM (Hutchinson and Gallant Citation2005; Wood Citation2008; Shingare and Kale Citation2013; Hirt Citation2014).
In a DEM, one can extract single value for each location, considered to represent the earth’s surface at that location, but after accounting for many considerations:
The height in the DEM should not be the estimate of the height of vegetation canopy, when the user needs ground surface heights (DTM);
Errors in horizontal positional accuracy may result in significant vertical errors in the DEM, especially in areas of steep slopes;
The DEMs should represent point determination of elevation at the exact point referenced in the computer file;
It should be known whether the height in the DEM refers to the reference ellipsoid (geometrical ellipsoidal height) or to mean sea level (physical height);
The coordinate system, the projection type and the datum of the data in the DEM should be clearly defined;
The systematic errors in the DEM should be known.
In this study, the space-based AW3D30, SRTM 1 and ASTER GDEM 2 data sets used are Digital Surface Models (DSMs), as they provide heights of surface features, including the canopy. Thus, the land cover should be considered during the accuracy assessment of different tested models.
2.2.1. AW3D30 version 1.1
AW3D30 (ALOS World 3D-30 m) used in this study is the update with void-filled global digital surface model (DSM) within 60 deg. of N/S latitudes as Version 1.1 released by JAXA (Japan Aerospace Exploration Agency) in March 2017 (Tadono et al. Citation2016; Takaku et al. Citation2016). It was delivered with a horizontal resolution of approximately 30-meter mesh (1 Arc-Second latitude and longitude) generated from 5-meters mesh version of the World 3D Topographic Data, which is considered to be the most precise global-scale elevation data at this time. AW3D30 dataset has been compiled from stereoscopic images acquired by the Panchromatic Remote sensing Instrument for Stereo Mapping (PRISM) sensor onboard the Advanced Land Observing Satellite ‘DAICHI’ (ALOS) satellite (Takaku, Tadono, and Tsutsui Citation2014). The dataset was downloaded free of charge from http://www.eorc.jaxa.jp/ALOS/en/aw3d30/. The data are provided in two formats: AVE (average) and MED (median), according to the different methods used for resampling from the 5-m mesh to the final released version. We opted to evaluate the AVE data in this study. AW3D30 is provided in geographic coordinates. The elevation values are considered height above sea level (Tadono et al. Citation2016; Takaku et al. Citation2016).
2.2.2. SRTM 1 arc-second C-band
SRTM 1 Arc-Second (30 m) global DEM was generated from interferometric C-band Spaceborne Imaging Radar data acquired during the SRTM mission in 2000. This mission was a joint project of the National Aeronautics and Space Administration (NASA), the National Geospatial Intelligence Agency (NGA, formerly National Imagery and Mapping Agency, NIMA) of the U.S., Department of Defense (DoD), and DLR working in partnership with ASI (Farr et al. Citation2007). The SRTM objective was to acquire a consistent global high-resolution DEM of all land between about 60° North and 56° South latitude, about 80 percent of earth’s land surface using two synthetic aperture radars (C-band wavelength (5.6 cm) and X-band wavelength (3.1 cm)). Although SRTM 1 over the US was first released in 2003, data over the study area has become available only since 2015. The cartographic products derived from the SRTM 1 created through the processing of the C-band data by NASA were sampled over a grid of 1 arc-second by 1 arc-second (approximately 30 m by 30 m) using a nearest neighbor resampling technique. The SRTM 1 data were downloaded using the USGS Earth Explorer Interface in the GeoTiff format as 1° × 1° tiles from http://earthexplorer.usgs.gov/. The X-band data suffers from a severe data missing problem (Hu et al. Citation2017) and was therefore not used in this study. SRTM 1 data have been edited to delineate and flatten water bodies, better define coastlines, remove spikes and wells, and fill small voids (U.S. Geological Survey Citation2000). Larger areas of missing data or voids were filled by the NGA using interpolation algorithms in conjunction with other sources of elevation data. The SRTM 1 data meet the linear vertical absolute height error less than 16 m (linear error at 90% confidence, LE90; Foni and Seal Citation2004; Rodriguez et al. Citation2005), the circular absolute geolocation error less than 20 m (circular error at 90% confidence). In order to compare with RMS error, LE90 was converted to RMS error by the following formula (Greenwalt and Shultz Citation1962; Rodriguez et al. Citation2005; Du et al. Citation2015):(1)
(1) The SRTM 1 DEM is provided in geographic coordinates. The SRTM 1 elevation values refer to the WGS84 ellipsoid as horizontal datum and EGM96 (Pavlis, Rapp, and Olson Citation1998) geoid as vertical datum.
2.2.3. ASTER global DEM version 2 (GDEM 2)
The Advanced Spaceborne Thermal Emission and Reflection Radiometer Global DEM (ASTER GDEM) is a global model generated at a resolution of 1" grid (approximately 30 m at the equator). It was developed jointly by NASA and Japan’s Ministry of Economy Trade and Industry (METI), with the collaboration of scientific and industry organizations in both countries (METI/NASA Citation2009). ASTER GDEM version 2 used in this study was released on 17 October 2011. It covers land surfaces between 83° North latitude and 83° South latitude, and it is composed of 22702 tiles squared off with one degree by one degree with geographic coordinates. The elevation is referenced to the 1996 Earth Gravitational Model (EGM96) geoid, assimilated here to Mean Sea Level (MSL). Before the ASTER GDEM 2 was released to the public, it was validated in Japan using a 10 m mesh DEM produced by the Geographical Survey Institute (GSI) of the country (Tachikawa et al. Citation2011), focusing largely on horizontal resolution determination and artifact identification. In USA, it was evaluated firstly by comparison to a GPS benchmark data set (Gesch et al. Citation2012), considered as an absolute geodetic reference, with the ASTER data interpolated on benchmark points for comparison, using the bilinear method. The evaluation was secondly conducted with three DEMs: the National Elevation Dataset (NED), a 1" elevation grids over the USA, the Shuttle Radar Topography Mission (SRTM) DEM and the original ASTER DEM Version 1. The third evaluation was conducted by comparison to data collected by the Geoscience Laser Altimeter System (GLAS) on board the Ice, Cloud and land Elevation satellite (ICESat) (Zwally et al. Citation2002). The vertical accuracy of the ASTER GDEM is estimated to be 20 m at 95% confidence (LE95; ASTER GDEM Validation Team Citation2009).
In order to compare with RMS error, LE95 was converted to RMS by the following formula (Greenwalt and Shultz Citation1962; Federal Geographic Data Committee Citation1998):(2)
(2)
3. GPS/leveled control points evaluation in Cameroon
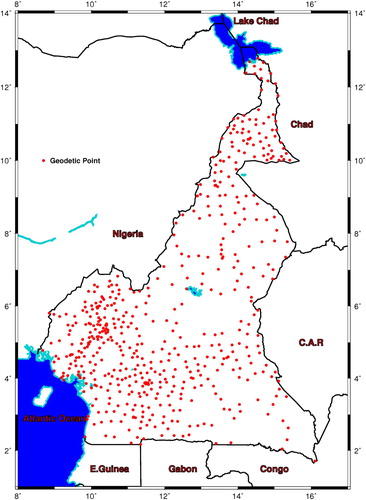
The independent elevation data used in this study are mean sea level heights (to a rough approximation) computed at 555 GPS/leveled GCPs over Cameroon. At these points, geometrical ellipsoidal elevations and the orthometric heights referenced to mean sea level are known. These GCPs provide up to decimeter level and centimeter-level respectively for horizontal and vertical accuracies and are an ideal reference data to assess GDEMs. They materialize the modern geodetic network of Cameroon (CGN2011) established in 2011. Ellipsoidal heights at these points were determined from long period GPS observations, tied to some of the continuously operating reference stations (CORS) of the IGS around the country (Carme Citation2012). Heights above sea level were computed from trigonometric leveling, tied to the general leveling of Central Africa, which was carried out during the colonial period, with the zero point corresponding to the Pointe-Noire tide gauge in Congo. The GCPs are not regularly distributed all over the country, and there remain many gaps especial in areas difficult to access (). The distance between them varies from less than 10 km in the west, to more than 100 km in the eastern part of the territory. However, their number is enough for pertinent statistical analyses, for the determination of the vertical accuracy of each of the above GDEMs.
Figure 1. Below represents the coverage of the 555 ground control points (GCPs) over Cameroon.
The following shows the statistical presentation of the height data used in this study. From this table, one can note that the maximal height is 2101.11 m, too small compared to the highest summit of the area, Mount Cameroon at 4038 m (Kamguia, Tadjou, and Ngouanet Citation2015) though there are many GCPs in the vicinity of the Mount Cameroon.
Table 1. Heights from ground control points in Cameroon (unit: meter).
4. Methods
4.1. Vertical datum matching and coordinate systems
Before carrying out the model-to-model comparison and the validation with the heights from GCPs, the DEMs datum and coordinate systems are firstly checked. Indeed, different datum for DEMs to be compared will lead to a small shift of the position, and therefore the height of a single point from one model to another. Similarly, different coordinate systems will conduct to misinterpretation of point positions in DEMs and the external validation relief data.
Orthometric heights at the 555 GCPs used in this study refer to mean sea level. The latitude and longitude coordinates are referenced to WGS84. All the DEMs tested here provide elevation data in regularly spaced grids of geographical coordinates, also referenced to the WGS84 datum. The vertical datum of SRTM 1 and ASTER GDEM 2 is EGM96 geoid and mean sea level for AW3D30 DEM. As the EGM96 surface is very close approximation to mean sea level (Pavlis, Rapp, and Olson Citation1998; Sun et al. Citation2003; Mukherjee et al. Citation2013; Jain et al. Citation2017), matching vertical datum is not necessary in this study. Details about each of the three DEMs tested in this study are indicated in the following .
Table 2. Main characteristics of the freely available DEMs tested in this paper.
4.2. Horizontal georeferencing estimation
Even if the scope of this study is not the assessment of geolocation errors, it is important to note that errors in horizontal positional accuracy may result the vertical errors in the DEMs, especially in areas of steep slopes. Before performing vertical assessment against benchmarks and relative to each other, georeferencing of all global DEMs was done. Many previous studies showed that geolocation errors significantly influence the vertical accuracy of global DEMs (e.g. Hirt, Filmer, and Featherstone Citation2010; Tachikawa et al. Citation2011; Mukherjee et al. Citation2013; Müller et al. Citation2014; Rexer and Hirt Citation2014; Varga and Bašić Citation2015; Mukul, Srivastava, and Mukul Citation2016; Hu et al. Citation2017). In this study, we used the procedure adopted by other authors such as Rodriguez et al. (Citation2005); Tachikawa et al. (Citation2011); Varga and Bašić (Citation2015); Hu et al. (Citation2017). Indeed, each grid of all global DEMs was systematically shifted by small increments from a half cell size (e.g. 0.5 arc seconds) in North–South (latitude) and East–West (longitude) directions in all combinations and compared against the heights of GCPs. The best fit, i.e. the lowest RMS computed from the residuals among the shifted models and GCPs, indicates the shifts models needed for the correct georeferencing among the models.
4.3. Data preparation and DEMs validation procedure
Before undertaking the pixel-to-pixel comparison or the validation against GCPs, The DEM scenes of the three tested GDEMs (ASTER GDEM 2, SRTM 1 and AW3D30) were independently mosaicked, and then the relevant portion of the each DEM that falls within the boundary of Cameroon territory was clipped. The DEM elevations were extracted using the spatial analyst tool within ArcGIS 9.3 software to ‘extract values to points’ of each DEM grid raster layer based on GCPs location. This extraction procedure was implemented through the bilinear interpolation from the surrounding grid points of the original spatial resolution of each DEM. After this step, the height accuracy evaluation is assessed on basis of the difference between the values of the DEM elevations and its corresponding values of GCP elevations which represent the measured errors in the DEM. For a particular DEM, positive errors represent locations where the DEM was above the GCP elevation, and negative errors occur at locations where the DEM was below the control point elevation (Gesch et al. Citation2012). These errors assumed to be normally distributed are quantified in terms of Mean Error (ME) and the RMS widely adopted in DEMs vertical accuracy evaluation (Du et al. Citation2015; Varga and Bašić Citation2015; Mukul, Srivastava, and Mukul Citation2016).
To evaluate the influence of outliers on statistical analysis, the potential error sources (outliers and gross errors) that could degrade the DEM’s accuracy needed to be excluded. Outliers defined as errors that are more than three times greater than RMS (so called 3-sigma rule) were removed from the raw residual data set in many studies (Aguilar, Agüera, and Aguilar Citation2007; Li et al. Citation2013; Du et al. Citation2015; Varga and Bašić Citation2015; Mukul, Srivastava, and Mukul Citation2016). Another kinds of outliers were removed before analysis. For instance, abnormal negative elevation values (less than −100 m) were removed. Also, the differences between DEM elevation and GCPs larger than 100 m were removed. These were assumed to be returns from cloud tops (Carabajal and Harding Citation2006; Du et al. Citation2015). Not all of the outliers can be detected in this way and the DEM accuracy measures (ME and RMS) will therefore be inaccurate (Höhle and Höhle Citation2009; Alidoost and Samadzadegan Citation2013). They mentioned that the best methods based on outlier removal do not achieve the performance of robust methods, because the latter are able to apply a more smooth transition between accepting and rejecting an observation. Thus, Robust methods developed by Höhle and Höhle (Citation2009) were applied in this study for the assessment of DEM accuracy. If the data reveal non-Gaussian distribution, the following accuracy measures are usually used to describe the properties of the dataset ().
Table 3. Robust accuracy measures for DEMs proposed by Höhle and Höhle (Citation2009).
The median (50% quantile) is a robust estimator for a systematic shift of the DEM. It is less sensitive to outliers in the data than the mean error and provides a better distributional summary for skew distributions (Höhle and Höhle Citation2009).
The Normalized Median Absolute Deviation (NMAD) is proportional to the median of the absolute differences between vertical errors and the median error. It can be considered as an estimate for the Standard Deviation (STD) more resilient to outliers in the dataset (Höhle and Höhle Citation2009; Alidoost and Samadzadegan Citation2013).
The 95% sample quantile of vertical errors literally means that 95% of the errors have a magnitude within the interval [0, Q (0.95)]. The remaining 5% of the errors can be of any value making the measure robust against up to 5% blunders ((Höhle and Höhle Citation2009).
In order to describe and compare the error distributions in each DEM, a normality test is made. There exist many methods to investigate whether data originate from a normal distribution among which quantile-quantile plots (Q-Q plots) and statistical tests. The statistical tests are often rather sensitive in case of large data sets or outliers (Höhle and Höhle Citation2009). Thus, the Q-Q plot which generates the visual inspection of normality is preferred in this study. Höhle and Höhle (Citation2009) strongly recommended visual methods for investigating normality.
The Q-Q plot is a scatter plot with the quantiles of the observed values on the horizontal axis and the expected normal value on the vertical axis. A dataset with a best-fit linear relationship indicated that the observed values were normally distributed (Höhle and Höhle Citation2009).
Again, vertical accuracy evaluation was analyzed by land-cover types to look for the impact of land cover on the DEM’s performances. Thus, GCPs were classified into different land cover and statistics were evaluated within each class. The land cover associated with each GCP was determined by intersecting the GCPs locations with the ESA’s open access GlobCover 2009 map (Bontemps et al. Citation2011). The latter is based on ENVISAT-MERIS observations (Defourny et al. Citation2009), with 300 m ground resolution and with 22 land cover global classes (Arino et al. Citation2007; Li et al. Citation2016). Before using the GlobCover 2009 map, it was resampled to build a mask in order to agree with the 30 m DEM using a nearest neighbor scheme. For understanding effect of land use and land cover on DEM accuracy, the 22 land cover global classes of the GlobCover 2009 (Bontemps et al. Citation2011; Li et al. Citation2012, Citation2013, Citation2016) were aggregated into five broad classes, such as cultivated areas, forests and woodlands, shrub and herbaceous lands, water bodies and aquatic vegetation and built up. It is to be noted that 17.69% area is under cultivated areas (agriculture and cropland), 69.15% under forests and woodland, 11.23% under shrub and herbaceous lands and 2.88% under water bodies. More details are indicated in .
Table 4. Composition of five land cover groups with label, ID and their percentage over Cameroon.
Finally, the DEM’s vertical accuracy is also evaluated in function of topography roughness which is one of the major influencing factors of vertical accuracy of DEMs. GCPs were segmenting in classes for slope (0° to 2°, 2° to 5°, 5° to 10°, >10°). Slope is a terrain attribute that represents the magnitude of the terrain inclination and is a measure of the change of elevation over a horizontal distance (Varga and Bašić Citation2015). Slope maps were calculated for all tested global DEMs using the spatial analyst tool within ArcGIS 9.3 software. From the slope maps, slope values were bilinearly interpolated for all the GCPs.
5. Results and discussion
5.1. Geolocation error estimation
Due to the lack of the reference DEM over Cameroon, the precise latitude/longitude true GCPs are used to estimate the geolocation errors. presents the statistics of the geolocation errors of the three tested global DEMs. It shows that geolocation errors significantly influence the vertical accuracy of global DEMs. In fact, the shifted version of all global DEMs produces a significantly better agreement with the benchmarks than the originally given models. The results show that for SRTM 1, the RMS was reduced from 19.99 to 19.39 m after georeferncing with + 1 arc-second as shift in latitude and + 1.5 arc-seconds the shift in the longitude. The biggest difference between the unshifted and shifted models was with ASTER GDEM2, where the RMS was reduced from 26.8 to 24.2 m after georeferencing for + 2 arc-seconds the shift in latitude and + 2 arc-seconds the shift in longitude. Positive values indicate a shift to the North for latitude or East for longitude. The results confirmed previous findings, indicating that geolocation errors degrade the vertical accuracy of global DEMs (e.g. Denker Citation2005; Rodriguez et al. Citation2005; Abrams et al. Citation2010; Hirt, Filmer, and Featherstone Citation2010; Tachikawa et al. Citation2011; Mukherjee et al. Citation2013; Müller et al. Citation2014; Rexer and Hirt Citation2014; Varga and Bašić Citation2015; Mukul, Srivastava, and Mukul Citation2016; Hu et al. Citation2017).
Table 5. Horizontal shift of global DEMs against reference benchmarks with vertical accuracy before and after georeferencing.
5.2. Statistical comparison among the three DEMs
After performing the geolocation assessment, the three models are compared respectively to one another in order to show how they fit to each other, to access random and significant systematic errors or outliers among the elevation data each of them contains (Hilton et al. Citation2003; Hirt, Filmer, and Featherstone Citation2010; Rexer and Hirt Citation2014; Li et al. Citation2016). Thus, the grid differences between models were calculated at identical points in all combinations of models. The latter comprises AW3D30-ASTER, AW3D30-SRTM and SRTM-ASTER.
The descriptive statistics of all combinations summarized in are shown in terms of mean error, STD error and RMS. STD and RMS reveal the surface quality and indicate the distribution of deviations on the side of the mean value.
Table 6. Statistics of the model-to-model comparison (unit: meter).
The model to model comparison is based in the difference mean error since it provides information about systematic error bias (underestimation (negative) or overestimation (positive)) from the assumed true surface of global DEMs. shows that, the statistics of AW3D30-SRTM are very similar with positive bias of 0.10 m and 5.30 m as RMS relative to AW3D30 over Cameroon. This means that SRTM heights are below to AW3D30 heights. Likewise, AW3D30-ASTER and SRTM-ASTER approximately have the same statistics. The positive bias of 3.30 m and 3.10 m respectively for AW3D30-ASTER and SRTM-ASTER combinations show that ASTER heights are below to AW3D30 and SRTM respectively. Large RMS values are observed for AW3D30-ASTER (18.50 m) and SRTM-ASTER (18.20 m). This is mainly owing to the elevation error caused by cloud contamination for the ASTER GDEM 2 and then C-band SRTM 1 stacked with contaminated information during the filling of larger areas of missing data or voids with other sources of elevation data (Li et al. Citation2016).
As far as the visual analysis is concerned, the (dis)-agreement among the models is shown for each tile in . Some systematic biases are exhibited particularly in the in wet forests areas situated in the south of Cameroon for AW3D30-ASTER and SRTM-ASTER combinations. This indicates that the source of the discrepancy effects is in ASTER. This observation reflects the fact that ASTER GDEM 2 is a ‘first return’ system, while radar return gives the elevations within the vegetation canopy rather than at the top, particularly at the SRTM C-band (Li et al. Citation2016). The SRTM C-band has significantly better penetrability than SRTM X-band, but all of them rely on knowledge of vegetation type, density and structure to a large extent (Carabajal and Harding Citation2005; Hofton et al. Citation2006; Farr et al. Citation2007; Li et al. Citation2016). The reason of the significant differences in all DEMs in rugged terrain or in wet forests areas could be related to the signal omission. The latter was found by Hirt, Filmer, and Featherstone (Citation2010); Rexer and Hirt (Citation2014) to be the main cause for the considerable differences observed among the DEMs.
Figure 2. Results of the model-to-model comparisons over Cameroon territory (a) AW3D30-ASTER (b) AW3D30-SRTM 1 (c) SRTM1-ASTER. The (dis)-agreement among the models can be observed. Units are in meters and projection is UTM.
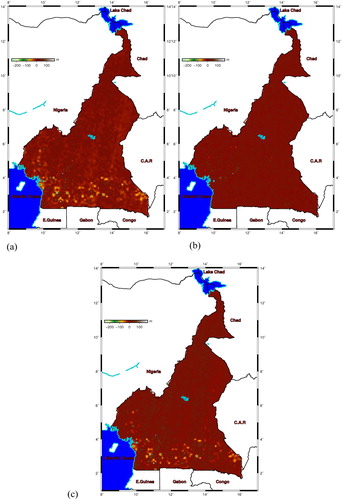
Moreover, the AW3D30-SRTM combination exhibits a very good agreement (RMS <5.30 m) which reflects the good quality of the two data sets over Cameroon. This corroborates the statistical analyses obtained previously. Hu et al. (Citation2017) also found that AW3D30 is very closest to SRTM 1. However, significant discrepancies are not visible around the northern parts of Cameroon where the topography is relatively flat. All DEMs are accurate in these areas.
5.3. Vertical assessment using geodetic GCPs: effect of outliers on DEM accuracy
The vertical assessment was done, assuming in the first time a normal distribution of the vertical errors (differences between heights from the tested DEMs and heights from the GCPs). This assessment was quantified in terms of Mean error, RMS and STD of the vertical errors. The results of the DEM vertical assessment, as function of outliers are summarized in . These outliers were removed from the raw residual data set by applying the 3-sigma rule as implemented by Li et al. (Citation2013); Varga and Bašić (Citation2015); Du et al. (Citation2015). It is obvious that the outliers have a great influence on DEM accuracy. The RMS value of AW3D30 dropped from 19.58 m to 13.06 m after removing outliers and shows the best fit to all GCPs. Likewise, the RMS of SRTM 1 and ASTER dropped from 19.39 m and 24.47 m to 13.25 m and 18.87 m respectively. The result obtained after removing outliers for SRTM 1 is consistent with that of Amans, Beiping, and Ziggah (Citation2013) in Nigeria (Ondo State) which found the RMS of ± 14.48 m for SRTM Ver 4.1.
Table 7. Statistics of the elevation differences between global DEMs and GCPs with the assumption of normal distribution in function of outliers (unit: meter).
The overall accuracies in term of RMS of the three studied global DEMs (13.06 m, 13.25 m and 18.87 m respectively for AW3D30, SRTM 1 and ASTER GDEM2) slightly meet higher compared to error specified in the validation reports of the different nodal agencies (AW3D30 (5 m, Takaku, Tadono, and Tsutsui Citation2014); SRTM (LE90 error of 16 m corresponding to RMSE ∼10 m, Rodriguez, Morris, and Belz Citation2006) and ASTER GDEM2. These critical limitations of the performances may be attributed to a large extent on heterogeneous characteristics of the study area (mountainous areas with steep relief, wet forests areas, land uses, etc …) and noise or ‘speckle’ (Rodriguez, Morris, and Belz Citation2006). These limitations could also be related to additional effects of systematic errors, such as ‘striping,’ that are a result of the pitch and yaw of the spacecraft during the data collection phase. Mukul, Srivastava, and Mukul (Citation2015) argued that regions with heavy vegetation canopy, calm water bodies and heavy radar shadows failed to produce elevation data due to the limitations of the radar and produced data ‘voids’. They added that, the voids in the SRTM data were corrected either through interpolation or by filling with data from other sources.
Furthermore, the unexpected high differences of AW3D30 with respect to the official specification (5 m, Takaku, Tadono, and Tsutsui Citation2014) can be explained by the fact that, AW3D30 is the surface or canopy heights without subtracting the tree heights from image matching (Hu et al. Citation2017) particularly in the region like Cameroon where 69.15% of territory is under forests and woodland land cover. Also, the process using to obtain AW3D30 (down-resampling procedure from a resolution of 5 m mesh to a 30 m grid using window averaging method) has a great influence on the quality of resultant DEM, especially in the steep rugged terrain. Again, the less accuracy of AW3D30 is due to the lack of data stacks which can mitigate blunders of the image matching or missing masks (Takaku, Tadono, and Tsutsui Citation2014).
For the entire study region, AW3D30 has been found to be more accurate compared to SRTM 1 and ASTER GDEM2 after removing outliers when comparing their RMS values. Mukul, Srivastava, and Mukul (Citation2016) stated that, removal of outliers before use of all DEMs in general and SRTM data in particular is absolutely essential to get the SRTM datasets close to the SRTM RMS goal of ∼10 m as well as for statistically meaningful results.
Vertical errors in ASTER GDEM 2 show a negative mean error of −6.27 m and −6.16 m before and after removing outliers respectively. These indicate that the ASTER GDEM 2 underestimates the spatial distribution of terrain heights over Cameroon. Previous studies reported an overall negative bias for ASTER GDEM 2 with respect to GCPs (Hirt, Filmer, and Featherstone Citation2010; Gesch et al. Citation2012; Alidoost and Samadzadegan Citation2013; Li et al. Citation2013, Citation2016; Athmania and Achour Citation2014; Jain et al. Citation2017). Also, slight negative bias is observed before (−0.70 m) and after removing outliers (−0.10 m) for AW3D30. The negative mean error for AW3D30 obtained in this study was confirmed by the validation of AW3D30 DSM datasets conducting in Japan area and another foreign countries (Tadono et al. Citation2016) showing a mean error of −0.44 m in these areas.
SRTM 1 errors show negative mean values of −0.18 m with outlier-included. They show positive mean values of 0.54 m after removing outliers. The previous studies (Athmania and Achour Citation2014; Rexer and Hirt Citation2014; Varga and Bašić Citation2015; Mukul, Srivastava, and Mukul Citation2016) further confirmed the positive mean values of SRTM, but debated by Pakoksung and Takagi (Citation2016); Li et al. (Citation2013); Zhao, Xue, and Ling (Citation2010) who did not find a positive bias for SRTM. Kolecka and Kozak (Citation2013) believed that the different mean values signs in various SRTM studies can be related to regional differences in terrain morphology or to differences in land cover (e.g. presence of forests).
5.4. Error distribution and robust accuracy measures
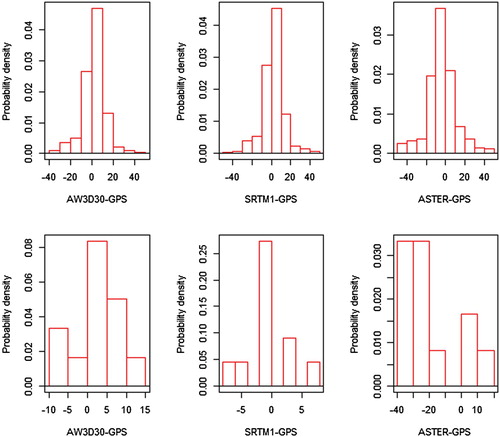
shows the Q-Q plots for the distribution of the error datasets of AW3D30, SRTM 1 and ASTER GDEM 2 over Cameroon. These Q-Q plots exhibit a sigmoid-type function with strong deviation from the straight line for all tested global DEMs. These plots indicate that the test of the normality rejected the hypothesis of normal distribution. The strong deviation of error dataset from the 95% confidence limits, even after removing some outliers, confirms the presence of gross non-eliminated errors in the data. These observations were confirmed in many previous studies (Höhle and Höhle Citation2009; Athmania and Achour Citation2014; Varga and Bašić Citation2015).
shows that the vertical errors are not normally distributed for all the tested DEMs. Thus, the additional analysis through robust statistical measures has to be performed in order to sufficiently get clearer picture about the accuracy of the data and to prohibit the strong influence of outliers in the final results (Müller et al. Citation2014). For the robust measures the entire dataset including the outliers is assessed. The results of the additional analysis are summarized in . These results show that in the case of ASTER GDEM 2, the median of the vertical errors is −5.05 m which is a robust measure to prove the existence of the negative systematic shift. This confirms the previous findings of negative bias (−6.16 m) for ASTER GDEM 2 with respect to GCPs.
Figure 3. Q-Q plots for the Cameroon territory showing the error distribution (a) AW3D30 (b) SRTM 1 (c) ASTER GDEM 2. The solid and dashed red lines represent theoretical normal distribution and 95% confidence intervals, respectively.
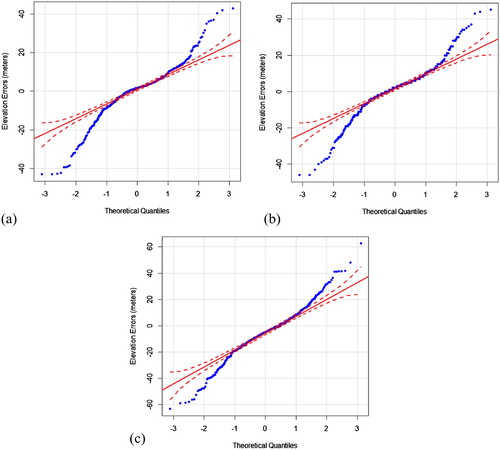
Table 8. Accuracy measures of the robust methods (unit: meter).
In the SRTM 1-GPS dataset, the mean error (0.54 m) obtained after removing outliers and median (2.00 m) differ by 1.46 m while the STD (13.25 m) and NMAD (7.41 m) differ by 5.84 m. Likewise, AW3D30 shows positive median (1.64 m) and negative bias after removing outliers (−0.10 m) while the STD (13.07 m) and 68.3% quantile (4.13 m) differ by 8.94 m. All these observations illustrate the problem of the 3-sigma rule to remove outlier in a non-normal distribution of data.
The results of comparison between NMAD and 68.3% quantile in SRTM 1-GPS (7.41 m and 5.00 m) and AW3D30-GPS (7.75 m and 4.13 m) are about the same in both datasets. Relative to the RMS errors, the same correlations are observed for the both datasets (SRTM 1-GPS and AW3D30-GPS) before removing outliers (19.39 m and 19.58 m) and after removing outliers (13.25 m and 13.07 m). These values supply some evidence of the good quality of the both datasets over Cameroon. Also, the 95% errors of AW3D30-GPS dataset have a magnitude in meters within the interval [0, 17.33], [0, 20.00] for SRTM 1-GPS, while it is [0, 23.27] for ASTER-GPS.
Though the NMAD value of AW3D30 (7.75 m) is slightly different from that of SRTM (7.41 m), the more accurate values of the three others accuracy measures (MED, 68.3% quantile, 95% quantile) for AW3D30 with respect to GCPs show that it is more representative of the external topography over Cameroon in comparison with SRTM 1 and ASTER GDEM 2.
5.5. Effect of land cover on DEM accuracy
Statistical analyses of the correlation between three tested DEMs and GCPs as a function of land cover across the Cameroon are summarized in .
Table 9. Statistical analyses of the three DEMs heights (AW3D30, SRTM 1 and ASTER) relative to GCPs as a function of different land cover groups (unit: meter).
Results from reveal that RMS, STD, mean error, MED and NMAD strongly vary in different land cover group. In all global DEMs, the biggest RMS and NMAD values are observed in the areas where GCPs are located in forests (vegetation woods/trees) and in vegetation shrubs. The smallest RMS for all global DEMs are found in the artificial surface and wetlands. All these observations suggest that the canopy, either forest or vegetation, influences elevation accuracy in all of the three assessed DEMs. These are very similar to that reported by Varga and Bašić (Citation2015); Szabó, Singh, and Szabó (Citation2015); Li et al. (Citation2016) and Hu et al. (Citation2017).
5.5.1. Effect of forests and vegetation shrubs on DEM accuracy
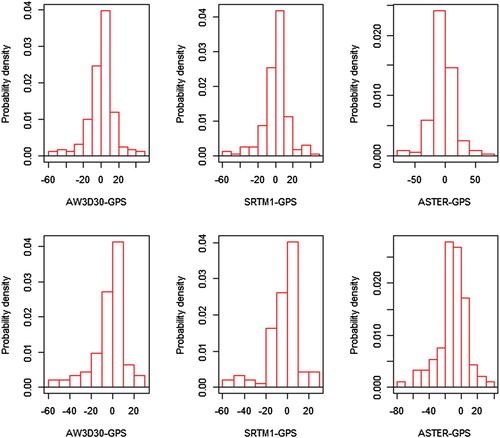
More than 50% of the territory under study is occupied by forests and woodlands, shrub and herbaceous lands which have been estimated to be 69.15% and 11.23% respectively. In the forests and woodlands areas, the vertical DEM accuracy indicates RMS and NMAD of (15.07 m and 10.38 m), (14.87 m and 9.13 m) and (20.03 m and 14.43 m) respectively for AW3D30, SRTM 1 and ASTER GDEM 2. In the shrub and herbaceous lands, the RMS and NMAD of the vertical errors respectively for AW3D30, SRTM 1 and ASTER GDEM 2 are (15.67 m and 11.37 m), (15.87 m and 11.00 m) and (21.34 m and 13.02 m). All the three DEMs have been over-predicting values in the forest and shrub regions. The same observations have been done by the previous studies (Sun et al. Citation2003; Hu et al. Citation2017; Jain et al. Citation2017). SRTM 1 exhibits the best values of RMS and NMAD in the two land cover classes compared to the other DEM despite its slight higher value of RMS (15.87 m) in comparison with AW3D30 (15.67 m) in the last cover class. This is due to the capability of SRTM C-band based in the radar method to penetrate the vegetation and to reach it in the middle of the canopy (Gesch et al. Citation2012; Hu et al. Citation2017). ASTER GDEM 2 and AW3D30 are obtained by optical method and are basically the ‘first return’ that only record the canopy. In forests, shrub and herbaceous lands, SRTM 1 is more representative of the external topography over Cameroon. The higher negative mean values observed in the shrub and herbaceous lands for all the tested DEMs were surprising since higher negative mean errors were expected for forests and woodlands areas. While the elevation bias (0.71 m) found in SRTM 1 is low, this positive value is consistent with the bias effect of above-ground features in the forests and woodlands land cover group. Histograms showing frequency of vertical error in DEMs with respect to GCPs were plotted as shown in (a–f) indicating AW3D30 (a, b), SRTM 1 (c, d) and ASTER GDEM 2 (e, f) respectively in forests and vegetation shrub lands.
Figure 4. (a–f) Vertical error histogram for AW3D30 (a, b), SRTM 1 (c, d) and ASTER GDEM 2 (e, f) respectively in forests and vegetation shrub lands.
5.5.2. Effect of cultivated areas and built up on DEM accuracy
The cultivated areas (agriculture and cropland) and built up represent respectively 17.69% and 0.05% area under study. The results of the assessment in these land-cover types reveal that RMS and NMAD values of the three tested DEMs are found to be lower in built-up and cultivated areas than those in areas covered by forests, woodlands, shrub and herbaceous lands. Comparing with GCPs in cultivated areas and built up, AW3D30 and SRTM 1 show positive elevation biases. This may be due to the fact that, SRTM 1, AW3D30 consider surface heights which include vegetation cover, building heights and other surface features present in the study area (Farr et al. Citation2007; Hirt, Filmer, and Featherstone Citation2010; Jain et al. Citation2017) whereas GCPs used for accuracy assessment are collected on ground level. The negative mean errors are observed for ASTER GDEM 2 in cultivated and built up areas. This DEM has been under-predicting values in these areas. This underestimation of ASTER GDEM 2 for cultivated areas and open land was also observed by Jain et al. (Citation2017) and Mukherjee et al. (Citation2013). The RMS and NMAD of the vertical errors in the cultivated area respectively for AW3D30, SRTM 1 and ASTER GDEM 2 are (10.91 m and 6.22 m), (11.25 m and 6.23 m) and (15.54 m and 11.30 m). Also, in built up areas, the RMS and NMAD values for AW3D30, SRTM 1 and ASTER GDEM 2 are respectively (6.73 m and 5.10 m), (3.41 m and 3.03 m) and (25.33 m and 9.56 m). Histograms showing frequency of vertical error in DEMs with respect to GCPs were plotted as shown in (a–f) indicating AW3D30 (a, b), SRTM 1 (c, d) and ASTER GDEM 2 (e, f) respectively in cultivated areas and built up areas. AW3D30 and SRTM 1 are more resilient to the effects of the scattering objects respectively in cultivated and built up areas and are more representative of the external topography over Cameroon in these areas.
Figure 5. (a–f) Vertical error histogram for AW3D30 (a, b), SRTM 1 (c, d) and ASTER GDEM 2 (e, f) respectively in cultivated areas and built up areas.
5.5.3. Effect of water bodies on DEM accuracy
Statistical analysis shows that AW3D30, SRTM 1 and ASTER GDEM 2 have (2.21 m and 2.98 m), (2.86 m and 15.12 m) and (9.00 m and 41.89 m) of NMAD and RMS respectively, near water bodies. All the three DEMs have been found with low accuracy near waterbodies when comparing their NMAD with those of other land cover types but higher value of RMS (41.89 m) for ASTER GDEM 2. The accuracy of AW3D30 is better than ASTER GDEM 2 and SRTM 1 in water areas. Mean error and MED of (2.72 m and 2.8 m), (−4.78 m and 1.99 m) and (1.51 m and −5.01 m) were obtained from the datasets of AW3D30, SRTM 1 and ASTER GDEM 2 respectively near water bodies which indicate that SRTM 1 is under predicting elevation values whereas AW3D30 and ASTER GDEM 2 predicting higher elevation values.
5.6. Effect of slope classes on DEM accuracy
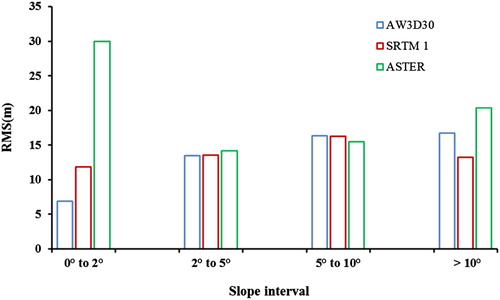
Since the vertical accuracy of global DEMs is more affected by the terrain roughness (Mukherjee et al. Citation2013; Szabó, Singh, and Szabó Citation2015; Varga and Bašić Citation2015; Jain et al. Citation2017), its influence on DEMs vertical accuracy was analyzed. Statistical analyses of the correlation between three tested DEMs and GCPs as a function of terrain slope across Cameroon are summarized in . From this table, the dependency of accuracy on the terrain slope is evident. With the increase of slope, RMS and NMAD values of all global DEMs generally increase except slope class 0° to 2° in ASTER GDEM 2. These observations were also done by Jain et al. (Citation2017) and Varga and Bašić (Citation2015). The slopes that are greater than 10° raise the RMS of all global DEMs to more than 13 m. It is seen that RMS and NMAD of AW3D30, SRTM 1 and ASTER GDEM 2 are respectively (6.92 m and 3.42 m), (11.82 m and 7.00 m) and (30.00 m and 15.50 m) at terrain with a slope less than 2°. The overall accuracies in term of RMS of AW3D30 (6.92 m) and SRTM 1 (11.82 m) slightly meet the error specified in the validation reports of the different nodal agencies (AW3D30 (5 m, Takaku, Tadono, and Tsutsui Citation2014) and SRTM (LE90 error of 16 m corresponding to RMS∼10 m, Rodriguez, Morris, and Belz Citation2006)) when the slope is less than 2°.
Table 10. Statistical analyses of discrepancies in vertical elevation of the three DEMs (AW3D30, SRTM 1 and ASTER) relative to GCPs as a function of different slope intervals (unit: meter).
RMS and NMAD values were lowest for AW3D30 in all the slope intervals followed by SRTM 1. This reflects the good quality of SRTM 1 and AW3D30 in comparison to ASTER GDEM 2.
While analyzing MED, NMAD and RMS values for different slope intervals, it is observed that AW3D30 is performing better than SRTM 1 and ASTER GDEM 2 over Cameroon.
In order to interpret more easily the effect of slope on DEM accuracy, the histogram showing RMS of vertical error in different DEMs with respect to GCPs was plotted as shown in .
Figure 6. Histogram showing RMS of vertical error as a function of slope.
6. Conclusion
The aim of this paper was the evaluation of the vertical accuracy of three publicly accessible latest high-spatial resolution (30 m) global DEMs (AW3D30, SRTM 1 C-Band and ASTER GDEM 2) over Cameroon using external independent ground data. The review of all the models used and the data preparation were done. Then, horizontal positional accuracy evaluation was carried out and it shows that geolocation errors significantly influence the vertical accuracy of global DEMs. The biggest difference between the unshifted and shifted models was with ASTER GDEM2, where the RMS was reduced from 26.8 to 24.2 m after georeferencing. After this, the three models were compared respectively to one another where systematic errors are exhibited particularly in the wet forests areas in all combinations. Moreover, the AW3D30-SRTM combination exhibits a very good agreement which reflects the good quality of the two datasets over Cameroon. For better analysis, robust statistical measures, normality test of vertical errors through the visual inspection approach (Q-Q plots) and outlier detection and removal were investigated. The test of the normality rejected the hypothesis of normal distribution for all tested global DEMs. Overall vertical accuracies obtained for the three models after georeferencing and gross error removal in terms of RMS and NMAD over Cameroon are: AW3D30 (13.06 m and 7.75 m), SRTM 1 (13.25 m and 7.41 m) and ASTER GDEM 2 (18.87 m and 13.30 m). Others accuracy measures (MED, 68.3% quantile, 95% quantile) supply some evidence of the good quality of AW3D30 over Cameroon while it exceeds mission specifications. Vertical accuracy was also evaluated in function of land-cover types and topography slope to look for their impact on the DEM’s performances. All models have proved to be worse in the areas dominated by forests (vegetation woods/trees) and vegetation shrubs areas. However, SRTM 1 and AW3D30 are more resilient to the effects of the scattering objects respectively in forests and cultivated areas. Likewise, the dependency of DEMs accuracy on the terrain roughness is evident. The vertical accuracy was examined for different slope classes. It was observed that AW3D30 is performing better than SRTM 1 and ASTER GDEM 2 over Cameroon.
When the slope is less than 2°, the overall accuracies in term of RMS of AW3D30 and SRTM 1 slightly meet the error specified in the validation reports of the respective nodal agencies. This means that the limitations of the DEMs performances over Cameroon may be attributed to the morphological parameters as terrain roughness associated to the wet forests and vegetation.
Considering the effect of land cover and slope on DEM vertical accuracy and the presence of large and systematic errors in DEMs datasets, AW3D30 is more representative of the external topography over Cameroon in comparison with two others datasets and SRTM 1 can be a serious alternative to AW3D30 for a range of DEM applications in Cameroon.
Despite the good quality of SRTM 1 and AW3D30 compared to ASTER GDEM 2 over Cameroon, the DEM that will be produced from stereoplotting over the country during the ongoing mapping project will probably be of better accuracy than these DEMs datasets.
Further study is under preparation to evaluate the effect of the latest high-resolution (30 m) global DEMs and the influence of the grid size of DEMs on the residual component of geoid undulations in the frame of an ongoing project, aiming to compute the new gravimetric geoid model over Cameroon.
Acknowledgements
We are grateful to the Cameroonian Minister of State Property, Survey and Land Tenure, for providing the Modern Geodetic Network data set. Figures in this paper were produced by using Generic Mapping Tools (GMT). We also wish to thank the anonymous reviewers for constructive comments.
Disclosure statement
No potential conflict of interest was reported by the authors.
ORCID
Loudi Yap http://orcid.org/0000-0002-2790-1373
References
- Abrams, M., H. Bailey, H. Tsu, and M. Hato. 2010. “The Aster Global DEM.” Photogrammetric Engineering and Remote Sensing 76 (4): 344–348.
- Aguilar, F. J., F. Agüera, and M. A. Aguilar. 2007. “A Theoretical Approach to Modeling the Accuracy Assessment of Digital Elevation Models.” Photogrammetric Engineering and Remote Sensing 73 (12): 1367–1379. doi:10.14358/PERS.73.12.1367.
- Alidoost, F., and F. Samadzadegan. 2013. “Statistical Evaluation of Fitting Accuracy of Global and Local Digital Elevation Models in Iran.” International Archives of the Photogrammetry, Remote Sensing and Spatial Information Sciences XL-1/W3: 19–24. doi: 10.5194/isprsarchives-XL-1-W3-19-2013
- Amans, O. C., W. Beiping, and Y. Y. Ziggah. 2013. “Assessing Vertical Accuracy of SRTM Ver. 4.1 and ASTER GDEM Ver. 2 Using Differential GPS Measurements – Case Study in Ondo State, Nigeria.” International Journal of Scientific and Engineering Research 4 (12): 523–531.
- Arino, O., D. Gross, F. Ranera, L. Bourg, M. Leroy, P. Bicheron, J. Latham, et al. 2007. “GlobCover: ESA Service for Global Land Cover From MERIS.” IEEE International Geoscience and Remote Sensing Symposium, Barcelona, Spain, 23-28 July 2007.
- ASTER (Advanced Spaceborne Thermal Emission and Reflection Radiometer) validation team. 2009. “ASTER global DEM validation summary report. ASTER GDEM Validation Team: METI, NASA and USGS in cooperation with NGA and other collaborators.” https://lpdaac.usgs.gov.
- Athmania, D., and H. Achour. 2014. “External Validation of the ASTER GDEM2, GMTED and CGIAR-CSI- SRTM v4.1 Free Access Digital Elevation Models (DEMs) in Tunisia and Algeria.” Remote Sensing 6: 4600–4620. doi: 10.3390/rs6054600
- Azzaro, R., S. Branca, K. Gwinner, and M. Coltelli. 2012. “The Volcano-Tectonic Map of Etna Volcano, 1:100.000 Scale: an Integrated Approach Based on a Morphotectonic Analysis From High-Resolution DEM Constrained by Geologic, Active Faulting and Seismotectonic Data.” Italian Journal of Geosciences 131 (1): 153–170. doi:10.3301/IJG.2011.29.
- Bisson, M., C. Spinetti, N. Marco, and A. Bonforte. 2016. “Mt. Etna Volcano High-Resolution Topography: Airborne LiDAR Modelling Validated by GPS Data.” International Journal of Digital Earth 9: 710–732. doi:10.1080/17538947.2015.1119208.
- Bontemps, S., P. Defourny, E. Van Bogaert, O. Arino, V. Kalogirou, and J. Ramos Perez. 2011. “GLOBCOVER 2009: Products Description and Validation Report.” http://due.esrin.esa.int/globcover/LandCover2009/GLOBCOVER2009_Validation_Report_2.2.pdf, 53 pages.
- Brunt, K. M., T. A. Neumann, K. M. Walsh, and T. Markus. 2014. “Determination of Local Slope on the Greenland Ice Sheet Using a Multibeam Photon-Counting Lidar in Preparation for the ICESat-2 Mission.” IEEE Geoscience and Remote Sensing Letters 11 (5): 935–939. http://doi.org/10.1109/LGRS.2013.2282217.
- Burrough, P. A. 1986. “Principles of Geographical Information Systems for Land Resources Assessment.” Geocarto International 1 (3): 54. doi:10.1080/10106048609354060.
- Carabajal, C. C., and D. J. Harding. 2005. “ICESat Validation of SRTM C-Band Digital Elevation Models.” Geophysical Research Letters 32 (22): L22S01. doi:10.1029/2005GL023957.
- Carabajal, C. C., and D. J. Harding. 2006. “SRTM C-Band and ICESat Laser Altimetry Elevation Comparisons as a Function of Tree Cover and Relief.” Photogrammetric Engineering and Remote Sensing 72 (3): 287–298. doi:10.14358/PERS.72.3.287.
- Carme, J. L. 2012. “Le Nouveau Réseau Géodésique National du Cameroun.” Revue XYZ, N°131, 2e trimestre 2012, 37–46.
- Chaieb, A., N. Rebai, and S. Bouaziz. 2016. “Vertical Accuracy Assessment of SRTM Ver 4.1 and ASTER GDEM Ver 2 Using GPS Measurements in Central West of Tunisia.” Journals in Geographical Information Systems 8: 57–64. doi: 10.4236/jgis.2016.81006
- Cook, J., T. Murray, A. Luckman, D. G. Vaughan, and N. E. Barrand. 2012. “A New 100-m Digital Elevation Model of the Antarctic Peninsula Derived From ASTER Global DEM: Methods and Accuracy Assessment.” Earth System Science Data 4: 129–142. doi:10.5194/essd-4-129-2012.
- Croneborg, L., K. Saito, M. Matera, D. McKeown, and J. V. Aardt. 2015. Digital Elevation Models. A Guidance Note on how Digital Elevation Models are Created and Used – Includes key Definitions, Sample Terms of Reference and how Best to Plan a DEM-Mission. Washington, DC: International Bank for Reconstruction and Development.
- de Vente, J., J. Poesen, G. Verstraeten, G. Govers, M. Venmaercke, A. Van Rompaey, M. Arabkhedri, and C. Boix-Fayos. 2013. “Predicting Soil Erosion and Sediment Yield at Regional Scales: Where Do We Stand?” Earth-Science Reviews 127: 16–29. doi:10.1016/j.earscirev.2013.08.014.
- Defourny, P., P. Bicheron, C. Brockmann, S. Bontemps, E. Van Bogaert, C. Vancutsem, J. F. Pekel, et al. 2009. “The First 300 m Global Land Cover Map for 2005 Using ENVISAT MERIS Time Series: a Product of the GlobCover System.” Proceedings of the 33rd International Symposium on Remote Sensing of Environment (ISRSE), Stresa, Italy.
- Denker, H. 2005. “Evaluation of SRTM3 and GTOPO30 Terrain Data in Germany.” In GGSM 2004 IAG International Symposium, edited by C. Jekeli, L. Bastos, and J. Fernandes, 129, 218–223. Berlin: Springer.
- Du, X., H. Guo, X. Fan, J. Zhu, Z. Yan, and Q. Zhan. 2015. “Vertical Accuracy Assessment of Freely Available Digital Elevation Models Over low-Lying Coastal Plains.” International Journal of Digital Earth 9: 252–271. doi:10.1080/17538947.2015.1026853.
- Du, X., H. Guo, X. Fan, J. Zhu, Z. Yan, Q. Zhan, and Z. Sun. 2012. “Flood Modeling and Inundation Risk Evaluation Using Remote Sensing Imagery in Coastal Zone of China.” Geoscience and Remote Sensing Symposium (IGARSS), 2012 IEEE International.
- Farr, T. G., P. A. Rosen, E. Caro, R. Crippen, R. Duren, S. Hensley, M. Kobrick, et al. 2007. “The Shuttle Radar Topography Mission.” Reviews of Geophysics 45 (2): RG2004. doi:10.1029/2005RG000183.
- Federal Geographic Data Committee. 1998. Geospatial Positioning Accuracy Standards, Part 3: National Standard for Spatial Data Accuracy. Subcommittee for Base Cartographic Data, p. 25.
- Foni, A., and D. Seal. 2004. “Shuttle Radar Topography Mission: An Innovative Approach to Shuttle Orbital Control.” Acta Astronautica 54: 565–570. doi: 10.1016/S0094-5765(03)00227-3
- Forkuo, E. K. 2010. “Digital Terrain Modelling in a GIS Environment.” The International Archives of Photogrammetry, Remote Sensing and Spatial Information Sciences 37 (B2): 1023–1029.
- Fujita, K., R. Suzuki, T. Nuimura, and A. Sakai. 2008. “Performance of ASTER and SRTM DEMs, and Their Potential for Assessing Glacial Lakes in the Lunana Region, Bhutan Himalaya.” Journal of Glaciology 54 (185): 220–228. doi:10.3189/002214308784886162.
- Gesch, D., M. Oimoen, Z. Zhang, D. Meyer, and J. Danielson. 2012. “Validation of the ASTER Global Digital Elevation Model Version 2 Over the Conterminous United States.” International Archives of the Photogrammetry, Remote Sensing and Spatial Information Sciences, Volume XXXIX-B4. XXII ISPRS Congress, Melbourne, Australia, 25 August -01 September 2012.
- Greenwalt, C. R., and M. E. Shultz. 1962. Principles of Error Theory and Cartographic Applications. In No. ACIC-TR-96. St. Louis, MO: Aeronautical Chart and Information Center.
- Hamylton, S. M. 2017. “Mapping Coral Reef Environments: A Review of Historical Methods, Recent Advances and Future Opportunities.” Progress in Physical Geography 41 (6): 803–833. doi:10.1177/0309133317744998.
- Hanssen, R. F. 2001. Radar Interferometry: Data Interpretation and Error 562 Analysis. New York: Springer.
- Hedley, J. D., C. M. Roelfsema, I. Chollett, A. R. Harborne, S. F. Heron, S. Weeks, W. J. Skirving, et al. 2016. “Remote Sensing of Coral Reefs for Monitoring and Management: A Review.” Remote Sensing 8: 118. doi: 10.3390/rs8020118
- Hilton, R. D., W. E. Featherstone, P. A. M. Berry, C. P. D. Johnson, and J. F. Kirby. 2003. “Comparison of Digital Elevation Models Over Australia and External Validation Using ERS-1 Satellite Radar Altimetry.” Australian Journal of Earth Sciences 50 (2): 157–168. doi:10.1046/j.1440-0952.2003.00982.x.
- Hirt, C. 2014. Digital Terrain Models. Encyclopedia of Geodesy. doi:10.1007/978-3-319-02370-0_31-1.
- Hirt, C., M. S. Filmer, and W. E. Featherstone. 2010. “Comparison and Validation of the Recent Freely Available ASTER-GDEM ver1, SRTM ver4.1 and GEODATA DEM-9S ver3 Digital Elevation Models Over Australia.” Australian Journal of Earth Sciences 57 (3): 337–347. doi:10.1080/08120091003677553.
- Hofton, M., R. Dubayah, J. B. Blair, and D. Rabine. 2006. “Validation of SRTM Elevations Over Vegetated and non-Vegetated Terrain Using Medium Footprint LIDAR.” Photogrammetric Engineering and Remote Sensing 72: 279–285. doi: 10.14358/PERS.72.3.279
- Höhle, J., and M. Höhle. 2009. “Accuracy Assessment of Digital Elevation Models by Means of Robust Statistical Methods.” ISPRS Journal of Photogrammetry and Remote Sensing 64 (4): 398–406. http://doi.org/10.1016/j.isprsjprs.2009.02.003.
- Hu, Z., J. Peng, Y. Hou, and J. Shan. 2017. “Evaluation of Recently Released Open Global Digital Elevation Models of Hubei, China.” Remote Sensing 9: 262. doi:10.3390/rs9030262.
- Hutchinson, M. F., J. C. Gallant. 2005. “Representation of Terrain.” In Geographical Information Systems: Principles, Techniques, Management and Applications, edited by P. A. Longley, 105–124. Hoboken: John Wiley and Sons.
- Jain, O. A., T. Thaker, A. Chaurasia, P. Patel, and A. K. Singh. 2017. “Vertical Accuracy Evaluation of SRTMDEM-GL1, GDEM-V2, AW3D30, and CartoDEM-V3.1 of 30 m Resolution with Dual Frequency GNSS for Lower Tapi Basin India.” Geocarto International. doi:10.1080/10106049.2017.1343392.
- Kamguia, J., C. T. Tabod, R. Nouayou, J. M. Tadjou, E. Manguelle-Dicoum, and H. L. Kande. 2007. “The Local Geoid Model of Cameroon, CGM05.” Nordic Journal of Surveying and Real Estate Research 4 (2): 7–23.
- Kamguia, J., J. M. Tadjou, and C. Ngouanet. 2015. “The Mount Cameroon Height Determined From Ground Gravity Data, Global Navigation Satellite System Observations and Global Geopotential Models.” Ghana Journal of Science 55 (1): 37–50.
- Kande, L. H., J. Kamguia, L. Yap, and L. Foyang. 2016. “Reference Ellipsoid Parameters of Cameroon From GPS Data.” International Journal of Geosciences 7: 1049–1056. doi: 10.4236/ijg.2016.78079
- Kääb, A. 2005. “Combination of SRTM3 and Repeat ASTER Data for Deriving Alpine Glacier Flow Velocities in the Bhutan Himalaya.” Remote Sensing of Environment 94: 463–474. doi: 10.1016/j.rse.2004.11.003
- Kiamehr, R., and L. E. Sjöberg. 2005. “Effect of the SRTM Global DEM on the Determination of a High-Resolution Geoid Model: A Case Study in Iran.” Journal of Geodesy 79 (9): 540–551. doi:10.1007/s00190-005-0006-8.
- Kolecka, N., and J. Kozak. 2013. “Assessment of the Accuracy of SRTM C- and X-Band High Mountain Elevation Data: a Case Study of the Polish Tatra Mountains.” Pure and Applied Geophysics 171: 897–912. doi:10.1007/s00024-013-0695-5.
- Lenzano, M. G. 2013. “Assessment of Using ASTER-Derived DTM for Glaciological Applications in the Central Andes, Mt. Aconcagua, Argentina.” Photogrammetrie-Fernerkundung-Geoinformation 2013 (3): 197–208. doi:10.1127/1432-8364/2013/0170.
- Li, P., Z. Li, J.-P. Muller, C. Shi, and J. Liu. 2016. “A New Quality Validation of Global Digital Elevation Models Freely Available in China.” Survey Review 48: 409–420. doi:10.1179/1752270615Y.0000000039.
- Li, Z., T. Panpan, Z. Jianmin, T. Bangsen, C. Quan, and Fu Sitao. 2015. “Permafrost Environment Monitoring on the Qinghai-Tibet Plateau Using Time Series ASAR Images.” International Journal of Digital Earth 8 (10): 840–860. doi:10.1080/17538947.2014.923943.
- Li, P., C. Shi, Z. Li, J.-P. Muller, J. Drummond, X.Y. Li, T. Li, Y. B. Li, and J. Liu. 2012. “Evaluation of ASTER GDEM Ver. 2 Using GPS Measurements and SRTM Ver. 4.1 in China.” ISPRS Annals of the Photogrammetry, Remote Sensing and Spatial Information Sciences, I-4, 181–186, Melbourne, August 25–September 1.
- Li, P., C. Shi, Z. H. Li, J.-P. Muller, J. Drummond, X. Y. Li, T. Li, Y. B. Li, and J. N. Liu. 2013. “Evaluation of ASTER GDEM Using GPS Benchmarks and SRTM in China.” International Journal of Remote Sensing 34 (5): 1744–1771. doi:10.1080/01431161.2012.726752.
- Liu, L., L. Jiang, Y. Sun, C. Yi, H. Wang, and H. Hsu. 2016. “Glacier Elevation Changes (2012–2016) of the Puruogangri Ice Field on the Tibetan Plateau Derived From bi-Temporal TanDEM-X InSAR Data.” International Journal of Remote Sensing 37 (24): 5687–5707. doi:10.1080/01431161.2016.1246777.
- Lohr, U. 1998. “Digital Elevation Models by Laser Scanning.” The Photogrammetric Record 16 (91): 105–109. doi: 10.1111/0031-868X.00117
- METI/NASA. 2009. “ASTER Global Digital Elevation Model by Ministry of Economy, Trade and Industry of Japan (METI) and the National Aeronautics and Space Administration (NASA).” http://asterweb.jpl.nasa.gov/gdem.asp and http://www.gdem.aster.ersdac.or.jp/.
- Mukherjee, S., P. K. Joshi, S. Mukherjee, A. Ghosh, R. D. Garg, and A. Mukhopadhyay. 2013. “Evaluation of Vertical Accuracy of Open Source Digital Elevation Model (DEM).” International Journal of Applied Earth Observation and Geoinformation 21: 205–217. doi:10.1016/j.jag.2012.09.004.
- Mukul, M., V. Srivastava, and M. Mukul. 2015. “Analysis of the Accuracy of Shuttle Radar Topography Mission (SRTM) Height Models Using International Global Navigation Satellite System Service (IGS) Network.” Journal of Earth System Science 124 (6): 1343–1357. doi: 10.1007/s12040-015-0597-2
- Mukul, M., V. Srivastava, and M. Mukul. 2016. “Accuracy Analysis of the 2014–2015 Global Shuttle Radar Topography Mission (SRTM) 1 arc-sec C-Band Height Model Using International Global Navigation Satellite System Service (IGS) Network.” Journal of Earth System Science 125: 909–917. doi: 10.1007/s12040-016-0716-8
- Müller, J., I. Gärtner-Roer, P. Thee, and C. Ginzler. 2014. “Accuracy Assessment of Airborne Photogrammetrically Derived High-Resolution Digital Elevation Models in a High Mountain Environment.” ISPRS Journal of Photogrammetry and Remote Sensing 98: 58–69. doi: 10.1016/j.isprsjprs.2014.09.015
- Ouerghi, S., R. F. A. ELsheikh, H. Achour, and S. Bouazi. 2015. “Evaluation and Validation of Recent Freely-Available ASTER-GDEM V.2, SRTM V.4.1 and the DEM Derived From Topographical Map Over SW Grombalia (Test Area) in North East of Tunisia.” Journal of Geographic Information System 7: 266–279. http://doi.org/10.4236/jgis.2015.73021.
- Pakoksung, K., and M. Takagi. 2016. “Digital Elevation Models on Accuracy Validation and Bias Correction in Vertical.” Modeling Earth Systems and Environment 2: 11. doi:10.1007/s40808-015-0069-3.
- Pavlis, E. C., R. H. Rapp, and T. R. Olson. 1998. “The Development of the NASA GSFC and National Imaginary and Mapping Agency (NIMA) Geopotential Model EGM96.” Rep. NASA/TP-1998-206861, National Aeronautics and Space Administration, Maryland, 575 pages.
- Pekel, J.-F., A. Cottam, N. Gorelick, and A. S. Belward. 2016. “High-resolution Mapping of Global Surface Water and its Long-Term Changes.” Nature 540: 418–422. doi:10.1038/nature20584.
- Rebai, N., H. Achour, R. Chaabouni, R. Bou Kheir, and S. Bouaziz. 2013. “DEM and GIS Analysis of sub-Watersheds to Evaluate Relative Tectonic Activity. A Case Study of the North-South Axis (Central Tunisia).” Earth Science Informatics 6: 187–198. doi: 10.1007/s12145-013-0121-7
- Rexer, M., and C. Hirt. 2014. “Comparison of Free High Resolution Digital Elevation Data Sets (ASTER GDEM2, SRTM v2.1/v4.1) and Validation Against Accurate Heights From the Australian National Gravity Database.” Australian Journal of Earth Sciences 61 (2): 213–226. doi:10.1080/08120099.2014.884983.
- Rexer, M., and C. Hirt. 2016. “Evaluation of Intermediate TanDEM-X Digital Elevation Data Products Over Tasmania Using Other Digital Elevation Models and Accurate Heights From the Australian National Gravity Database.” Australian Journal of Earth Sciences 63 (5): 599–609. doi:10.1080/08120099.2016.1238440.
- Rodriguez, E., C. S. Morris, and J. E. Belz. 2006. “A Global Assessment of the SRTM Performance.” Photogrammetric Engineering & Remote Sensing 72: 249–260. doi:10.14358/PERS.72.3.249.
- Rodriguez, E., C. S. Morris, J. E. Belz, E. C. Chapin, J. M. Martin, W. Daffer, and S. Hensley. 2005. An Assessment of the SRTM Topographic Products. NASA Jet Propulsion Laboratory D-31639.
- Santillan, J., and M. Makinano. 2016. “Vertical Accuracy Assessment of 30-M Resolution Alos, Aster, and Srtm Global Dems Over Northeastern Mindanao, Philippines.” ISPRS – International Archives of the Photogrammetry, Remote Sensing and Spatial Information Sciences XLI-B4: 149–156. doi: 10.5194/isprsarchives-XLI-B4-149-2016
- Shingare, P. P., and S. S. Kale. 2013. “Review on Digital Elevation Model.” International Journal of Modern Engineering Research 3: 2412–2418.
- Sun, G., K. J. Ranson, V. I. Kharuk, and K. Kovacs. 2003. “Validation of Surface Height From Shuttle Radar Topography Mission Using Shuttle Laser Altimeter.” Remote Sensing of Environment 88: 401–411. doi: 10.1016/j.rse.2003.09.001
- Szabó, G., S. K. Singh, and S. Szabó. 2015. “Slope Angle and Aspect as Influencing Factors on the Accuracy of the SRTM and the ASTER GDEM Databases.” Physics and Chemistry of the Earth 83–84: 137–145. doi:http://doi.org/10.1016/j.pce.2015.06.003.
- Tachikawa, T., M. Kaku, A. Iwasaki, D. Gesch, M. Oimoen, Z. Zhang, J. Danielson, et al. 2011. ASTER Global Digital Elevation Model Version 2–Summary of Validation Results. Joint Japan–US ASTER Science Team, URL http://www.jspacesystems.or.jp/ersdac/GDEM/ver2Validation/Summary_2_validation_report_final.Pdf.
- Tadono, T., H. Nagai, H. Ishida, F. Oda, S. Naito, K. Minakawa, and H. Iwamoto. 2016. “Initial Validation of the 30 m-Mesh Global Digital Surface Model Generated by ALOS PRISM.” ISPRS – International Archives of the Photogrammetry, Remote Sensing and Spatial Information Sciences XLI-B4: 157–162. doi: 10.5194/isprsarchives-XLI-B4-157-2016
- Takaku, J., T. Tadono, and K. Tsutsui. 2014. “Generation of High Resolution Global DSM From ALOS PRISM.” ISPRS – International Archives of the Photogrammetry, Remote Sensing and Spatial Information Sciences XL-4: 243–248. doi: 10.5194/isprsarchives-XL-4-243-2014
- Takaku, J., T. Tadono, K. Tsutsui, and M. Ichikawa. 2016. “Validation of ‘AW3D’ Global DSM Generated from ALOS PRISM.” ISPRS Annals of Photogrammetry, Remote Sensing and Spatial Information Sciences III-4: 25–31. doi: 10.5194/isprsannals-III-4-25-2016
- U.S. Geological Survey. 2000. HYDRO1k Elevation Derivative Database, Cent. for Earth Resour. Obs. and Sci., Sioux Falls, S. D. http://lta.cr.usgs.gov/products_overview/.
- Varga, M., and T. Bašić. 2015. “Accuracy Validation and Comparison of Global Digital Elevation Models Over Croatia.” International Journal of Remote Sensing 36 (1): 170–189. doi:10.1080/01431161.2014.994720.
- Vassilopouloua, S., L. Hurnia, V. Dietrichb, E. Baltsaviasc, M. Paterakic, E. Lagiosd, and L. Parcharidis. 2002. “Orthophoto Generation Using IKONOS Imagery and High-Resolution DEM: a Case Study on Volcanic Hazard Monitoring of Nisyros Island (Greece).” ISPRS Journal of Photogrammetry and Remote Sensing 57: 24–38. doi: 10.1016/S0924-2716(02)00126-0
- Wadey, M. P., R. J. Nicholls, and C. Hutton. 2012. “Coastal Flooding in the Solent: An Integrated Analysis of Defences and Inundation.” Water 4: 430–459. doi:10.3390/w4020430.
- Wood, J. 2008. “Digital Elevation Model (DEM).” In Encyclopedia of Geographic Information Science, edited by K. Kemp, 107–110. Thousand Oaks, CA: SAGE Publications.
- Zhan, L., G. Tang, and X. Yang. 2010. “Evaluation of SRTM DEMs” Elevation Accuracy: A Case Study in Shanxi Province.” Geographic Information Science 26: 34–36.
- Zhao, G., H. Xue, and F. Ling. 2010. “Assessment of ASTER GDEM Performance by Comparing with SRTM and ICESat/GLAS Data in Central China.” In Proceedings of IEEE 18th International Conference on Geoinformatics, Beijing, 1–5.
- Zwally, H. J., R. Schutz, W. Abdalati, J. Abshire, C. Bentley, J. Bufton, D. Harding, et al. 2002. “ICE Sat’s Laser Measurements of Polar ice, Atmosphere, Ocean, and Land.” Journal of Geodynamics 34 (3-4): 405–445. doi: 10.1016/S0264-3707(02)00042-X