
ABSTRACT
The integration of local measurements and monitoring via global-scale Earth observations has become a new challenge in digital Earth science. The increasing accessibility and ease of use of virtual globes (VGs) represent primary advantages of this integration, and the digital Earth scientific community has adopted this technology as one of the main methods for disseminating the results of scientific studies. In this study, the best VG software for the dissemination and analysis of high-resolution UAV (Unmanned Aerial Vehicle) data is identified for global and continuous geographic scope support. The VGs Google Earth and Sputnik Geographic Information System (GIS) are selected and compared for this purpose. Google Earth is a free platform and one of the most widely used VGs, and one of its best features its ability to provide users with quality visual results. The proprietary software Sputnik GIS more closely approximates the analytical capacity of a traditional GIS and provides outstanding advantages, such as DEM overlapping and visualization for its dissemination.
1. Introduction
At present, geographic information is at its highest level of accessibility because of advancements in technology; thus, users are able to generate, store, provide support and disseminate large volumes of geographic data. The ability of software to represent information from different perspectives, such as small-scale (global) perspectives to magnifications of large-scale locations, enables the interpretation of an object and its environment inside a unique representation model that is dynamically scalable. Blower et al. (Citation2007) defines three fundamental characteristics for an efficient geographic visualization system: (1) the geo-referencing of information, (2) the use of environments that are similar to reality, and (3) the access of information via a simultaneous, continuous and remote method. One of the Virtual Reality (VR) environments that successfully adheres to all the above premises is the Virtual Globe (Yu and Gong Citation2012).
These systems are capable of projecting georeferenced information via online tools, and these data can then be analyzed and disseminated in a virtual geographic environment at a global and continuous level. Scalability is one of the seven premises established by Tuttle, Anderson, and Huff (Citation2008) to explain the success of this technology. With traditional paper map methods of presenting spatial data, the media are locked at one scale; however, with virtual globes (VGs), data may be viewed at any resolution, and the scale can be changed on demand. However, total scalability was not initially available with VGs. Platforms such as Google Earth or World Wind have allowed studies on small scales (global, continental and regional scales) from the first versions. However, a number of years were required to develop efficient algorithms that could handle large volumes of multisource data at the local scale. Google Earth manages very high-resolution datasets, which have enormous potential for local studies, without a loss of comprehensive global Earth surface background information. In parallel with this transformation of traditional VGs, other specific systems, such as Sputnik Geographic Information System (GIS), have led to significant technological advancements in the measurement, monitoring, modelling, analysis and assessment tools available for local datasets.
2. Virtual globes: overview
2.1. Democratizing access to geo-information
VGs were developed based on the convergence of technological expansion, the internet age and artificial terrestrial satellites orbiting Earth, thus marking the beginning of a new paradigm in the method of acquiring images of our planet. VGs offer the possibility of accessing information that is generated in an immediate and remote way (Yu and Gong Citation2012; Harwood, Lovett, and Turner Citation2015) and represent one of the most popular virtual environments for the dissemination of georeferenced information within a short time. VG software is meant to be practical, easy to use and operative in three-dimensional geographic data handling, thus allowing for a total representation of the Earth's surface and integrating geospatial data that are viewable at multiple scales. The efficiency of VG algorithms allows for the handling of a vast amount of information from different sources, and data visualization provides a significant operational advantage for revealing new insights (Yu and Gong Citation2012). The VG concept also incorporates active interactions with digital models and the immersion of the user into augmented reality spaces in certain cases (Gruen Citation2008).
The employment of VG has made a significant contribution to the democratization of geospatial information in both the level of access and the production level of information. As illustrated by Elvidge and Tuttle (Citation2008), the number of people interactively viewing and extracting content from Earth observations, such as satellite imagery, is on a rapid upward trajectory as a result of VGs. Because of the accessibility level of VGs, maps can be generated by any user and immediately distributed to a wide audience via the Web. Current technical users of geo-information can more easily access global cartography and aerial or satellite images compared with the historical methods of accessing these data. This level of access eliminates or reduces the cost and effort of obtaining large amounts of data. However, studies (Jones Citation2011; Blaschke et al. Citation2012) have highlight that this level of access creates challenges when relying on such data to make a decision because the quality of the geospatial dataset can be highly heterogeneous or even unknown. The increasing concern about geographic data quality, especially maps derived from crowdsourced mapping, is justified, and the number of works focused on the analysis of completeness, positional accuracy and attribute accuracy has increased along with this concern (Dorn, Törnros, and Zipf Citation2015; Wiemann et al. Citation2015; Zhang and Malczewski Citation2017).
2.2. A new tool for scientific communication
Currently, VGs represent a method of accessing information and are thus an important tool for the scientific community. Researchers have determined that VGs are more than a visual representation and represent a scientific dissemination. Ballagh et al. (Citation2011) and Tiede and Lang (Citation2010) analyzed the potential for the fusion of specific subject information with geographic information in a VG when presenting scientific results in different scenarios and at scales from global to local. As with any other VR system, the realism, perspective views, and social meanings of landscape visualizations embedded in VGs evoke not only cognition but also emotional and intuitive responses and are associated with issues of uncertainty, credibility, and bias in interpreting the data (Sheppard and Cizek Citation2009).
VGs are used in the development of activities that require functionality in very diverse fields. The common thread among these activities is that all the information represented by VGs belongs and/or refers to a specific geographic location integrated in a global framework. This characteristic does not imply that all information layers should strictly represent cartographic data, although the layers represent such content in the majority of cases. The combined presentation of information is optimal for performing complex analyses and provides insightful methods of communicating science in a manner that is visually energizing, which was supported by an extended thematic range of publications. For example, Stensgaard et al. (Citation2009) analyze the use of a VG for managing the geographic risk factors associated with vector-borne disease control; Liu, Gong, and Yu (Citation2015) implement an interactive visualization of typhoon data in the NASA World Wind VG; Brovelli et al. (Citation2013) use World Wind as a tourism promotion tool as well as a cultural heritage tool; Biradar et al. (Citation2009) use Google Earth to visualize global maps of rain fed cropland areas and to calculate statistics using these data; and Blenkinsop (Citation2012), De Paor and Whitmeyer (Citation2011) and Paraskevas (Citation2011) validate Google Earth as a working tool for data visualization of geological structures. In emerging countries, cartographic information might not exist or it may be scarce or have a restricted use. The use of VG allows for the better management of such territories and their goods, thus complementing existing information and enhancing accessibility (Jacobson et al. Citation2015). The applicability of these systems for multi-temporal studies is also interesting (Patel et al. Citation2015).
2.3. Rapid technological growth
Since the launch of NASA World Wind in 2004, many VR geographical environments have been developed. One of the first VGs available to the market was Earth Viewer 3D. This VG was developed by the company Keyhole Inc. (California, USA), which is specialized in programming software for the visualization of geographic data within the sphere of geosciences. This company has developed and named one of the standard languages used for representing geographic data within their own family environment: KML (Keyhole Mark-up Language). KML is currently the standard language for incoming and outgoing information inside the VG field, and because it complies with OGC (Open Geospatial Consortium) standards, it is an exchange format of geographic information (Blaschke et al. Citation2012). This feature allows it to be interoperable, and the language has become the standard format for the exchange of information in different VGs, and to a greater or lesser degree, all systems have been adapted for its use.
Google Earth, Nokia Ovi 3D, Leica Virtual Explorer, City Surf, ArcGIS Explorer, Bing Maps 3D (formerly Microsoft Virtual Earth) offered by companies such as Google, Nokia, Leica, Piri Reis, ESRI and Microsoft and others from open-source platforms such as Marble or Geoforge are among the most well-known VGs. The initial conception of these products as global tools for information dissemination to a wider public audience has led to these products being offered as free license software or open-source software (Jones Citation2011). However, in certain cases, suppliers have adapted the strategy of commercializing professional versions with improved characteristics that they distribute with licence fees, such as Google Earth Pro, although Google decided to distribute the professional version free of charge in 2015. The solutions developed from the VG NASA World Wind should also be considered because its availability as a free application has allowed for the development of derived VGs (e.g. Virtual Ocean, Geosoft Dappl, PYXIS, WW2D and SERVIR-VIZ).
Google Earth is the most well-known and widely used VG in all types of technical and scientific studies (e.g. Butler Citation2006; Tomaszewski Citation2011; Blenkinsop Citation2012; Yu and Gong Citation2012). This product was initially presented as a parallel search tool to Google Maps that added an attractive visual 3D engine; however, its application has been gradually drifting towards a wider range of use. KML integration in Google Earth popularized its use for visualizing, locating and navigating through geospatial data (Bailey and Chen Citation2011).
2.4. Towards a local scale perspective
Although the VG concept reflects a multiscale system, not all of these tools are orientated towards working with high-resolution data or local scales. First-generation VGs almost always focused on small-scale studies (Bernardin et al. Citation2011; Loesch, Christen, and Nebiker Citation2012; Yu and Gong Citation2012; Ludwig, Meyer, and Nauss Citation2016). The technological evolution and the emergence of new massive geo-information capture techniques, such as UAV-based imagery, have created the need for rapid analysis and data inspection methods; thus, VGs have had to adapt to this new challenge.
Systems such as WallGlobe (Hagen Citation2011) or Norut GeoViz (Stødle, Borch, and Storvold Citation2013) are clear examples of VGs that are able to render large amounts of 3D information, and they were specifically developed for working with high-resolution images. Despite its name, Sputnik GIS (Geoscan, St. Petersburg) is a system that is closer to the VG concept than the GIS concept. The supplier defines this product as a geo-visualization system of multidimensional and multiscale data that includes analytical tools imported from a GIS. User datasets, images and DEMs can be uploaded and displayed in a uniform framework because of the continuous coverage provided by auxiliary layers (e.g. OpenStreetMap, Bing, Landsat or external GIS servers). In addition, the capacity of this VG to work with high-volume information makes it suitable for large-scale tasks. However, most first-generation systems, such as Google Earth, now allow for magnifications to 1 m and for panning across the surface (Goodchild et al. Citation2012). Software have been adapted via the use of clever algorithms and hierarchical tiling structures known as discrete global grids (Sahr, White, and Kimerling Citation2003) to enable rapid magnification, tiles are precalculated on the server to avoid extensive local computations, and sophisticated, level-of-detail management is used to allow the field of view to be refreshed at video rates.
2.5. UAV data integration in virtual globes
The most attractive feature of VGs is likely their extension and adaptation capacities according to user needs. The use of Google's KML language has been standardized as a data importation format in almost all VGs, which allows geo-information data to be readily superimposed on the VG in a variety of formats.
For local terrain data acquisition, the use of UAVs with integrated sensors has gained popularity. The possibility of performing manual, semi-autonomous or autonomous flights is responsible for the ease of use of UAVs. Accordingly, UAV technology is the perfect framework for photogrammetry, which is a common tool used in massive high-resolution image captures.
When geographical data are obtained via UAVs and aerial close-range photogrammetry, integration of digital models and orthophotos in the VG will promote the exploitation of the results at visualization and dissemination levels via interactive navigation, virtual flights (VFs), etc.
The work presented in this paper discusses the use of Google Earth and Sputnik GIS systems for the integration, analysis and dissemination of massive amounts of data captured by sensors aboard UAVs. The integration of high-resolution geo-information is comparatively analyzed to determine the advantages of use in each case.
3. Google Earth versus Sputnik GIS
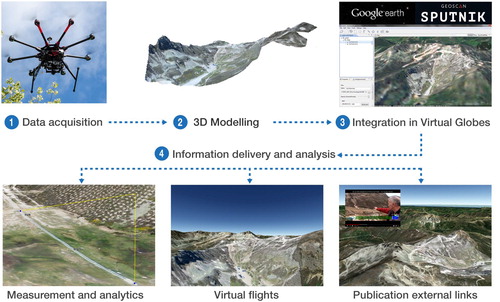
The vast majority of photogrammetric modelling software in the market allows for the exportation of 3D models in a KML format, which is an easily assimilated format by most VGs. Therefore, the first step towards visualizing a model via either Google Earth [version Google Earth Pro-7.1.8.3036; 31 January 2017] or Sputnik GIS [version Sputnik 1.2.6403; 20 February 2017] is KML importation. Once the dataset is imported, comparisons can be established between Google Earth and Sputnik GIS according to the workflow shown in . The information management abilities, the available tools and the virtual flight generation capabilities are analyzed in both cases.
Figure 1. Workflow for UAV data integration in virtual globes.
Other input formats for orthophotos, DEMs and auxiliary geo-information are presented in , which also synthesizes other features related to the input and output of data in both VGs.
Table 1. Technical specifications of Google Earth and Sputnik GIS. [image fit: 1/1.5 columns]
4. Results and discussion
4.1. Data handling in Google Earth and Sputnik GIS
Once the dataset is imported, interactive navigation through the models can be performed, or the models can be explored in different locations. The systems do not present large differences, and both are equipped with the classical rotation tools, angle inclination selectivity tool and zoom tool for 3D exploration. Another common characteristic of Google Earth and Sputnik GIS is the ability to establish position marks as viewpoints, which direct to a specific area. Sputnik GIS has a specific tool for high-resolution screenshots used for high-quality digital printing.
One of the 3D models used to test the capabilities of the VGs is shown in and has been published on an external Web server (Sketchfab). Although the size had to be reduced to 50 Mb for upload, the figure can provide a fair indication of the quality of the model generated from UAV images. The original 3D model derived from a fixed wing UAV flight covers 148.78 ha of the Ski Resort of San Isidro (Spain). The corresponding DEM and orthoimage imported by Google Earth and Sputnik GIS are obtained with GSD (Ground Sample Distance) values of 0.8397 m pix−1.
Figure 2. Model screenshot (3D view available in Sketchfab: https://skfb.ly/EMqH). [image fit: 1.5 columns]
![Figure 2. Model screenshot (3D view available in Sketchfab: https://skfb.ly/EMqH). [image fit: 1.5 columns]](/cms/asset/88ac09e7-9ab2-4357-91af-c37e3aafb583/tjde_a_1470205_f0002_oc.jpg)
The implementation of this model in Google Earth and Sputnik GIS is shown in , where a good fit with the geo-information layers can be observed. This finding verifies the positional aptitude of the model for its integration in VG software. The ability to magnify on specific terrain allows for the identification of small objects, such as plants, stones or road markings, and a clear contrast between the resolution of the models and the base layer was obtained.
Figure 3. 3D model snapshots: rocky hillside and buildings in (a) Google Earth and (b) Sputnik GIS; and mountain peaks in (c) Google Earth and (d) Sputnik GIS. [image fit: 1.5 columns]
![Figure 3. 3D model snapshots: rocky hillside and buildings in (a) Google Earth and (b) Sputnik GIS; and mountain peaks in (c) Google Earth and (d) Sputnik GIS. [image fit: 1.5 columns]](/cms/asset/903bb82e-3908-46f4-920b-06af38e0e8d0/tjde_a_1470205_f0003_oc.jpg)
Similarly, the integration of the model in Sputnik GIS can be observed in (b and d). The Geoscan VG behaves in a more agile way when importing large extensions and higher weight models. The KML model fits perfectly well to the base layer. In a visual evaluation of the model, a slight improvement of visual quality and resolution is observed for Sputnik GIS compared with Google Earth. Sputnik GIS is able to load the custom DEM obtained from UAV-based imagery; therefore, it allows for a more precise approximation of the real land than the base SRTM DEM used by the environment of Google Earth. For a more detailed 3D analysis of the information in the VG, the ability to incorporate DEMs with higher resolution is a key feature (see ).
4.2. Analysis tools
Information analysis is limited in Google Earth, and the functionality of this VG is almost exclusively limited to visual interpretation performed by the user, with no tools provided to conduct complex or nonvisual analytical operations. Google Earth does not have specific analysis tools beyond basic measurements or simple spatial analysis (e.g. viewshed tool), which do not add functionality for other environments. However, Sputnik GIS includes additional functions for spatial analysis. The system imports simple features from a GISs, such as 2D/3D distance, height and volume measurements ((a)), cross sections ((b)), slope calculations and mapping or TIN models, and these features help the user understand the actual geomorphology. In addition, users can construct Anaglyph 3D images specifically for 3D stereoscopic visualization. The High Quality Screenshots creation tool provides the maximum available resolution of the model to obtain optimum graphic outputs from the selected image. Elevation data and cross sections can be exported to text files or CAD formats for further spatial calculations. The analysis tools that are offered by Sputnik GIS are tailored more for users in a professional field.
Figure 4. Measurement tool (a) and cross section tool for profile analysis; (b) in Sputnik GIS. [image fit: 1.5 columns]
![Figure 4. Measurement tool (a) and cross section tool for profile analysis; (b) in Sputnik GIS. [image fit: 1.5 columns]](/cms/asset/f7e2adf9-c30f-4fc2-8585-a29059967a44/tjde_a_1470205_f0004_oc.jpg)
4.3. Virtual flights
An interesting option for the visualization or dissemination of terrain models is the implementation of flights or virtual tours. In this case, the workflows of Google Earth (1) and Sputnik GIS (2) are slightly different. (1) Google Earth uses positional marks that must be defined for each travel point that is visited. These marks must be ordered in such a way that the software will follow the specific navigation route desired during the tour's realization. Different parameters, such as the height of the camera, its inclination or the flight speed, can be configured. Users can add additional content that to display during the flight (external links or images). Based on these data, Google Earth performs automatic navigation and allows for the export of a new KML with the parameters that have been established. Thus, other users are able to reproduce the same flight without having to configure the route again. Google's environment provides for the possibility of exporting the VF in high quality (up to 1920 × 1080 HD) in different video formats (e.g. WMV or AVI) compatible with most video players on the market. (2) The creation of a VF with Sputnik GIS is quite similar and occurs through the KML edition of the route. The main difference is that Sputnik GIS is able to load a custom terrain/surface model to refine the basic SRTM DEM coverage. However, the VFs can be exported only via the KML in Geoscan's system, and direct recording in a video format cannot be performed.
The VF created by both VGs generates visual results with similar quality. However, in Google Earth, the model is scaled dynamically with more facility, and the cache management performed by the system allows for a smoother transition with less lag between frames. The (available at https://figshare.com/s/b113863b90d93c37e12b) shows a sample VF over different afforested plots in the north of Spain performed with Google Earth system and the (available at https://figshare.com/s/42e05c7734f7542bd0c1) shows the equivalent flight with Sputnik GIS.
Video 1. General overview of the VG Google Earth.
Video 2. General overview of the VG Sputnik GIS.
5. Conclusions
This study analyses the capacity of two VGs to represent local georeferenced information and explore such information via interactive navigation. The applicability of VGs for high-resolution datasets and 3D models generated from UAV images consists of interpreting terrain and environmental via a continuous perspective and at a dynamic scale. Within VR systems, the performance of VF is an interesting option for viewing and disseminating results by an overview of the area of interest.
The platforms employed (Google Earth and Sputnik GIS) are virtual environments suitable for the effective representation of high-scale models because of the volume of data that these systems can manage. However, Google Earth is more intuitive for general users without specialized knowledge, whereas Sputnik GIS is tailored more for professional users and provides analysis tools expected from a GIS. The possibility of integrating a customized local DEM is the most distinguishing feature between Sputnik GIS and Google Earth. The ability of Sputnik GIS to display overlapping DEMs allows for the generation of more enhanced approximations of real morphologies, whereas the free access to Google's system represents considerable advantage of Google Earth.
VG technical characteristics have increased rapidly in recent years in parallel with software advances. The most recent advance is the importation of analytical features from GIS and the ability to handle huge amounts of data. These features provide VGs with the ability to provide support in decision-making processes. Drones represent a considerable method of capturing reality, and increasing drone applications are observed in business, particularly businesses that relate to geo-information and communication. The integration of UAV data into VGs unlocks new opportunities across a wide range of applications, such as gaming, agriculture, mining, disaster response, civil engineering, science and research.
Acknowledgements
This work was supported by Xunta de Galicia under the Grant ‘Financial aid for the consolidation and structure of competitive units of investigation in the universities of the University Galician System (2016–18)’ (Ref. ED431B 2016/030 and Ref. ED341D R2016/023). The authors also acknowledge support provided by ‘Realización de vuelos virtuales en las parcelas del proyecto Green deserts LIFE09 / ENV/ES / 000447’.
Disclosure statement
No potential conflict of interest was reported by the authors.
ORCID
Marcos Arza http://orcid.org/0000-0001-6474-8825
Mariluz Gil http://orcid.org/0000-0002-9037-9944
Juan Ortiz http://orcid.org/0000-0003-0717-0400
Additional information
Funding
References
- Bailey, John E., and Aijun Chen. 2011. “The Role of Virtual Globes in Geoscience.” Computers and Geosciences 37 (1): 1–2. doi:10.1016/j.cageo.2010.06.001.
- Ballagh, Lisa M., Bruce H. Raup, Ruth E. Duerr, S. J. S. Khalsa, Christopher Helm, Doug Fowler, and Amruta Gupte. 2011. “Representing Scientific Data Sets in KML: Methods and Challenges.” Computers and Geosciences 37 (1): 57–64. doi:10.1016/j.cageo.2010.05.004.
- Bernardin, Tony, Eric Cowgill, Oliver Kreylos, Christopher Bowles, Peter Gold, Bernd Hamann, and Louise Kellogg. 2011. “Crusta: A New Virtual Globe for Real-time Visualization of Sub-meter Digital Topography at Planetary Scales.” Computers and Geosciences 37 (1): 75–85. doi:10.1016/j.cageo.2010.02.006.
- Biradar, Chandrashekhar M., Prasad S. Thenkabail, Praveen Noojipady, Yuanjie Li, Venkateswarlu Dheeravath, Hugh Turral, Manohar Velpuri, et al. 2009. “A Global Map of Rainfed Cropland Areas (GMRCA) at the End of Last Millennium Using Remote Sensing.” International Journal of Applied Earth Observation and Geoinformation 11 (2): 114–129. doi:10.1016/j.jag.2008.11.002.
- Blaschke, Thomas, Karl Donert, Frank Gossette, Stefan Kienberger, Martin Marani, Salman Qureshi, and Dirk Tiede. 2012. “Virtual Globes: Serving Science and Society.” Information (Switzerland) 3 (3): 372–390. doi:10.3390/info3030372.
- Blenkinsop, T. G. 2012. “Visualizing Structural Geology: From Excel to Google Earth.” Computers and Geosciences 45: 52–56. doi:10.1016/j.cageo.2012.03.007.
- Blower, Jon, Alastair Gemmell, Keith Haines, Peter Kirsch, Nathan Cunningham, Andrew Fleming, and Roy Lowry. 2007. “Sharing and Visualizing Environmental Data Using Virtual Globes.” Proceedings of UK eScience All Hands Meeting 2007, 1013 September 2007, Nottingham, UK. 102–109. http://centaur.reading.ac.uk/803/
- Brovelli, M. A., P. Hogan, M. Minghini, and G. Zamboni. 2013. “The Power of Virtual Globes for Valorising Cultural Heritage and Enabling Sustainable Tourism: NASA World Wind Applications.” ISPRS - International Archives of the Photogrammetry, Remote Sensing and Spatial Information Sciences XL-4/W2: 115–120. doi:10.5194/isprsarchives-XL-4-W2-115-2013.
- Butler, Declan. 2006. “Virtual Globes: The Web-Wide World.” Nature 439 (7078): 776–778. doi:10.1038/439776a.
- De Paor, Declan G., and Steven J. Whitmeyer. 2011. “Geological and Geophysical Modeling on Virtual Globes Using KML, COLLADA, and Javascript.” Computers and Geosciences 37 (1): 100–110. doi:10.1016/j.cageo.2010.05.003.
- Dorn, Helen, Tobias Törnros, and Alexander Zipf. 2015. “Quality Evaluation of VGI Using Authoritative Data—A Comparison with Land Use Data in Southern Germany.” ISPRS International Journal of Geo-Information 4 (3): 1657–1671. doi:10.3390/ijgi4031657.
- Elvidge, C. D., and B. T. Tuttle. 2008. “How Virtual Globes Are Revolutionizing Earth Observation Data Access.” The International Archives of the Photogrammetry, Remote Sensing and Spatial Information Sciences XXXVII: 137–140.
- Goodchild, M. F., H. Guo, A. Annoni, L. Bian, K. de Bie, F. Campbell, M. Craglia, et al. 2012. “Next-Generation Digital Earth.” Proceedings of the National Academy of Sciences 109 (28): 11088–11094. doi:10.1073/pnas.1202383109.
- Gruen, A. 2008. “Reality-based Generation of Virtual Environments for Digital Earth.” International Journal of Digital Earth 1 (1): 88–106. doi:10.1080/17538940701782585.
- Hagen, Tor-Magne Stien. 2011. “Interactive Visualization on High-Resolution Tiled Display Walls with Network Accessible Compute-and Display-Resources.” No. May.
- Harwood, Amii R., Andrew A. Lovett, and Jenni A. Turner. 2015. “Customising Virtual Globe Tours to Enhance Community Awareness of Local Landscape Benefits.” Landscape and Urban Planning 142: 106–119. doi:10.1016/j.landurbplan.2015.08.008.
- Jacobson, Andrew, Jasjeet Dhanota, Jessie Godfrey, Hannah Jacobson, Zoe Rossman, Andrew Stanish, Hannah Walker, and Jason Riggio. 2015. “A Novel Approach to Mapping Land Conversion Using Google Earth with an Application to East Africa.” Environmental Modelling & Software 72: 1–9. doi:10.1016/j.envsoft.2015.06.011.
- Jones, Krista. 2011. “Communicating Perceived Geospatial Data Quality of 3D Objects in Virtual Globes.” Quality, No. September: 122.
- Liu, Po, Jianhua Gong, and Miao Yu. 2015. “Graphics Processing Unit-Based Dynamic Volume Rendering for Typhoons on a Virtual Globe.” International Journal of Digital Earth 8 (6): 431–450. doi:10.1080/17538947.2014.915349.
- Loesch, Benjamin, Martin Christen, and Stephan Nebiker. 2012. “OpenWebGlobe - an Open Source SDK for Creating Large-Scale Virtual Globes on a WebGL Basis.” XXXIX (September): 195–200.
- Ludwig, Annika, Hanna Meyer, and Thomas Nauss. 2016. “Automatic Classification of Google Earth Images for a Larger Scale Monitoring of Bush Encroachment in South Africa.” International Journal of Applied Earth Observation and Geoinformation 50: 89–94. doi:10.1016/j.jag.2016.03.003.
- Paraskevas, T. 2011. “Virtual Globes and Geological Modeling.” International Journal of Geosciences 2 (4): 648–656. doi:10.4236/ijg.2011.24066.
- Patel, Nirav N., Emanuele Angiuli, Paolo Gamba, Andrea Gaughan, Gianni Lisini, Forrest R. Stevens, Andrew J. Tatem, and Giovanna Trianni. 2015. “Multitemporal Settlement and Population Mapping From Landsatusing Google Earth Engine.” International Journal of Applied Earth Observation and Geoinformation 35: 199–208. doi:10.1016/j.jag.2014.09.005.
- Sahr, Kevin, Denis White, and A. Jon Kimerling. 2003. “Geodesic Discrete Global Grid Systems.” Cartography and Geographic Information Science 30 (2): 121–134. doi:10.1559/152304003100011090.
- Sheppard, Stephen R. J., and Petr Cizek. 2009. “The Ethics of Google Earth: Crossing Thresholds From Spatial Data to Landscape Visualisation.” Journal of Environmental Management 90 (6)2102–2117. doi:10.1016/j.jenvman.2007.09.012.
- Stensgaard, Anna Sofie, C. F. L. Saarnak, Jürg Utzinger, Penelope Vounatsou, Christopher Simoonga, Gabriel Mushinge, Carsten Rahbek, Flemming Møhlenberg, and Thomas K. Kristensen. 2009. “Virtual Globes and Geospatial Health: The Potential of New Tools in the Management and Control of Vector-Borne Diseases.” Geospatial Health 3 (2): 127–141. doi:10.4081/gh.2009.216.
- Stødle, Daniel, Njål T. Borch, and Rune Storvold. 2013. “High-Performance Visualization of Uas Sensor and Image Data With Raster Maps and Topography in 3D.” XL (September): 4–6.
- Tiede, Dirk, and Stefan Lang. 2010. “Analytical 3D Views and Virtual Globes - Scientific Results in a Familiar Spatial Context.” ISPRS Journal of Photogrammetry and Remote Sensing 65 (3): 300–307. doi:10.1016/j.isprsjprs.2009.12.002.
- Tomaszewski, Brian. 2011. “Situation Awareness and Virtual Globes: Applications for Disaster Management.” Computers and Geosciences 37 (1): 86–92. doi:10.1016/j.cageo.2010.03.009.
- Tuttle, B., S. Anderson, and R. Huff. 2008. “Virtual Globes: An Overview of Their History, Uses, and Future Challenges.” Geography Compass 2 (5): 1478–1505. doi:10.1111/j.1749-8198.2008.00131.x.
- Wiemann, Stefan, Sam Meek, Mike J. Jackson, and Colin Chapman. 2015. “Service - Based Combination of Quality Assurance and Fusion Processes for the Validation of Crowdsourced Observations.” Proceedings of the 18th AGILE International Conference on Geographic Information Science: 9–12.
- Yu, Le, and Peng Gong. 2012. “Google Earth as a Virtual Globe Tool for Earth Science Applications at the Global Scale: Progress and Perspectives.” International Journal of Remote Sensing 33 (12): 3966–3986. doi:10.1080/01431161.2011.636081.
- Zhang, H., and J. Malczewski. 2017. “Quality Evaluation of Volunteered Geographic Information: The Case of OpenStreetMap.” Volunteered Geographic Information and the Future of Geospatial Data. IGI Global: 19–46.