
ABSTRACT
The critical angle is the angle at which the contrast of oil slicks reverse their contrasts against the surrounding oil-free seawater under sunglint. Accurate determination of the critical angle can help estimate surface roughness and refractive index of the oil slicks. Although it’s difficult to determine a certain critical angle, the potential critical angle range help to improve the estimation accuracy. In this study, the angle between the viewing direction and the direction of mirror reflection is used as an indicator for quantifying the critical angle and could be calculated from the solar/viewing geometry from observations of the Moderate Resolution Imaging Spectroradiometer (MODIS). The natural seep oil slicks in the Gulf of Mexico were first delineated using a customized segmentation approach to remove noise and apply a morphological filter. On the basis of the histograms of the brightness values of the delineated oil slicks, the potential range of the critical angle was determined, and then an optimal critical angle between oil slicks and seawater was then determined from statistical and regression analyses in this range. This critical angle corresponds to the best fitting between the modeled and observed surface roughness of seep oil slicks and seawater.
1. Introduction
Natural hydrocarbon seepages and marine oil spill can form the oil slicks on top of ocean surface (Macdonald et al. Citation1993; Howari Citation2004; Zhong and You Citation2011; Charnotskii et al. Citation2016), which can be detected by different remote sensors (Brekke and Solberg Citation2005; Chust and Sagarminaga Citation2007; Leifer et al. Citation2012; Lu, Li, et al. Citation2013; Lu, Tian, et al. Citation2013; Lu, Zhan, and Hu Citation2016; Sun, Hu, and Tunnel Jr Citation2015; Sun and Hu Citation2016; Sun et al. Citation2016). The spilled oils show darker than the oil-free seawater in Synthetic Aperture Radar (SAR) data, are due to the modulation on surface roughness reduces Bragg scattering (Migliaccio, Gambardella, and Tranfaglia Citation2007; Li et al. Citation2014; Zhang et al. Citation2012, Citation2017). Although the classification and quantification of various spilled oils mainly depend on the different reflectance spectra of them, the surface sunglint reflection helps detection and presents challenges on classification and quantification. Oil slicks can modulate seawater surface roughness and appear both darker (negative contrast) and brighter (positive contrast) than the surrounding oil-free seawater under sunglint in optical imagery (Hu et al. Citation2009; Jackson and Alpers Citation2010; Lu, Sun et al. Citation2016; Sun and Hu Citation2016; Lu et al. Citation2017).
The idealized critical angle is the intersection point between the normalized sunglint radiance (Lgn) of oil slicks and seawater changing from dark to bright area (Hu et al. Citation2009; Jackson and Alpers Citation2010), and the core idea of simulation of Lgn of oil slicks or seawater is from Cox-Munk Model (Cox and Munk Citation1954). The space-borne optical sensors can measure sunglint reflectance (Lg, Lgn = πLg) of oil slicks or seawater by using near-infrared bands (i.e. 859 nm band of Moderate Resolution Imaging Spectroradiometer, MODIS) (Zhang and Wang Citation2010; Jackson and Alpers Citation2010; Lu, Sun et al. Citation2016). Usually, if the refractive indices of seep oil slicks and seawater have been given, and the seawater (seep oil slicks) leaving radiance have been ignored in some near-infrared bands under sunglint, their surface roughness could be estimated using statistical analyses between modeled and MODIS-derived Lgn (Lu, Sun et al. Citation2016). The oils have different refractive indices (Ghandoor et al. Citation2003; Carolis, Adamo, and Pasquarisllo Citation2014) and the background ocean environment (i.e. wind speed, wind direction, and depth of seawater) is very complex, making it difficult to point out the precise location of critical angle using space-borne sensors’ imageries. On the other hand, this means that the preliminary estimation of potential critical angle range (an important boundary condition) can help to improve the determination of seep oil slicks surface roughness or refractive index.
The aim of this study is to estimate the oil slicks surface roughness using normalized sunglint reflectance (Lgn) image and spatial distribution information of seep oil slicks. The θm was used by Hu et al. (Citation2009) to describe the angle difference between the viewing direction and the direction of mirror reflection, is recommended to be an indicator of critical angle range in this study. When the seep oil slicks covered the main satellite tracks uniformly, the image pixels show no or negligible contrast between oil slicks and oil-free seawater under sunglint in a certain angle and implies it is the critical angle. Due to the ocean circulation, the dark and bright seep oil slicks have the specific morphological characteristics, and then, they can be extracted from background seawater based on the Gaussian filter and oil slicks morphology feature detection (Wang and Hu Citation2015) and helps to figure out the potential critical angle range. This angle range and modeled Lgn of seawater determined reasonable Lgn values of oil slicks, which corresponds to an appropriate surface roughness range of oil slicks. By comparing to image-derived Lgn values, a couple of optimum surface roughness of oil slick and seawater was selected, and the intersection of them provided a more precise critical angle range. Nevertheless, this study shows an alternative approach to determine the critical angle and seep oil slicks surface roughness from optical remotely sensed imagery in the future.
2. Study area and imagery
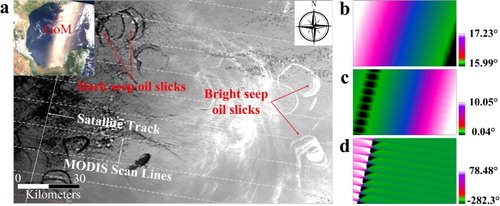
The study area is located in the northern Gulf of Mexico (GoM) which is one of the famous oil and gas fields (Macdonald et al. Citation1993). The light hydrocarbon seepage floating to seawater surface forms seep oil slicks which appear both darker (negative contrast) or brighter (positive contrast) than the surrounding oil-free seawater under sunglint in some optical imagery (Hu et al. Citation2009; Jackson and Alpers Citation2010; Lu, Sun et al. Citation2016). The water depth in the study area arranges is from 50 to 2500 m. The wind speed varies very little and is not more than 4 m/s (Jackson and Alpers Citation2010). MODIS level-0 data covering the study area on 2 June 2005 at 16:55 UTC was obtained from the NASA Goddard Space Flight Center (GSFC). The NASA software package SeaDAS (version 7.0) has been used to convert the level-0 data to level-1 data (Lt, calibrated total radiance after ozone correction). Lgn of seep oil slicks and seawater can be estimated from MODIS band at 859 nm with the assumption that water-leaving radiance is negligible over seawater ((a)). Meanwhile, the modeled Lgn of seep oil slicks and seawater had been calculated using the viewing angle imageries (the solar zenith angle θ0, sensor zenith angle θ, and relative azimuth angle Φ) ((b–d)).
Figure 1. (a) MODIS/Terra RGB image of 2 June 2005 (16:55 GMT) covering the GoM (inset), the main study was cut from the band of 859 nm, the white solid line indicated the satellite track, and the white dotted line indicated MODIS scan lines direction, (b) the Solar zenith angel θ0, (c) the Sensor zenith angel θ, and (d) the relative azimuth angle Φ.
3. Methods
3.1. Extraction of seep oil slicks
The morphology of the seep oil slicks in this imagery show distinct characteristics as a result of the ocean circulation and has been used as an important descriptor to discriminate seep oil slicks from false alarms in the previous studies (Wang and Hu Citation2015; Lehr and Simecek-Beatty Citation2000). Therefore, the dark and bright seep oil slicks under sunglint show obviously morphological characteristics and can be extracted according to the following steps. (1) Correct the large scale image gradient due to glint contamination using the average pixel value from a local window and remove the salient speckles; (2) Apply a 3×3 Gaussian filter to reduce random noise and obtain coherent features; (3) Adopt histogram equalization using appropriate cut-off values to intensify the oil features. For negative slicks, the cut-off value of bright pixels can be set as a 50% of the maximum pixels value; (4) Apply a threshold filter with adjusted parameters and segment the potential features, OTSU thresholds can be used as a reference (Otsu Citation1979); (5) Connect the ‘broken’ features through a directional search operator and use roundness and area to exclude features that are neither too round nor too small to be real oil pixels. Roundness of the extracted feature (Rfactor) is calculated as Equation (1), where S is the area of the feature and C is the circumference (Wang and Hu Citation2015; Lehr and Simecek-Beatty Citation2000; Otsu Citation1979).(1)
3.2. Modeled Lgn using Cox-Munk Model
The Cox-Munk model has been developed for interpreting the statistics of the sunglint on the sea surface (Cox and Munk Citation1954), and was used to model the Lgn of seep oil slicks and sea surface according to Equations (2–4) (Jackson and Alpers Citation2010; Lu, Sun et al. Citation2016):(2)
(3)
(4) where β is wave surface tilt, σ2 is the surface roughness of oil slicks or oil-free seawater, ρ(ω) is the Fresnel reflection coefficient of oil slicks or oil-free seawater which could be calculated according to Snell Law and the viewing angles. P (θ0, θ, Φ, σ2) is the probability density function of Cox-Munk model. In this study, the refractive indices of seawater, oil slicks, and air were set to 1.34, 1.38, and 1.0, respectively. Three viewing angles can be collected from space-borne sensors. According to the above equations, if the surface roughness of oil slicks or oil-free seawater can be given, the Lgn will be calculated using viewing angles, and there will be a critical angle of Lgn contrast reversal between oil slicks and seawater. In other words, if the potential critical angle and the viewing angles have been given, the surface roughness of them can be estimated using space-borne sensors derived Lgn.
3.3. MODIS-derived Lgn
The sunglint imagery covering the GoM on 2 June 2005 was collected from MODIS 859 nm band (level-0 data). Thus, the SeaDAS (version 7.0) was used to process the MODIS level-0 data to get the ozone calibrated radiance Lt, which can be expressed as Equation (5) in the absence of whitecaps (Wang and Bailey Citation2001; Hu, Carder, and Muller-Karger Citation2000; Zhang and Wang Citation2010).(5) where F0 is the extraterrestrial solar irradiance, λ represents the wavelength, and 859 nm is chosen here to ignore the impact of water-leaving radiance Lw (Lw is negligible at band 859 nm). Lr is calculated using the lookup tables for Rayleigh scattering in SeaDAS. La is derived from the nearby pixel free of sunglint. T and T0 are the beam transmittance of pixel-to-satellite and sun-to-pixel respectively, whereas the t is pixel-to-satellite diffuse transmittance, and they can all be derived from Rayleigh optical thickness, aerosol optical thickness, solar zenith angel, and sensor zenith angel. On the basis of the atmosphere correction, the MODIS-derived Lg (sr−1) of seep oil slicks and seawater multiply by π equal to the modeled Lgn (Lgn = πLg).
4. Results and discussions
4.1. Determining potential critical angle range
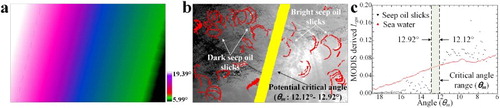
The angle (θm, cosθm=cosθ0cosθ-sinθ0sinθcosΦ) can be calculated using viewing angles (θ0, θ, and Φ) for quantization of the critical angle range. (a) shows that the range of θm is from 5.99° to 19.39° in this case. The same angle (θm) also means that the same surface has the same normalized sunglint reflectance. Based on the method in Section 3.1, the seep oil slicks could be figured out and marked with red signs ((b)). Moreover, the potential critical angle range between dark and bright seep oil slicks (θm is from 12.12° ∼ 12.92°) has been deduced which is an important boundary condition for the approach of seep oil slicks surface roughness. (c) shows the statistic features of MODIS-derived Lgn image, such as the average Lgn of seawater changed from dark to bright area ((c)), and the minimum or maximum Lgn of seep oil slicks in negative contrast (dark seep oil slicks) or positive contrast (bright seep oil slicks) from the background seawater depends on the same angle (θm).
Figure 2. (a) The angle (θm) between the viewing direction and the direction of mirror reflectance, (b) Seep oil slicks extraction from MODIS image and the potential critical angle range, and (c) The statistical values of seep oil slicks and seawater collected from MODIS imagery.
4.2. Simulation of the critical angle
Based on the test refractive indices of seep oil slicks, air and seawater, the modeled Lgn of seep oil slicks and seawater can be figured out using Cox-Munk model (Hu et al. Citation2009; Jackson and Alpers Citation2010; Lu, Sun et al. Citation2016). Due to the surface wind speed varies little and is lower than 4 m/s on the day of MODIS imaging (Hu et al. Citation2009), the modeled Lgn of seawater for five different seawater roughness (0.013, 0.016, 0.018, 0.021, and 0.023, corresponding to surface wind speed of 2.0, 2.5, 3.0, 3.5, and 4.0 m/s) were used to match the MODIS-derived Lgn of seawater. At the same time, the 7 curves of modeled Lgn of seep oil slicks which roughness changed from 0.004 to 0.010 were figured out ((a)). In the potential critical angle range (θm is 12.12° ∼ 12.92°), six intersection points between the modeled Lgn of seep oil slicks and seawater could be pointed out ((b)). Furthermore, these different intersection points implied the surface roughness combination between seep oil slicks and seawater ((b)).
Figure 3. (a) Modeled Lgn of seep oil slicks and oil-free seawater which viewing angles corresponding to the MODIS imagery. There are six intersection angles in the potential critical angle range (12.12° ∼ 12.92°), (b) six surface roughness combinations of seep oil slicks and seawater could be pointed out in this range.
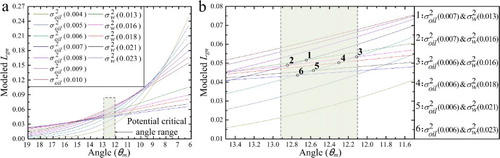
In the modeled results, the variation range of seep oil slicks surface roughness is from 0.006 to 0.007, and the seawater surface roughness varies from 0.013 to 0.023. Therefore, the regression analysis between modeled and MODIS-derived Lgn help to promote these preliminary results.
4.3. Approaching surface roughness
According to six intersection points in potential critical angle range ((b)), the numerical relationship between modeled Lgn and MODIS-derived Lgn of seep oil slicks and seawater depending on the same angle (θm) of them were figured out as follow (). Although these potential critical angle ranges are reasonable, the optimal statistical regression between modeled and MODIS-derived Lgn of them will promote the more accurate result of approximation of surface roughness.
Figure 4. MODIS-derived and modeled Lgn of six potential critical angles with seep oil slicks and seawater roughness corresponding to .
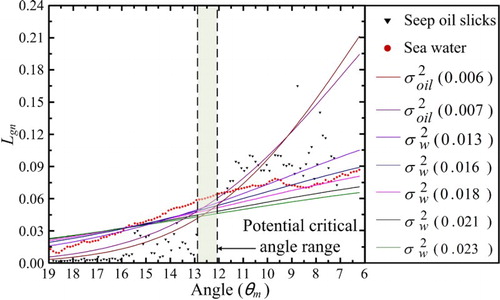
The statistical relationships between the modeled and MODIS-derived Lgn of them showed in . The linear relationships are all satisfactory due to the change trend of Lgn is consistent from dark to bright area corresponding to the angle (θm) changed from small to large. Although the multiple correlation coefficient (R2) increases with the increase of the roughness, the root mean square deviation (RMSE) of them is not monotonic changing. The minimum RMSE of them are 0.026095 (seep oil slicks) and 0.006803 (seawater) corresponding to σ2 oil (0.007) and σ2 water (0.016) (). Therefore, the surface roughness of seep oil slicks and seawater were recommended around 0.007 and 0.016 corresponding to the surface wind speed of about 2.5 m/s.
Figure 5. Statistical relationships between modeled and MODIS-derived Lgn of seep oil slicks and seawater (potential critical angle range is from 12.12° to 12.92°).
5. Conclusions
Seep oil slicks is a kind of very thin oil film floating on the ocean surface, and the leaving radiance can be ignored in near-infrared wavelength. They could appear both brighter and darker than the surrounding water under sunglint on the sides of the critical angle in the optical remotely sensed imagery. This is due to different refractive index and surface roughness of them. Although it’s difficult to figure out the accurate critical angle, determining potential critical angle range helps to improve estimation of seep oil slicks and seawater surface roughness. The angle (θm) between the viewing direction and the direction of mirror reflection is recommended as an accurate position indicator for quantifying the critical angle and can be calculated from solar/viewing geometry of remotely sensed data. Based on the extraction of dark and bright seep oil slicks from MODIS imagery, a potential critical angle range can be figured out for the suggestion of preliminary surface roughness of them. In this range, the optimal fitting results between MODIS-derived and modeled Lgn of them further indicate the surface roughness and refractive index. Nevertheless, surface sunglint reflectance contains some information which help to derive more details and require more attention.
Disclosure statement
No potential conflict of interest was reported by the authors.
ORCID
Yingcheng Lu http://orcid.org/0000-0002-9528-053X
Yongxue Liu http://orcid.org/0000-0002-6837-5015
Additional information
Funding
References
- Brekke, C., and A. H. S. Solberg. 2005. “Oil Spill Detection by Satellite Remote Sensing.” Remote Sensing of Environment 95 (1): 1–13. doi: 10.1016/j.rse.2004.11.015
- Carolis, G. D., M. Adamo, and G. Pasquarisllo. 2014. “On the Estimation of Thickness of Marine Oil Slicks From Sun-Glittered, Near-Infrared MERIS and MODIS Imagery: The Lebanon Oil Spill Case Study.” IEEE Transactions on Geoscience and Remote Sensing 52 (1): 559–573. doi: 10.1109/TGRS.2013.2242476
- Charnotskii, M., S. Ermakov, L. Ostrovsky, and O. Shomina. 2016. “Effect of Film Slicks on Near-Surface Wind.” Dynamics of Atmospheres and Oceans 75: 118–128. doi: 10.1016/j.dynatmoce.2016.08.003
- Chust, G., and Y. Sagarminaga. 2007. “The Multi-Angle View of MISR Detects Oil Slicks Under Sun Glitter Conditions.” Remote Sensing of Environment 107: 232–239. doi: 10.1016/j.rse.2006.09.024
- Cox, C., and W. Munk. 1954. “Measurement of the Roughness of the sea Surface from Photographs of the Sun’s Glitter.” Journal of the Optical Society of America 44 (11): 838–850. doi: 10.1364/JOSA.44.000838
- Ghandoor, H. E., E. Hegazi, I. Nasser, and G. M. Behery. 2003. “Measuring the Refractive Index of Crude oil Using a Capillary Tube Interferometer.” Optics and Laser Technology 35: 361–367. doi: 10.1016/S0030-3992(03)00029-X
- Howari, F. M. 2004. “Investigation of Hydrocarbon Pollution in the Vicinity of United Arab Emirates Coasts Using Visible and Near Infrared Remote Sensing Data.” Journal of Coastal Research 204 (4): 1089–1095. doi: 10.2112/03-0023R.1
- Hu, C., K. L. Carder, and F. E. Muller-Karger. 2000. “Atmospheric Correction of SeaWiFS Imagery over Turbid Coastal Waters: A Practical Method.” Remote Sensing of Environment 74 (2): 195–206. doi: 10.1016/S0034-4257(00)00080-8
- Hu, C., X. Li, W. G. Pichel, and F. E. Muller-Karger. 2009. “Detection of Natural oil Slicks in the NW Gulf of Mexico Using MODIS Imagery.” Geophysical Research Letters 36: L01604. doi: 10.1029/2009GL039655
- Jackson, C. R., and W. Alpers. 2010. “The Role of the Critical Angle in Brightness Reversals on Sunglint Images of the sea Surface.” Journal of Geophysical Research 115: C09019.
- Lehr, W. J., and D. Simecek-Beatty. 2000. “The Relation of Langmuir Circulation Processes to the Standard oil Spill Spreading, Dispersion, and Transport Algorithms.” Spill Science and Technology Bulletin 6 (3-4): 247–253. doi: 10.1016/S1353-2561(01)00043-3
- Leifer, I., W. J. Lehr, D. Simecek-Beatty, E. Bradley, R. Clark, P. Dennison, Y. Hu, et al. 2012. “State of the Art Satellite and Airborne Marine oil Spill Remote Sensing: Application to the BP Deepwater Horizon Oil Spill.” Remote Sensing of Environment 124: 185–209. doi: 10.1016/j.rse.2012.03.024
- Li, Y., Y. Zhang, J. Chen, and H. Zhang. 2014. “Improved Compact Polarimetric SAR Quad-Pol Reconstruction Algorithm for Oil Spill Detection.” IEEE Geoscience and Remote Sensing Letters 11 (6): 1139–1142. doi: 10.1109/LGRS.2013.2288336
- Lu, Y., X. Li, Q. Tian, G. Zheng, S. Sun, Y. Liu, and Q. Yang. 2013. “Progress in Marine oil Spill Optical Remote Sensing: Detected Targets, Spectral Response Characteristics, and Theories.” Marine Geodesy 36 (3): 334–346. doi: 10.1080/01490419.2013.793633
- Lu, Y., S. Sun, M. Zhang, B. Murch, and C. Hu. 2016. “Refinement of the Critical Angle Calculation for the Contrast Reversal of Oil Slicks Under Sunglint.” Journal of Geophysical Research: Oceans 121 (1): 148–161.
- Lu, Y., Q. Tian, X. Wang, G. Zheng, and X. Li. 2013. “Determining Oil Slick Thickness Using Hyperspectral Remote Sensing in the Bohai Sea of China.” International Journal of Digital Earth 6 (1): 76–93. doi: 10.1080/17538947.2012.695404
- Lu, Y., W. Zhan, and C. Hu. 2016. “Detecting and Quantifying oil Slick Thickness by Thermal Remote Sensing: A Ground-Based Experiment.” Remote Sensing of Environment 181: 207–217. doi: 10.1016/j.rse.2016.04.007
- Lu, Y., Y. Zhou, Y. Liu, Z. Mao, W. Qian, M. Wang, M. Zhang, J. Xu, S. Sun, and P. Du. 2017. “Using Remote Sensing to Detect the Polarized Sunglint Reflected From oil Slicks Beyond the Critical Angle.” Journal of Geophysical Research: Oceans 122 (8): 6342–6354.
- Macdonald, I. R., N. L. Guinasso, S. G. Ackleson, J. F. Amos, R. Duckworth, R. Sassen, and J. M. Brooks. 1993. “Natural oil Slicks in the Gulf of Mexico Visible From Space.” Journal of Geophysical Research 98 (C9): 16351–16364. doi: 10.1029/93JC01289
- Migliaccio, M., A. Gambardella, and M. Tranfaglia. 2007. “SAR Polarimetry to Observe Oil Spills.” IEEE Transactions on Geoscience and Remote Sensing 45 (2): 506–511. doi: 10.1109/TGRS.2006.888097
- Otsu, N. 1979. “A Threshold Selection Method from Gray-Level Histograms.” IEEE Transactions on Systems, Man, and Cybernetics 9 (1): 62–66. doi: 10.1109/TSMC.1979.4310076
- Sun, S., and C. Hu. 2016. “Sun Glint Requirement for the Remote Detection of Surface oil Film.” Geophysical Research Letters 43 (1): 309–316. doi: 10.1002/2015GL066884
- Sun, S., C. Hu, L. Feng, G. A. Swayze, J. Holmes, G. Graettinger, I. MacDonald, O. Garcia, and I. Leifer. 2016. “Oil Slick Morphology Derived from AVIRIS Measurements of the Deepwater Horizon oil Spill: Implications for Spatial Resolution Requirements of Remote Sensors.” Marine Pollution Bulletin 103: 276–285. doi: 10.1016/j.marpolbul.2015.12.003
- Sun, S., C. Hu, and J. W. Tunnel Jr. 2015. “Surface Oil Footprint and Trajectory of the Ixtoc-I oil Spill Determined From Landsat/MSS and CZCX Observations.” Marine Pollution Bulletin 101: 632–641. doi: 10.1016/j.marpolbul.2015.10.036
- Wang, M., and S. W. Bailey. 2001. “Correction of Sunglint Contamination on the SeaWiFS Ocean and Atmosphere Products.” Applied Optics 40: 4790–4798. doi: 10.1364/AO.40.004790
- Wang, M., and C. Hu. 2015. “Extracting Oil Slick Features From VIIRS Nighttime Imagery Using a Gaussian Filter and Morphological Constraints.” IEEE Geoscience and Remote Sensing Letters 12 (10): 2051–2055. doi: 10.1109/LGRS.2015.2444871
- Zhang, Y., Y. Li, X. Liang, and J. Tsou. 2017. “Comparison of oil Spill Classifications Using Fully and Compact Polarimetric SAR Images.” Applied Sciences 7 (2): 193–215. doi: 10.3390/app7020193
- Zhang, Y., H. Lin, Q. Liu, J. Hu, X. Li, and K. Yeung. 2012. “Oil-Spill Monitoring in the Coastal Waters of Hong Kong and Vicinity.” Marine Geodesy 35: 93–106. doi: 10.1080/01490419.2011.637872
- Zhang, H., and M. Wang. 2010. “Evaluation of Sunglint Models Using MODIS Measurements.” Journal of Quantitative Spectroscopy and Radiative Transfer 111 (3): 492–506. doi: 10.1016/j.jqsrt.2009.10.001
- Zhong, Z., and F. You. 2011. “Oil Spill Response Planning with Consideration of Physicochemical Evolution of the Oil Slick: A Multi Objective Optimization Approach.” Computers and Chemical Engineering 35 (8): 1614–1630. doi: 10.1016/j.compchemeng.2011.01.009