
ABSTRACT
Global land cover maps are important sources of information for a wide range of studies including land change analysis and climate change research. While the global land cover maps attempt to present a consistent and homogenous data in terms of the production process, the existing datasets offer coarse resolution data, e.g. 1000 m for IGBP DISCover and 300 m for GlobeCover 2009 that is oftentimes challenging. Recently, GlobeLand30 data based on Landsat archive for two timestamps of 2000 and 2010 has been released. It presents a finer spatial resolution of 30 m, which provides numerous opportunities for a wide range of studies. The main objective of this study is to use this dataset for characterizing global land cover patterns, monitoring, and identifying extreme land change cases with their types and magnitude. The findings reveal massive land change patterns including deforestation, desertification, shrinkage of water bodies, and urbanization across the globe. The results and discussions of this research can help policy-makers, environmental planners, ecosystem services providers and climate change researchers to gain finer insights about the forms of global land change. Future research calls for further investigation of the underlying causes of the massive changes and their consequences on our ecosystems and human populations.
1. Introduction
Land cover maps play a vital role in a variety of studies including land cover change analysis, ecosystem services analysis, environmental quality, and climate change research, among others. These datasets are normally produced at different timestamps in order to study land dynamics across space and time (Fritz et al. Citation2009; Foody and Boyd Citation2013; Brown, Montag, and Lyon Citation2012). Common challenging forms of land cover change are seen in the form of urbanization (Vaz and Jokar Arsanjani Citation2015; Jokar Arsanjani, Helbich, and Vaz Citation2013; Tayyebi et al. Citation2013; Weber and Puissant Citation2003; United Nations Citation2014), deforestation (Pineda Jaimes et al. Citation2010; Mas Citation2004), drying wetlands and water resources (Jokar Arsanjani et al. Citation2015a; Roach, Griffith, and Verbyla Citation2013), and desertification (Reynolds and Stafford Smith Citation2002; Miao et al. Citation2016). A number of studies (Verburg et al. Citation2006; Verburg, Neumann, and Nol Citation2011; Vaz and Jokar Arsanjani Citation2015; Seto, Güneralp, and Hutyra Citation2012; Lambin et al. Citation2001) have shown that considerable rate and form of land changes occur across the globe, which demands looking at them closely to identify their underlying factors and their consequences.
It is essential to understand the patterns and dynamics of global land cover for a number of reasons including environmental quality analysis, hydrological cycles, ecology biodiversity, and human health (Pielke et al. Citation2011; Turner, Lambin, and Reenberg Citation2007; DeFries Citation2008). According to Intergovernmental Panel On Climate Change (IPCC) (IPCC Citation2007), land use/cover dynamics contribute to almost 20% of global CO2 emissions. Furthermore, the terrestrial ecosystem is the main resource for providing goods and services to human’s population (Foley et al. Citation2005), which must be protected. Thus, our observation about its physical conditions has to improve both in terms of spatial and temporal resolution. Because the past and current global land use/cover analyses and assessments are performed using the relatively coarse resolution datasets, which result in rough estimations of the extent, patterns, rates, causes, and consequences of land cover/use change. For example, GlobCover 2009 (Arino et al. Citation2012), IGBP DISCover (Loveland et al. Citation1999; Belward, Estes, and Kline Citation1999), UMD Land Cover (Hansen and Reed Citation2000; Hansen et al. Citation2000), and Global Land Cover 2000 (Bartholomé and Belward Citation2005) present land cover datasets with spatial resolution of 300, 1000, 1000, and 1000 m, respectively. The main challenge in using them is that we are unable to monitor and observe land changes across smaller regions at a microscopic scale as their resolution is simply too coarse to capture the local variation of land cover patterns. Furthermore, their quality and usefulness still remain a big question (Fritz et al. Citation2011; Batisani and Yarnal Citation2009). For instance, it is reasonably vital to access finer maps in order to implement them in the land change simulation models as the resultant recommendations to end users including environmentalists, decision-makers, and citizens are based on the input data (Tayyebi et al. Citation2016; Jokar Arsanjani, Tayyebi, and Vaz Citation2016). And this is probably the main reason that the literature lacks global statistics of land cover change calculated based on a fine scale dataset. The answer could be found in the Landsat program as (a) its rich and long-term archive has been released to the public and no cost is applied; (b) it has captured a long-term archive of data, i.e. exceeding 40 years and still will continue to forthcoming Landsat programs; (c) its spatial resolution down to 30 m, which is considerably better than the existing global land cover datasets; and (d) rich literature and experiences providing enormous methodologies, algorithms, and experiences for extracting land cover maps from it, among others.
Yet, there are some technical challenges to tackle before producing such datasets such as the problem of availability of temporally consistent global coverage of satellite images, dealing with huge volume of data, limited availability of accurate and timely training and validation samples, high performance computing requirements, as well as being largely time-consuming (Giri et al. Citation2013; Townshend et al. Citation2012; Hansen et al. Citation2013; Gong et al. Citation2013). A thorough study on the opportunities and challenges of using Landsat for global land cover mapping is presented in (Giri et al. Citation2013). So far, a few efforts toward generating global land cover maps at 30 m resolution and at multiple temporal coverages using a long-term archive of Landsat satellite images are conducted. Among them, the efforts by The USGS Land Cover Institute (LCI) as well as National Geomatics Center of China (NGCC) under the ‘Global Land Cover Mapping at Finer Resolution’ for generating global land cover maps can be mentioned while the latter has already released GlobeLand30 at two timestamps of 2000 and 2010.
GlobeLand30 is a timely product and can address several challenges for global land cover monitoring and assessment in the literature as follows: (a) a more recent global land cover maps are provided e.g. 2000 and 2010, (b) the spatial resolution is improved substantially to 30 m, (c) two timestamps for global land cover datasets are provided, which help to track changes within 10 years start of twenty-first century, (d) several studies for its quality have shown high accuracy measures (e.g., Brovelli et al. Citation2015; Jokar Arsanjani, Tayyebi, and Vaz Citation2016; Jokar Arsanjani, See, and Tayyebi Citation2016), (e) a consistent multi-temporal dataset is provided as consistent methodology and mechanisms for ground truthing are conducted, (f) major 10 land cover classes supporting a wide range of landscapes are reflected while generating the data (Cao et al. Citation2014; Chen et al. Citation2015b), and (g) an online and crowdsourced approach is implemented to correct the false classified pixels through its official platform, which presents a sustainable approach for quality improvement (Chen Citation2011).
Hence, the main objectives of this study are threefold: (a) to identify the rates and types of land change across different continents, (b) to explore the usability of GlobeLand30-2000 and GlobeLand30-2010 for temporal land cover change detection, and (c) to investigate the suitability of GlobeLand30 for land cover change modelling. Therefore, it is intended to find answers for the following research questions:
What is the extent and pattern of land cover features globally and across different continents according to GlobeLand30?
How suitable is GlobeLand30 for identifying the extent, rate, and pattern of land change across diverse landscapes?
How suitable is GlobeLand30 for land cover change simulation into future?
The remainder of this paper is structured as follows: Section 2 provides an overview to the data and methodologies used in the study. Section 3 presents the findings and Section 4 presents discussions and concluding remarks and augments future research directions.
2. Materials and methods
2.1. Data
2.1.1. Globeland30 maps
The GlobeLand30 land cover maps have been recently released by NGCC. The dataset offers a unique global dataset at the finest spatial resolution of 30 m covering two timestamps of 2000 and 2010. They are produced based on exceeding 10,000 collected images acquired mainly from Landsat Thematic Mapper (TM) and Enhanced Thematic Mapper plus (ETM+). The integration of a pixel-object-knowledge-based approach was implemented to produce these data (Han et al. Citation2015; Chen et al. Citation2015a). A worldwide overall accuracy of >80% is reported by Chen et al. (Citation2015a), and further studies assessed the accuracy of these data across different landscapes with promising accuracy values (Jokar Arsanjani, Tayyebi, and Vaz Citation2016; Jokar Arsanjani, See, and Tayyebi Citation2016; Brovelli et al. Citation2015).
2.2. Study area
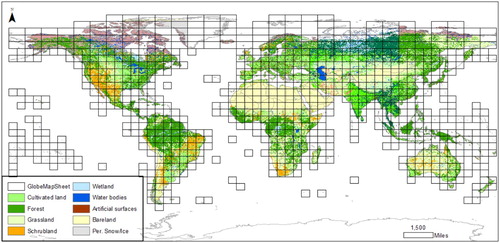
This study is conducted on a global scale and the entire land cover datasets from GlobeLand30 for years 2000 and 2010 were used. shows the configuration of image tiles of GlobeLand30.
Figure 1. Image tiles of GlobeLand30.
2.3. Methods
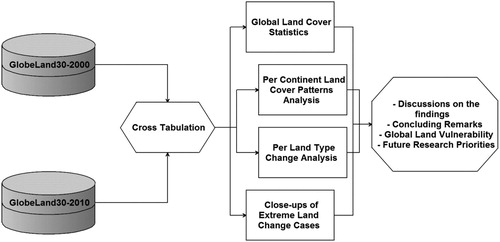
In order to achieve the objectives of this study, 855 image tiles (each tile covering about 330,000 km2) for each of the two timestamps of 2000 and 2010 were collected through the official online platform at www.globallandcover.com. The entire world is tiled into UTM zones and split at every 5-degree latitude. The image tiles were merged per each continent in order to make the analysis feasible due to the heavy size of the data. The land cover nomenclature was extracted from the product’s metadata and applied accordingly as shown in .
Table 1. Land cover nomenclature of GlobeLand30 (Chen et al., Citation2015a).
Thereafter, cross-tabulation analysis, which performs a comparison between two thematic maps indicating the trade-off between them, was conducted between the two datasets in order to identify change transition within 2000 and 2010. In doing so, several close-ups of extreme areas of land cover change will be demonstrated and analysed. demonstrates the flowchart of the study conducted in this paper.
Figure 2. Flowchart of the study.
3. Results
3.1. Global land cover statistics and dynamics among them
In this section, statistics about the global land cover types and their change within 2000–2010 is presented. One of the main drivers of land change is urbanization, which consumes other land types in order to expand. The artificial surfaces class contains human activities-driven surfaces as indicated in . The extent of each land cover type for each continent and each timestamp is presented in .
Table 2. The extent of land cover types across the globe in terms of square kilometres.
A trend analysis of artificial surfaces within the study period across the continents is conducted as follows. As shown in (b), the most net changes in terms of square kilometres took place in Asia, North America, Africa, Europe, and South America, respectively. In terms of percentage of change relate to the base year (2000), Africa witnessed 10.4% and Asia 9.4% followed by South America (6.8%), North America (5.2%), and Europe (1.6%). A negative balance of developments in Australia (−0.6%) mainly in favour of conversion to grasslands is evident.
Figure 3. The variation of cultivated lands (a), artificial surfaces (b), forests (c), grasslands (d), scrublands (e), wetlands (f), barelands (g), and water bodies (h) across different continents within 2000–2010.
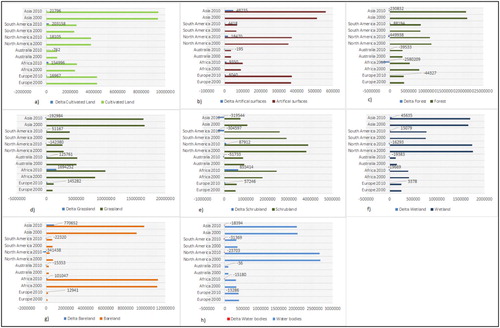
Cultivated land class was also one of the main contributors to land cover change within the study period. A trend analysis of this class across the continents reveals that except for a slight negative difference in Australia, the extent of cultivated lands expanded across other continents. As this variation is shown in (a), the areal change (in terms of square kilometres) in favour of cultivated lands occurred most in South America and Africa followed by Asia, North America, and Europe. In terms of change percentage relate to the base year (2000), South America witnessed 8.7% and Africa 6.4% followed by North America (0.5%), Europe (0.4%), and Asia (0.2%).
Forests across the continents went under massive changes and had a great deal of loss. This process is called deforestation. In general, deforestation took place globally across the continents except for South America (with 1.1% forestation), while Africa, North America, and Asia witnessed massive deforestation within 10 years. It is surprising to see a positive decrease in favour of forestation in South America while several studies (Richards et al. Citation2012; Mosandl et al. Citation2008) have reported massive deforestation across South America despite local forest recovery (Aide et al. Citation2013). This calls for a deeper study into this continent and this phenomenon.
(c) shows the corresponding magnitude of deforestation. In terms of change percentage related to the base year (2000), Africa lost 32.8%, North America 4.0%, Asia 1.1%, and Europe and Australia 1.2% of their forests’ extent. Grasslands also went under massive changes, for instance, Asia and North America lost a vast area of grasslands while in Africa, South America, Australia, and Europe expansion of grasslands are evident. The forests and scrublands are the major contributors to these changes. The trade-offs of scrublands between the other classes are shown in (d,e).
The dynamism of Wetlands shows interesting patterns across the continents. North America, Australia, and Africa lost a large portion of their wetlands, while the extent of wetlands in Europe, South America, and Asia expanded. (f) shows the statistics of change for wetlands. Analysis of barelands across the continents shows a large extent of its expansion and shrinkage across the continents. The process of bareland expansion represents desertification. As shown in (g), Asia, Africa, and Europe witnessed desertification at considerable rates, while South America, North America, and Australia lost the extent of the barelands.
Analysis of water bodies presents remarkable insights about its dynamics as shown in (h). In general, the balance of water bodies within 2000–2010 is negative globally, i.e. the extent of water bodies shrank. It is an emerging topic for exploration as it can be an indicator for measuring the impacts of climate change across the globe.
3.2. Per continent analysis
3.2.1. Europe
According to GlobeLand30-2010, almost 37.8%, 32.9%, 10.7%, 5.1%, 2.2%, 3.4%, 3.0%, 3.3%, and 1.5% of Europe is covered by cultivated lands, forests, grasslands, scrublands, wetlands, water bodies, tundra, artificial surfaces, and barelands, respectively.
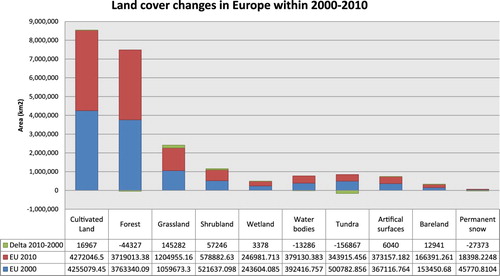
Change analysis reveals that the least persistent classes are cultivated lands (72.2%), scrublands (75.6%), grasslands (81.7%), permanent ice (82%), wetlands (83.3%), barelands (83.9%), artificial surfaces (87.1%), tundra (87.6%), forests (89.4%), and water bodies (90.8%). Furthermore, 12.1% of forest and 7% grasslands (an annual rate of 6400 and 3700 km2, respectively) were converted to cultivated lands, while 9.6% of cultivated lands were converted to artificial surfaces. This number for a 10-year period with an average annual rate of 3000 km2 and for a stable continent, i.e. Europe, is substantial.
presents the gains and losses of each land cover type within 2000–2010. Considerable gains of grasslands, scrublands, cultivated lands, and barelands are evident while tundra, forests, permanent snow, and water bodies lost a large area. A total 6040 km2 of artificial surfaces development is also considerable and requires paying further attention in researching the underlying causes and consequences.
Figure 4. Land cover change statistics across Europe within 2000–2010.
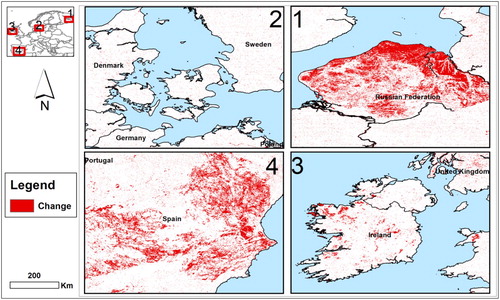
Four close-up windows highlighting the vibrant spots of land cover change in Europe is presented in . In general, a large number of speckle change pixels are spread all over the Europe while the magnitude of change in some areas are considerably denser namely in Spain, Ireland, west Russia, and Nordic countries.
Figure 5. Spatial patterns of land cover change in Europe and the changes within 2000–2010 are represented in red colour (colour online only).
3.2.2. Asia
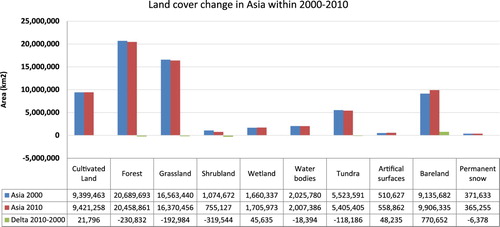
Analysis of change in Asia presents the following insights. A large expansion of barelands (770,652 km2) at a mean annual rate of 77,000 km2 is evident. This means that every year on average, an area equal to the total size of Belgium and Switzerland was converted to barelands. It should be noted that in addition to the massive size of this change, expansion of barelands is the most critical land cover change type as it messages massive desertification happening in Asia. Thereafter, artificial surfaces gained 48,235 km2, which exceeds the entire area of Switzerland. In other words, 10% of the entire artificial surfaces in Europe is developed within 10 years in Asia. Cultivated lands were expanded in total of 21,796 km2.
The other massive losses are in favour of scrublands, forests, grassland, and tundra. This indicates that Asia witnessed substantial changes within 2000–2010 including deforestation, urbanization, and de-greenification (refers to removing green spaces e.g. grasslands and scrublands) as outlined in Sternberg et al. (Citation2011), Chen et al. (Citation2013), and Higginbottom and Symeonakis (Citation2014). demonstrates the historical changes in Asia.
Figure 6. Land cover change statistics across Asia within 2000–2010.
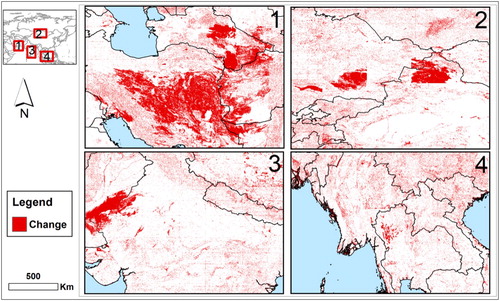
presents four close-ups across Asia highlighting the massive changes across this continent. Vibrant spots of change are spread all over the continent with vibrant spots in China, India, Middle East (e.g. Iran), and south East Asia. It is important to conduct an in-depth analysis of change in those regions in order to identify the causes of these changes and their potential consequences. As Asia is the most populous continent with decreasing resources, it raises a lot of concerns about the future status of the living population and the possible scenarios in case of lack of food resources (Feng et al. Citation2015; Vaz Citation2016).
Figure 7. Spatial patterns of changes for four selected vibrant spots within 2000–2010 in Asia are represented in red colour (colour online only).
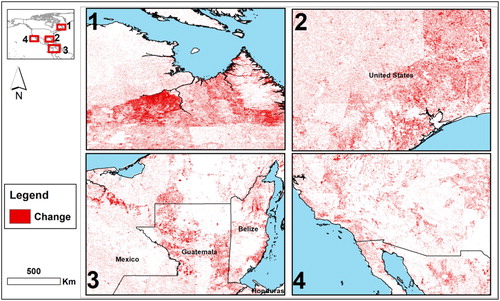
3.2.3. North America
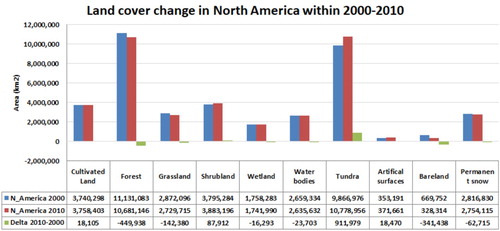
North America also witnessed massive changes across all land cover classes within 2000–2010 as shown in . Land cover classes such as tundra, scrublands, artificial surfaces, and cultivated lands gained extra area while the remaining classes lost their extents. Among them, the gain of tundra class is considerably high with a mean annual rate of 91,200 km2, which are mainly a conversion of forests and barelands. In terms of losses, forests, barelands, and grasslands are the major classes followed by permanent snow, water bodies, and wetlands.
Figure 8. Land cover change statistics across North America within 2000–2010.
visualizes the vibrant spots of land cover change across North America. While the change pixels are spread across the continent, considerable changes are evident in Canada, US east and west coasts, Mexico, and Caribbean Sea surrounding countries.
Figure 9. Spatial patterns of changes in North America within 2000–2010 are represented in red colour (colour online only).
3.2.4. South America
presents the areal values and the gain/loss of each class. Land change statistics account for a considerable expansion of cultivated lands, forests, grasslands, and wetlands while scrublands, bareland, and water bodies have shrunk. The calculated area for these changes is as follows except for Tundra as no Tundra is identified in South America. The expansion of cultivated lands is about 203,158 km2, which accounts for a considerable rate of exceeding 20,000 km2 per year. Forests expanded at a rate of almost 8820 km2 per year summing up to 88,194 km2. Grasslands also considerably expanded at an average annual rate of 51,100 km2 summing up 51,167 km2, in total. The expansion of the above-mentioned classes is the result of shrinking scrublands, water bodies, and barelands, which accounts for annual shrinkage rates of 30,460, 3137, and 2232 summing up to 304,597, 31,369, and 22,320 km2, respectively. It should be noted that the expansion of artificial surfaces, i.e. urbanization, took place at an annual rate of 442 km2 with a total area of 4418 km2. Permanent snow and ice shrank with a total area of 3730 km2.
Figure 10. Land cover change statistics across South America within 2000–2010.
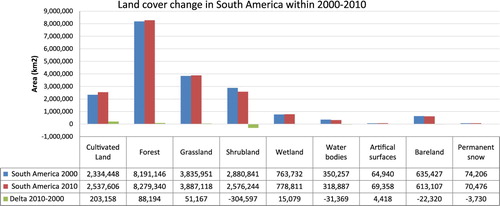
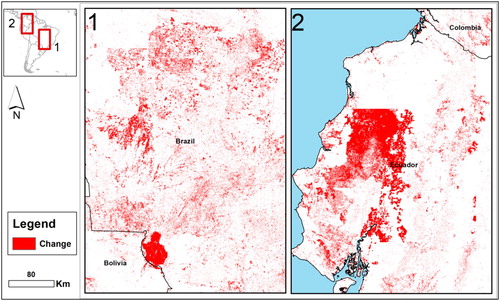
As a result, South America within 2000–2010 witnessed a large rate of land change mainly in the form of greenification, i.e. farming, forestry deducted mainly from barelands, and scrublands. It raises big concerns on the reduction of water bodies and permanent snow and ice from the South Pole. A slight rate of urbanization is also detected. These findings pave avenues for emerging research questions on the underlying causes and forthcoming consequences of the massive dynamism. demonstrates the spatial patterns of change in South America.
Figure 11. Spatial patterns of land cover in South America and the changes within 2000–2010 are represented in red colour (colour online only).
3.2.5. Australia
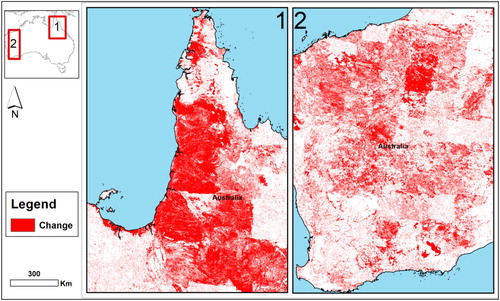
presents the areal coverage of land cover types with their gains/losses. Land change statistics account a considerable shrinkage of forests scrublands, wetlands, and barelands with rough average annual rates of 19,500, 5200, 2000, and 1500 km2, while grasslands were expanded at an average annual rate of 12,500 km2. On the contrary, the change of artificial surfaces, cultivated lands, water bodies, and permanent snow/ice seems to be comparatively considerably less. However, it seems sceptical to see a decreasing rate for artificial surfaces, which calls for a detailed study on the validity of these numbers as well as its causes and consequences in a detailed study.
Figure 12. Land cover change statistics across Australia within 2000–2010.
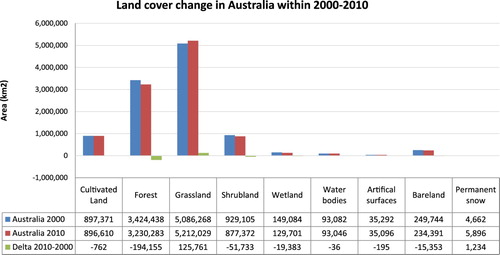
shows the spatial distribution of land change across this continent. The intense changes are located in the northern Queensland and west part of Western Australia states.
Figure 13. Spatial patterns of land cover changes across Australia within 2000–2010 are represented in red colour (colour online only).
3.2.6. Africa
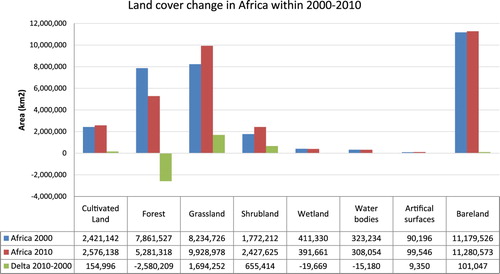
Change analysis of Africa shows interesting insights about the type and magnitude of change in this continent. The least persistent classes are grasslands (33.3%), scrublands (47.7%), and forests (48.7%), while water bodies and wetlands are the most persistent ones. In terms of net changes, forests were the major class with a negative balance and a substantial annual rate of almost 258,000 km2, which is comparatively threefold bigger than the country of Austria. In other words, every four months, forests with the same area of entire Austria were removed. Other classes such as wetlands and water bodies also lost their extent. In terms of gains, barelands, grasslands, scrublands, and cultivated lands were extended with considerable rates. The total expansion of barelands within 10 years is three times bigger than the size of entire Germany. The change of artificial surfaces was about 9350 km2, which seems to be below the expectations due to the recent massive developments in Africa. In conclusion, the changes in Africa message enormous deforestation and desertification. presents the statistics of land cover change in Africa.
Figure 14. Land cover change statistics across Africa within 2000–2010.
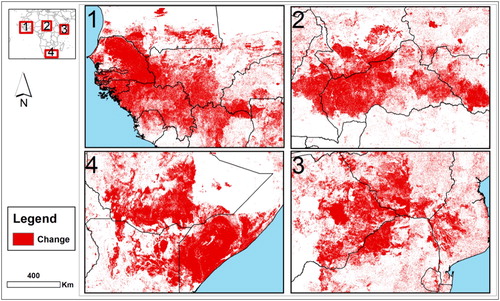
presents a visual analysis of extreme changes across Africa in four selected areas. The major changes are evident in central Africa towards Southern Africa.
Figure 15. Spatial patterns of land cover changes across Africa for four selected close-ups within 2000–2010 are represented in red colour (colour online only).
4. Discussions and conclusions
GlobeLand30 is the first multi-temporal and fine resolution global land cover product with a 10-year interval, which is produced through an advanced and consistent classification approach as outlined in Chen et al. (Citation2015a). In terms of spatial resolution, it is about 100 times finer than the other global land cover products in terms of areal coverage. Thus, it can offer finer insights about the existing landscape patterns as well as the opportunity to build a wide range of global and regional applications. This study aimed at analysing the GlobeLand30-2000 and GlobeLand30-2010 datasets for characterizing the global landscapes and the distribution of different land cover types across the continents. Furthermore, the study aimed at measuring the rate and form of land cover change within 2000–2010 as well as identifying the extreme land cover changes across the globe. This helps a wide range of end users including academics, land managers, and environmentalists to (a) discover what and how much resources are available in each continent, (b) how much change the globe witnessed within a 10-year study period into twenty-first century, and (c) what emerging land change patterns call for immediate attention in order to determine their underlying causes as well as the emerging consequences.
The analysis conducted in this study shows interesting and alarming patterns of land change across the globe within 2000–2010. In general, a high degree of dynamism across the globe within this period with diverse land change types is evident. For example, substantial deforestation, desertification, shrinkage of wetlands and water bodies, and urbanization have been identified. In terms of change locations, the change pixels are spread all over the world with varying vibrant spots and persistent spots of change. The magnitude of change varies depending on the form of land change, i.e. deforestation, desertification, water bodies shrinkage, and urbanization. The findings show that Africa, Asia, and South and North America witnessed artificial surfaces expansion relate to the base year (2000) ranging from 5.2% to 10.4%. The percentage of change for cultivated lands for South America and Africa was 8.7% and 6.4%, respectively. The extent of forests changed considerably as if South America witnessed 1.1% forestation, while Africa, North America, and Asia witnessed massive deforestation with 32.8%, 4%, and 1.2%, respectively.
The dynamism of Wetlands proves that North America, Australia, and Africa lost a large portion of their wetlands while the extent of wetlands in Europe, South America, and Asia expanded. Analysis of barelands across the continents shows a large expansion of barelands as if it can be interpreted as desertification, in Asia, Africa, and south Europe. However, the extent of the barelands in South America, North America, and Australia has decreased. In general, water bodies shrank globally within 2000–2010. It calls for a profound analysis of their causing factors and the foreseen consequences.
In terms of continents, while almost 38% and 33% of Europe is covered by cultivated lands and forests, respectively, they were the most vulnerable land types to change. This is somewhat disappointing to realize large losses of green spaces in a sustainable continent, i.e. Europe. Asia witnessed a large expansion of barelands at an average annual rate of 77,000 km2, which is substantial. This means that on average every year an area equal to the size of Belgium and Switzerland was converted to barelands, i.e. desertification. Vibrant spots of change are concentrated over China, India, Middle East, and south East Asia. Furthermore, artificial surfaces gained 48,235 km2 exceeding the entire area of Switzerland. The area of cultivated lands expanded.
In North America, the gain of tundra class is considerably high, which is a result of conversion of forests and barelands. In terms of losses, forests, barelands, and grasslands are the major targets. In South America, a considerable expansion of cultivated lands, forests, grasslands, and wetlands is evident, while scrublands, barelands, and water bodies have shrunk. This implies that land change is in favour of so-called greenification, i.e. agricultural expansion, forestry deducted mainly from barelands and scrublands. The reduction of water bodies and permanent snow and ice from the South Pole raises big concerns. In Africa, the least persistence classes are forests, scrublands, and grasslands at high rates, which message deforestation and removal of green spaces. The mean annual rate of deforestation is almost 258,000 km2, which is threefold bigger than the area of Austria. Other classes such as wetlands and water bodies also lost a large extent, while barelands gained larger extent. Australia seems to be comparatively the least dynamic continent mainly losing forests, scrublands, wetlands, and barelands, while expanding grasslands.
It should be noted that this rate of change occurred only in 10 years and if we look at long-term perspectives of changes, overwhelming results can be expected. While there is no available dataset with similar capabilities to measure the long-term rates of change, it would be interesting to see how the future landscapes would look like by using predictive models. The statistics presented here are drawn based on GlobeLand30 datasets and might vary while compared to statistics extracted from other sources. This is naturally a valid argument, because of (a) different classification methods applied while producing them, (b) dissimilar classification nomenclature with differing land type explanation, and (c) different spatial resolution and temporal coverage, among others.
Land change has positive and negative aspects, for example bareland expansion can be a negative change while developing green spaces and cultivations might be a positive change depending on the local circumstances. Thus, future directions should focus on the bottom-up analysis of land change across countries under high change pressure. Furthermore, the underlying factors for change should be discovered and their role should be analysed. Finally, predictive modelling of land change across different landscapes can be beneficial to a wide range of end users to receive the estimates, spatial distribution, as well as temporal occurrence of land changes. It is of great importance for global and national policy-makers to explore the relationship between land cover change and emerging climate change effects such as drought (Gilmore Pontius, Huffaker, and Denman Citation2004; Bajgiran et al. Citation2008; Jokar Arsanjani et al. Citation2015a) and dust storms (Cao et al. Citation2015; Samadi et al. Citation2014), among others. While land cover dynamics across some parts of the planet have been practically studied, a large part of the planet has not been explored. Doing so helps to identify their locations and patterns along with the underlying driving forces so that local land managers and policy-makers can receive detailed and recent information about them. For instance, developing countries, which lack resources and expertise for generating national land cover maps, can greatly benefit from using GlobeLand30 for various applications including change detection across their countries, integrating in their spatial decision-making processes. Furthermore, international organizations can benefit from using this dataset for gaining impressions about the global landscapes.
GlobeLand30 dataset also requires quality improvement similar to any other dataset; therefore, it is recommended to contribute to the improvement of its accuracy. To do so, users can access its official online platform and report the false classified pixels. This helps the data producers greatly to improve the quality of this dataset constantly. Successful examples of volunteers’ contribution to data collection and quality enhancement are seen in collaborative mapping projects such as OpenStreetMap (Fonte et al. Citation2017; Jokar Arsanjani et al. Citation2015b) and GeoWiki (Fritz et al. Citation2009). Finally, it should be noted that global and regional studies based on such a fine resolution dataset, i.e. 30 m, demands high computational resources and patience, because the size and number of pixels for processing are enormous and far beyond the traditional datasets.
With regards to suitability of GlobeLand30 for predictive analysis of land change, the findings show massive changes being captured by this dataset. Taking the reported quality of this dataset to account as well as the data uncertainty, which might propagate throughout change modelling, it would be worthwhile exploring this further using a case study and an application as recommended in Olofsson et al. (Citation2013).
Disclosure statement
No potential conflict of interest was reported by the author.
ORCID
Jamal Jokar Arsanjani http://orcid.org/0000-0001-6347-2935
References
- Aide, T. M., M. L. Clark, H. Ricardo Grau, D. López-Carr, M. A. Levy, D. Redo, M. Bonilla-Moheno, G. Riner, M. J. Andrade-Núñez, and M. Muñiz. 2013. “Deforestation and Reforestation of Latin America and the Caribbean (2001–2010).” Biotropica 45 (2): 262–271. doi: 10.1111/j.1744-7429.2012.00908.x
- Arino, O., J. J. R. Perez, V. Kalogirou, S. Bontemps, P. Defourny, and E. V. Bogaert. 2012. “Global Land Cover Map for 2009 (GlobCover 2009).” PANGAEA. doi:10.1594/PANGAEA.787668.
- Bajgiran, P. R., A. A. Darvishsefat, A. Khalili, and M. F. Makhdoum. 2008. “Using AVHRR-Based Vegetation Indices for Drought Monitoring in the Northwest of Iran.” Journal of Arid Environments 72 (6): 1086–1096. doi:10.1016/j.jaridenv.2007.12.004.
- Bartholomé, E., and A. S. Belward. 2005. “GLC2000: A New Approach to Global Land Cover Mapping from Earth Observation Data.” International Journal of Remote Sensing 26 (9): 1959–1977. doi:10.1080/01431160412331291297.
- Batisani, N., and B. Yarnal. 2009. “Uncertainty Awareness in Urban Sprawl Simulations: Lessons from a Small US Metropolitan Region.” Land Use Policy 26 (2): 178–185. doi:10.1016/j.landusepol.2008.01.013.
- Belward, A. S., J. E. Estes, and K. D. Kline. 1999. “The IGBP-DIS Global 1-km Land-Cover Data set DISCover: A Project Overview.” Photogrammetric Engineering and Remote Sensing 65 (9): 1013–1020.
- Brovelli, M., M. Molinari, E. Hussein, J. Chen, and R. Li. 2015. “The First Comprehensive Accuracy Assessment of GlobeLand30 at a National Level: Methodology and Results.” Remote Sensing 7 (4): 4191–4212. doi:10.3390/rs70404191.
- Brown, G., J. M. Montag, and K. Lyon. 2012. “Public Participation GIS: A Method for Identifying Ecosystem Services.” Society and Natural Resources 25 (7): 633–651. doi:10.1080/08941920.2011.621511.
- Cao, H., F. Amiraslani, J. Liu, and N. Zhou. 2015. “Identification of Dust Storm Source Areas in West Asia Using Multiple Environmental Datasets.” Science of The Total Environment 502: 224–235. doi:10.1016/j.scitotenv.2014.09.025.
- Cao, X., J. Chen, L. J. Chen, A. P. Liao, F. D. Sun, Y. Li, L. Li, Z. H. Lin, Z. G. Pang, and J. Chen. 2014. “Preliminary Analysis of Spatiotemporal Pattern of Global Land Surface Water.” Science China Earth Sciences 57 (10): 2330–2339. doi: 10.1007/s11430-014-4929-x
- Chen, H. 2011. Entwicklung von Verfahren zur Beurteilung und Verbesserung der Qualität von Navigationsdaten. Universität Stuttgart, Stuttgart.
- Chen, J., J. Chen, A. Liao, X. Cao, L. Chen, X. Chen, C. He, et al. 2015a. “Global Land Cover Mapping at 30m Resolution: A POK-Based Operational Approach.” ISPRS Journal of Photogrammetry and Remote Sensing 103: 7–27. doi:10.1016/j.isprsjprs.2014.09.002.
- Chen, J., L. Chen, R. Li, A. Liao, S. Peng, N. Lu, and Y. Zhang. 2015b. “Spatial Distribution and Ten Years Change of Global Built-up Areas Derived From GlobeLand30.” Acta Geodaetica et Cartographica Sinica 44 (11): 1181–1188.
- Chen, X., J. Bai, X. Li, G. Luo, J. Li, and B. L. Li. 2013. “Changes in Land Use/Land Cover and Ecosystem Services in Central Asia During 1990–2009.” Current Opinion in Environmental Sustainability 5 (1): 116–127. doi: 10.1016/j.cosust.2012.12.005
- DeFries, R. 2008. “Terrestrial Vegetation in the Coupled Human-Earth System: Contributions of Remote Sensing.” Annual Review of Environment and Resources 33: 369–390. doi: 10.1146/annurev.environ.33.020107.113339
- Feng, Q., J. Gong, J. Liu, and Y. Li. 2015. “Monitoring Cropland Dynamics of the Yellow River Delta Based on Multi-Temporal Landsat Imagery Over 1986 to 2015.” Sustainability 7 (11): 14834–14858. doi:10.3390/su71114834.
- Foley, J. A., R. DeFries, G. P. Asner, C. Barford, G. Bonan, S. R. Carpenter, F. Stuart Chapin, M. T. Coe, G. C. Daily, and H. K. Gibbs. 2005. “Global Consequences of Land use.” Science 309 (5734): 570–574. doi: 10.1126/science.1111772
- Fonte, C. C., J. A. Patriarca, M. Minghini, V. Antoniou, L. See, and M. A. Brovelli. 2017. “Using OpenStreetMap to Create Land Use and Land Cover Maps: Development of an Application.” In Volunteered Geographic Information and the Future of Geospatial Data, edited by C. E. C. Campelo, M. Bertolotto, and P. Corcoran, 113–137. Hershey, PA: IGI Global. doi: 10.4018/978-1-5225-2446-5.ch007
- Foody, G. M., and D. S. Boyd. 2013. “Using Volunteered Data in Land Cover Map Validation: Mapping West African Forests.” IEEE Journal of Selected Topics in Applied Earth Observations and Remote Sensing 6 (3): 1305–1312. doi:10.1109/JSTARS.2013.2250257.
- Fritz, S., I. Mccallum, C. Schill, C. Perger, R. Grillmayer, F. Achard, F. Kraxner, M. Obersteiner, and L. Cover. 2009. “Geo-Wiki.Org: The Use of Crowdsourcing to Improve Global Land Cover.” Remote Sensing 1 (3): 345–354. doi:10.3390/rs1030345.
- Fritz, S., L. See, I. McCallum, C. Schill, M. Obersteiner, M. van der Velde, H. Boettcher, P. Havlík, and F. Achard. 2011. “Highlighting Continued Uncertainty in Global Land Cover Maps for the User Community.” Environmental Research Letters 6 (4): 44005. doi:10.1088/1748-9326/6/4/044005.
- Gilmore Pontius, R. Jr., D. Huffaker, and K. Denman. 2004. “Useful Techniques of Validation for Spatially Explicit Land-Change Models.” Ecological Modelling 179 (4): 445–461. http://www.sciencedirect.com/science/article/pii/S0304380004002716. doi: 10.1016/j.ecolmodel.2004.05.010
- Giri, C., B. Pengra, J. Long, and T. R. Loveland. 2013. “Next Generation of Global Land Cover Characterization, Mapping, and Monitoring.” International Journal of Applied Earth Observation and Geoinformation 25 (1): 30–37. doi:10.1016/j.jag.2013.03.005.
- Gong, P., J. Wang, L. Yu, Y. Zhao, Y. Zhao, L. Liang, Z. Niu, et al. 2013. “Finer Resolution Observation and Monitoring of Global Land Cover: First Mapping Results with Landsat TM and ETM+ Data.” International Journal of Remote Sensing 34 (7): 2607–2654. doi:10.1080/01431161.2012.748992.
- Han, G., J. Chen, C. He, S. Li, H. Wu, A. Liao, and S. Peng. 2015. “A Web-Based System for Supporting Global Land Cover Data Production.” ISPRS Journal of Photogrammetry and Remote Sensing 103: 66–80. doi:10.1016/j.isprsjprs.2014.07.012.
- Hansen, M. C., R. S. DeFries, J. R. G. Townshend, and R. Sohlberg. 2000. “Global Land Cover Classification at 1 km Spatial Resolution Using a Classification Tree Approach.” International Journal of Remote Sensing 21 (6–7): 1331–1364. doi: 10.1080/014311600210209
- Hansen, M. C., P. V. Potapov, R. Moore, M. Hancher, S. A. Turubanova, A. Tyukavina, D. Thau, S. V. Stehman, S. J. Goetz, and T. R. Loveland. 2013. “High-Resolution Global Maps of 21st-Century Forest Cover Change.” Science 342 (6160): 850–853. doi: 10.1126/science.1244693
- Hansen, M. C., and B. Reed. 2000. “A Comparison of the IGBP DISCover and University of Maryland 1 km Global Land Cover Products.” International Journal of Remote Sensing 21 (6–7): 1365–1373. doi: 10.1080/014311600210218
- Higginbottom, T. P., and E. Symeonakis. 2014. “Assessing Land Degradation and Desertification Using Vegetation Index Data: Current Frameworks and Future Directions.” Remote Sensing 6 (10): 9552–9575. doi: 10.3390/rs6109552
- IPCC. 2007. “Climate Change 2007: The Physical Science Basis.” Agenda 6 (7): 333.
- Jokar Arsanjani, J., M. Helbich, and E. Vaz. 2013. “Spatiotemporal Simulation of Urban Growth Patterns Using Agent-Based Modeling: The Case of Tehran.” Cities 32: 33–42. doi:10.1016/j.cities.2013.01.005.
- Jokar Arsanjani, T., R. Javidan, M. J. Nazemosadat, J. Jokar Arsanjani, and E. Vaz. 2015a. “Spatiotemporal Monitoring of Bakhtegan Lake’s Areal Fluctuations and an Exploration of its Future Status by Applying a Cellular Automata Model.” Computers and Geosciences 78 (0): 37–43. doi:10.1016/j.cageo.2015.02.004.
- Jokar Arsanjani, J., P. Mooney, A. Zipf, and A. Schauss. 2015b. “Quality Assessment of the Contributed Land Use Information from OpenStreetMap Versus Authoritative Datasets.” In OpenStreetMap in GIScience, edited by J. Jokar Arsanjani, A. Zipf, P. Mooney, and M. Helbich, 37–58. Lecture Notes in Geoinformation and Cartography. Cham: Springer.
- Jokar Arsanjani, J., L. See, and A. Tayyebi. 2016. “Assessing the Suitability of GlobeLand30 for Mapping Land Cover in Germany.” International Journal of Digital Earth 9 (9): 873–891. doi:10.1080/17538947.2016.1151956.
- Jokar Arsanjani, J., A. Tayyebi, and E. Vaz. 2016. “GlobeLand30 as an Alternative Fine-Scale Global Land Cover map: Challenges, Possibilities, and Implications for Developing Countries.” Habitat International 55: 25–31. doi: 10.1016/j.habitatint.2016.02.003
- Lambin, E. F., B. L. Turner, H. J. Geist, S. B. Agbola, A. Angelsen, J. W. Bruce, O. T. Coomes, et al. 2001. “The Causes of Land-Use and Land-Cover Change: Moving Beyond the Myths.” Global Environmental Change 11 (4): 261–269. doi:10.1016/S0959-3780(01)00007-3.
- Loveland, T. R., Z. Zhu, D. O. Ohlen, J. F. Brown, B. C. Reed, and L. Yang. 1999. “An Analysis of the IGBP Global Land-Cover Characterization Process.” Photogrammetric Engineering and Remote Sensing 65: 1021–1032.
- Mas, J. 2004. “Modelling Deforestation Using GIS and Artificial Neural Networks.” Environmental Modelling and Software 19 (5): 461–471. doi:10.1016/S1364-8152(03)00161-0.
- Miao, R., Y. Song, Z. Sun, M. Guo, Z. Zhou, and Y. Liu. 2016. “Soil Seed Bank and Plant Community Development in Passive Restoration of Degraded Sandy Grasslands.” Sustainability 8 (6): 581. doi:10.3390/su8060581.
- Mosandl, R., S. Günter, B. Stimm, and M. Weber. 2008. “Ecuador Suffers the Highest Deforestation Rate in South America.” In Gradients in a Tropical Mountain Ecosystem of Ecuador, edited by E. Beck, J. Bendix, I. Kottke, F. Makeschin, and R. Mosandl, 37–40. Berlin: Springer.
- Olofsson, P., G. M. Foody, S. V. Stehman, and C. E. Woodcock. 2013. “Making Better Use of Accuracy Data in Land Change Studies: Estimating Accuracy and Area and Quantifying Uncertainty Using Stratified Estimation.” Remote Sensing of Environment 129: 122–131. doi: 10.1016/j.rse.2012.10.031
- Pielke, R. A., A. Pitman, D. Niyogi, R. Mahmood, C. McAlpine, F. Hossain, K. K. Goldewijk, U. Nair, R. Betts, and S. Fall. 2011. “Land Use/Land Cover Changes and Climate: Modeling Analysis and Observational Evidence.” Wiley Interdisciplinary Reviews: Climate Change 2 (6): 828–850.
- Pineda Jaimes, N. B., J. B. Sendra, M. G. Delgado, and R. F. Plata. 2010. “Exploring the Driving Forces Behind Deforestation in the State of Mexico (Mexico) Using Geographically Weighted Regression.” Applied Geography 30 (4): 576–591. doi:10.1016/j.apgeog.2010.05.004.
- Reynolds, J. F., and D. M. Stafford Smith. 2002. “Do Humans Cause Deserts.” In Global Desertification: Do Humans Cause Deserts, edited by J. F. Reynolds and D. M. Stafford Smith, 1–21. Berlin: Dahlem University Press.
- Richards, P. D., R. J. Myers, S. M. Swinton, and R. T. Walker. 2012. “Exchange Rates, Soybean Supply Response, and Deforestation in South America.” Global Environmental Change 22 (2): 454–462. doi: 10.1016/j.gloenvcha.2012.01.004
- Roach, J. K., B. Griffith, and D. Verbyla. 2013. “Landscape Influences on Climate-Related Lake Shrinkage at High Latitudes.” Global Change Biology 19: 2276–2284. doi:10.1111/gcb.12196.
- Samadi, M., A. D. Boloorani, S. K. Alavipanah, H. Mohamadi, and M. S. Najafi. 2014. “Global Dust Detection Index (GDDI); a New Remotely Sensed Methodology for Dust Storms Detection.” Journal of Environmental Health Science and Engineering 12 (1): 20. doi: 10.1186/2052-336X-12-20
- Seto, K. C., B. Güneralp, and L. R. Hutyra. 2012. “Global Forecasts of Urban Expansion to 2030 and Direct Impacts on Biodiversity and Carbon Pools.” Proceedings of the National Academy of Sciences of the United States of America 109 (40): 16083–16088. doi:10.1073/pnas.1211658109.
- Sternberg, T., R. Tsolmon, N. Middleton, and D. Thomas. 2011. “Tracking Desertification on the Mongolian Steppe Through NDVI and Field-Survey Data.” International Journal of Digital Earth 4 (1): 50–64. doi: 10.1080/17538940903506006
- Tayyebi, A., B. K. Pekin, B. C. Pijanowski, J. D. Plourde, J. S. Doucette, and D. Braun. 2013. “Hierarchical Modeling of Urban Growth Across the Conterminous USA: Developing Meso-Scale Quantity Drivers for the Land Transformation Model.” Journal of Land Use Science 8 (4): 422–442. doi:10.1080/1747423X.2012.675364.
- Tayyebi, A., A. H. Tayyebi, J. Jokar Arsanjani, H. S. Moghadam, and H. Omrani. 2016. “FSAUA: A Framework for Sensitivity Analysis and Uncertainty Assessment in Historical and Forecasted Land use Maps.” Environmental Modelling and Software 84: 70–84. doi:10.1016/j.envsoft.2016.06.018.
- Townshend, J. R., J. G. Masek, C. Huang, E. F. Vermote, F. Gao, S. Channan, J. O. Sexton, M. Feng, R. Narasimhan, and D. Kim. 2012. “Global Characterization and Monitoring of Forest Cover Using Landsat Data: Opportunities and Challenges.” International Journal of Digital Earth 5 (5): 373–397. doi: 10.1080/17538947.2012.713190
- Turner, B. L., E. F. Lambin, and A. Reenberg. 2007. “The Emergence of Land Change Science for Global Environmental Change and Sustainability.” Proceedings of the National Academy of Sciences 104 (52): 20666–20671. doi: 10.1073/pnas.0704119104
- United Nations. 2014. “World Urbanization Prospects: The 2014 Revision, Highlights.” Population Division, United Nations. http://esa.un.org/unpd/wup/Highlights/WUP2014-Highlights.pdf.
- Vaz, E. 2016. “The Future of Landscapes and Habitats: The Regional Science Contribution to the Understanding of Geographical Space.” Habitat International 51: 70–78. doi:10.1016/j.habitatint.2015.10.004.
- Vaz, E., and J. Jokar Arsanjani. 2015. “Predicting Urban Growth of the Greater Toronto Area – Coupling a Markov Cellular Automata with Document Meta-Analysis.” Journal of Environmental Informatics 25 (2): 71–80. doi:10.3808/jei.201500299.
- Verburg, P. H., K. Neumann, and L. Nol. 2011. “Challenges in Using Land Use and Land Cover Data for Global Change Studies.” Global Change Biology 17 (2): 974–989. doi:10.1111/j.1365-2486.2010.02307.x.
- Verburg, P. H., C. J. E. Schulp, N. Witte, and A. Veldkamp. 2006. “Downscaling of Land Use Change Scenarios to Assess the Dynamics of European Landscapes.” Agriculture, Ecosystems and Environment 114 (1): 39–56. doi:10.1016/j.agee.2005.11.024.
- Weber, C., and A. Puissant. 2003. “Urbanization Pressure and Modeling of Urban Growth: Example of the Tunis Metropolitan Area.” Remote Sensing of Environment 86 (3): 341–352. http://www.sciencedirect.com/science/article/pii/S0034425703000774. doi: 10.1016/S0034-4257(03)00077-4