
 ?Mathematical formulae have been encoded as MathML and are displayed in this HTML version using MathJax in order to improve their display. Uncheck the box to turn MathJax off. This feature requires Javascript. Click on a formula to zoom.
ABSTRACT
Rapid estimates of impact areas following large earthquakes constitute the cornerstone of emergency response scenarios. However, collecting information through traditional practices usually requires a large amount of manpower and material resources, slowing the response time. Social media has emerged as a source of real-time ‘citizen-sensor data’ for disasters and can thus contribute to the rapid acquisition of disaster information. This paper proposes an approach to quickly estimate the impact area following a large earthquake via social media. Specifically, a spatial logistic growth model (SLGM) is proposed to describe the spatial growth of citizen-sensor data influenced by the earthquake impact strength after an earthquake; a framework is then developed to estimate the earthquake impact area by combining social media data and other auxiliary data based on the SLGM. The reliability of our approach is demonstrated in two earthquake cases by comparing the detected areas with official intensity maps, and the time sensitivity of the social media data in the SLGM is discussed. The results illustrate that our approach can effectively estimate the earthquake impact area. We verify the external validity of our model across other earthquake events and provide further insights into extracting more valuable earthquake information using social media.
1. Introduction
Large earthquakes often occur suddenly with little warning; consequently, disaster management can be a difficult task. A quick and efficient estimation of the impact area in which an earthquake will generate casualties and property damage is essential for emergency response protocols and loss estimation (Badal, Vázquez-prada, and González Citation2005). However, obtaining such information quickly is often challenging, and substantial amounts of manpower and material resources are needed to collect real-time information through traditional data acquisition practices such as spot investigations, telephone reporting or remote sensing (Panagiota, Jocelyn, and Erwan Citation2011; Li et al. Citation2018).
Because an increasing number of people use the Internet to publish and share information following natural disasters, it seems intuitive to employ the social web (‘Web 2.0’) as a new information source (Goodchild Citation2007; Goodchild and Glennon Citation2010). Unlike traditional data, these online user-generated data (e.g. Twitter messages and Flickr photos) enable low-cost data acquisition on an unprecedented temporal scale during disaster emergencies; thus, these data cannot be ignored in disaster-related decision-making endeavors (Enrico, Porto, and Alexander Citation2015; Huang and Xiao Citation2015; Kryvasheyeu et al. Citation2016).
Of particular interest here is that humans can be regarded as citizen sensors when they share their observations and views using mobile devices and social media platforms. The online messages generated by citizen sensors pertaining to real-world events are considered ‘citizen-sensor data’, which can be used to monitor user activities and ongoing event indicators (Goodchild Citation2007; Nagarajan et al. Citation2009; Sheth Citation2009). Particularly, during disaster emergencies, real-time online sensor data can promote the identification of disaster signals and enhance situational awareness (Earle, Bowden, and Guy Citation2011; Amit et al. Citation2014).
In earthquake management, the feedback from citizen sensors after an earthquake can effectively and qualitatively describe the ground motion effects and provide a possible way to identify the area throughout which an earthquake will generate casualties and property damage (Atkinson and Wald Citation2007). A number of recent research efforts have shown that online citizen-sensor data such as social media messages and other crowdsourcing data can be employed to explore the impact area after an earthquake (Crooks et al. Citation2013; Resch, Usländer, and Havas Citation2018). The abovementioned studies performed in this field used spatial clustering techniques and visualization approaches in spatial analysis to intuitively detect the impact areas; however, they generally focused on data hotspots while ignoring the spatial growth processes of citizen-sensor data following an earthquake, and they failed to reveal the relationship between the spatial distribution of the data and the impact area.
In this article, we argue that the spatial growth trend of post-earthquake citizen-sensor data influenced by the earthquake impact strength is similar to the logistic growth trend of a biological population, which can be quantitatively described. Based on this finding, we present an approach to quickly detect the impact area after a large earthquake via social media. Specifically, a theoretical model known as the spatial logistic growth model (SLGM) based on a logistic function is proposed to describe the spatial growth processes of citizen-sensor data following an earthquake, and the connection between the spatial growth trend of citizen-sensor data and the earthquake impact area is quantified. Furthermore, a framework is provided based on the SLGM to rapidly estimate an earthquake’s impact area by combining social media data with other auxiliary data.
To demonstrate the reliability of our approach, we implemented the proposed framework for two large earthquake cases and compared the detection results with official intensity maps from the United States Geological Survey (USGS). Moreover, we discussed the temporal sensitivity of the SLGM to social media data. The experimental results illustrate that the proposed SLGM is suitable for describing the spatial growth processes of citizen-sensor data and for effectively estimating the impact area in a short time. Our approach could represent an alternative option for authorities to better cope with earthquake emergencies in a timely manner. The external validity of the SLGM was verified across 18 other earthquake events, the limitations of the model were evaluated, and an additional text analysis was performed to obtain further insights into the quick extraction of more valuable information regarding earthquake emergencies.
This paper is structured as follows. Section 2 provides background information for the current work related to the use of social media for detecting earthquake information and the logistic function. Section 3 illustrates the construction of our model, while section 4 describes the proposed framework for quickly estimating the earthquake impact area via social media based on the proposed model. Section 5 presents two case studies to prove the feasibility of our approach. Section 6 discusses the performance and limitations of our model, and section 7 concludes with possible perspectives and extensions of our research.
2. Background
2.1. Social media analysis for detecting earthquake emergency information
The global diffusion of the Internet and citizen crowdsourcing has allowed social media to become a hotspot for detecting earthquake disaster information at a low cost (Steiger, Westerholt, and Zipf Citation2016). Given the tremendous volume of social media data, such data are limited in the information provided is not very precise or important (Ryoo and Moon Citation2014). However, this deficiency does not diminish the enthusiasm of scholars who study the detection of earthquake information based on social media data (Goolsby Citation2010). Over the past few years, numerous studies have examined the use of social media data for detecting earthquake emergency information. The main goals of these studies can be grouped into two types: real-time earthquake event detection and damage assessment.
For detection purposes, time series analysis and burst detectors based on a binomial model have been adopted to identify real-time seismic events (Sakaki, Okazaki, and Matsuo Citation2010; Sakaki, Toriumi, and Matsuo Citation2011; Robinson, Power, and Cameron Citation2013). Furthermore, Earle et al. (Citation2010) assessed the speed with which tweeters responded to the 30 March 2009 Morgan Hill earthquake and found that monitoring the earthquake by Twitter was faster than traditional monitoring. Similarly, Guy et al. (Citation2010) explored Twitter to detect seismic events and developed a software application called the Twitter Earthquake Detector (TED) for earthquake emergencies, and Fontugne et al. (Citation2011) detected earthquake occurrences from the behaviors of social media users during the outbreak of natural disasters.
In studies on damage assessment techniques, methods such as text mining, natural language processing techniques (e.g. support vector machines (SVMs), naive Bayesian classifications, and decision trees), spatial clustering analysis, network analysis, and visualization approaches have been applied (Sakaki, Okazaki, and Matsuo Citation2010; Judith and Nikolai Citation2011; Murakami and Nasukawa Citation2012). For example, Kim, Lee, and Zettsu (Citation2011) designed an mTrend system, which constructs and visualizes spatiotemporal trends in topics, based on geotagged tweets after the Tokyo earthquake in 2011 to explore the locations of and changes in disaster hotspots. Moreover, Fontugne et al. (Citation2011) described the nature of these events from tags posted on the Flickr website and evaluated the aftermaths of such disasters.
In the particular field of earthquake impact area detection, many researchers have attempted to analyze the areal extent of earthquake damage from social media. Some scholars utilized text analysis to determine the intensity level of each social media text and then used spatial interpolation to construct an earthquake intensity map (Cresci, Cimino, et al. Citation2015; Yang et al. Citation2016). However, despite the volume of data, only a few messages contained information regarding the damage. Crooks et al. (Citation2013) analyzed Twitter messages during the 2011 earthquake in Mineral, Virginia, to discern activity patterns, and they found that tweets within 10 min following an earthquake provided a good approximation of the impact area; however, their study lacked a quantitative basis, as they used only visualization methods to analyze the impact area. Burks, Miller, and Zadeh (Citation2014) used historical official intensity observations and earthquake-related tweets to construct regression models and then used those models to construct an earthquake shaking intensity map. Kropivnitskaya et al. (Citation2017) produced an accurate intensity map in real time by analyzing the relationship between the tweet rates and the earthquake intensity observations within 10 min after the earthquake. However, due to technological limitations, historical seismic data, ground motion recordings and corresponding social media data are not easily accessible. In addition, these methods exhibit some restrictions under different geographical conditions.
It should be noted that while these previous studies demonstrated great potential for using social media to identify earthquake-impacted areas, they nevertheless ignored compelling theoretical evidence on the correlation between the spatial distribution of data and the impact area.
2.2. Logistic function
The logistic function, which commonly exhibits an S-shaped (i.e. sigmoid-shaped) curve, boasts a lengthy history in statistics and modeling. The logistic function was proposed by the Belgian mathematician Verhulst, who studied it in relation to population growth (Tsoularis and Wallace Citation2002). displays the logistic function curve, the equation for which is as follows:(1)
(1) where e is the natural logarithm base, x0 represents the x-value of the sigmoid midpoint, l is the steepness of the curve, and K is the carrying capacity. The growth rate first increases and then begins to decelerate when x0 is reached, but the F value continues to increase until it reaches an asymptote, thereby forming an S-shaped curve.
Figure 1. The logistic function curve.
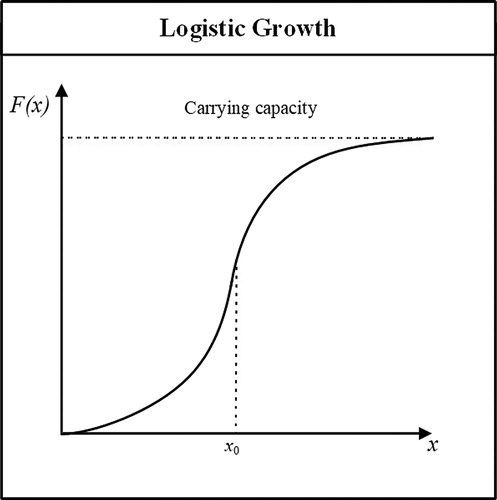
Researchers in a variety of disciplines have found that not only biological processes but also phenomena in other fields exhibit this S-shaped growth pattern (Bhowmick and Bhattacharya Citation2014). The simple structure of the classic logistic growth function has attracted the attention of many scientists who are eager to model data with S-shaped curves in their own work. Thus, the main emphasis of the logistic growth model is no longer the evolution of biological populations but rather the application of a model to real datasets from different disciplines, including demography (Dawed, Koya, and Goshu Citation2014), economic statistics (Tourres Citation2003), bacterial growth (Baranyi and Pin Citation2001), and behavioral ecology (Symonds and Moussalli Citation2011).
The logistic function has also appeared in earthquake management research related to social media (Zhu et al. Citation2011; Xu et al. Citation2012). In this field, the logistic function is used in regression models for message classification and landslide hazard mapping purposes. For instance, some studies used logistic regression to determine whether a set of tweets can describe target earthquake events (Carlos, Marcelo, and Barbara Citation2013; Sakaki, Okazaki, and Matsuo Citation2013). Additionally, others have used logistic regression to build a model of the factors affecting earthquake bursts based on tweets (Mizunuma et al. Citation2014). Furthermore, the logistic function has been used in neural network models for landslide susceptibility mapping to delineate landslide hazard areas following an earthquake occurrence (Xu et al. Citation2013).
These researchers applied the logistic function during several phases of analysis of social media data after an earthquake, and they especially focused on its regression and prediction abilities. In contrast, few studies have applied the logistic function to analyze the spatial growth of the distribution of social media data. In our work, we focus on the growth trend of the logistic function and use it to model the spatial growth of the social media citizen-sensor data distribution after an earthquake.
3. Spatial logistic growth model
We consider a generic model to reflect the spatial growth process of citizen-sensor data following an earthquake based on our online citizen responses assumptions, in which the connection between the data spatial growth trend and the earthquake impact area can be quantitatively described. Specifically, we find that the spatial growth trend of citizen-sensor data is similar to the logistic growth of a biological population. In virtue of the population logistic growth, we develop the proposed SLGM to describe the spatial growth process of citizen-sensor data. To better understand the proposed SLGM, we first introduce the model variables and analyze the data spatial growth trend, after which we present the proposed model.
3.1. Model variables
Our SLGM is a theoretical model that is used to delineate the spatial growth of the distribution of citizen-sensor data after an earthquake. The proposed model is presented as the mathematical evolution of the normalized citizen-sensor (by population) accumulation as a function of the distance from the earthquake epicenter. The variables included in our model are illustrated in .
Figure 2. Schematic diagram of each variable: (a) data distribution simulation; and (b) corresponding statistics.
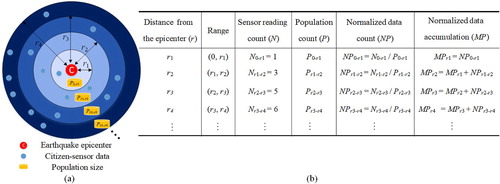
In a, the red point (c) represents the epicenter, and the blue points depict the citizen-sensor data. The interval between any two adjacent circles is constant. Each differently colored annulus represents a single region corresponding to a distance interval from the epicenter, where r represents the distance from the epicenter. The amount of citizen-sensor data in the region of an annulus (c; ri, ri+1) is represented by Nri ‐ ri+1. The population size in the region of an annulus (c; ri, ri+1) is represented by Pri ‐ ri+1, while NPri ‐ ri+1 is the amount of data normalized by the population (i.e. the higher the population is, the higher the probability of citizen-sensor data in the region). The amount of normalized data within a radius r is represented by MP, which is actually the accumulation of NP. b displays a table of the mathematical expressions of these variables.
3.2. Citizen-sensor data spatial growth trend analysis
Some researchers have discovered a certain connection between the willingness of people to publish relevant online messages after an earthquake and their distance from the epicenter (Sakaki, Okazaki, and Matsuo Citation2010; Sakaki, Toriumi, and Matsuo Citation2011). This connection ensures that citizen-sensor data is regularly spatially distributed and can thus be quantitatively described. Sakaki, Toriumi, and Matsuo (Citation2011) analyzed how people used Twitter after earthquakes in Japan. They found that in heavily damaged areas close to the epicenter, people were trapped in situations that were too difficult to post sensor readings or use the Internet; regarding people in damaged areas, those who were located far from the earthquake epicenter were more inclined to post relevant tweets than people who were closer to the epicenter; finally, people in safe areas were less inclined to post geolocated tweets than people in damaged areas during the initial stages of earthquake propagation.
Based on their findings, we conclude the following: in the earthquake impact area, with an increase in the distance from the earthquake epicenter (r), the amount of normalized citizen-sensor data (NP) and the data spatial growth rate (dMP/dr) will increase, as people farther away from the epicenter are more likely to post sensor data; when r reaches a critical distance, NP and the data spatial growth rate begin to decrease until the growth rate reaches 0, as people are less inclined to post relevant geolocated data in the area where the earthquake may not cause casualties and damage. The growth rate first increases and then begins to decrease when a certain distance is reached; this characteristic gives the relationship between the distance from the earthquake epicenter (r) and the normalized data accumulation (MP) an ‘S-shape’.
This S-shaped growth curve, which represents the abovementioned mathematical logistic curve, is often used to describe the logistic growth of a biological population: the population growth is rapid at the beginning, after which the growth begins to slow down when a certain indicator is reached, and then the growth stops completely (Tsoularis and Wallace Citation2002). Our assumption regarding the spatial growth of citizen-sensor data is similar to the logistic growth of biological populations over time. As Re (Citation2000) noted, ‘a statement need not match reality in all its aspects, relations, and/or details, but has to match it only as far as it goes’. Time and space are two basic forms of physical movement; therefore, applying a time-based theoretical approach to spatial analysis can enrich spatial data mining endeavors (Wang et al. Citation2007). Thus, we construct an analogy between the change in the biological population size over time and the change in the citizen-sensor data size over a given distance, thereby establishing a spatial growth model for citizen-sensor data after an earthquake.
3.3. Construction of the spatial logistic growth model
The three key features of logistic population growth are the following: a population must have a numerical upper bound on the growth size called the carrying capacity K; the growth rate (the increase in the population size per unit time) first increases and then decreases with increasing population size; and the population at the inflection point (where the growth rate is a maximum) is exactly half the carrying capacity. Similar to these, our model is developed under the following assumptions:
There is an upper limit to the number of the normalized citizen-sensor data the spatial environment can support; this limit is defined as the carrying capacity K of the spatial environment.
The data spatial growth rate (dMP/dr) first increases and then decreases with an increase in the accumulation of normalized sensor data MP.
The data accumulation at the inflection point (where the spatial growth rate is a maximum, at which r reaches the impact area critical distance) is exactly half the carrying capacity K/2.
shows the spatial growth pattern of citizen-sensor data. We use a simple structure of the classic logistic growth function to model our S-shaped citizen-sensor data growth curve. The SLGM is defined as follows:(2)
(2) All of the symbols used to describe the model formulation are listed in .
Figure 3. Spatial logistic growth of citizen-sensor data: the growth patterns of NP (the amount of normalized data) and MP (the accumulation of normalized data) are functions of the distance from the earthquake epicenter (r).
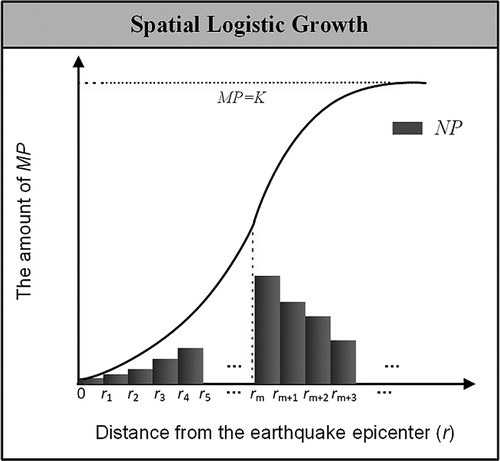
Table 1. The symbols used in the construction of the SLGM.
rm is the epicentral distance indicator of the impact area. In , we mark rm with a red dashed line for easy reference. To the left of the red dashed line, the spatial growth rate increases, whereas to the right of the red dashed line, the spatial growth rate begins to decelerate; the data accumulation MP keeps growing until it reaches K. The safe area where the earthquake will not cause casualties and property damage resides at distances r that exceed rm; meanwhile, distances r that are less than rm belong to the impact area where the earthquake will cause casualties and property damage.
The reliability of this proposed theoretical model will be validated in section 5 and section 6.
4. Framework implementation
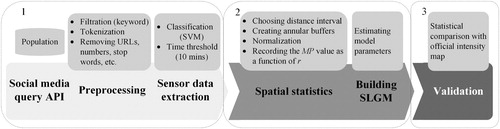
This section explains the framework for rapidly estimating the earthquake impact area via social media data based on our SLGM. schematically depicts our workflow, which is divided into three main components:
Data collection and processing: gathering social media data (keyword filtration) and population data, social media data preprocessing (tokenization, removing URLs, numbers, stop words, etc.), and sensor data extraction (text classification and time threshold filtering);
Building the SLGM for the social media data: determining the spatial statistics (choosing the model distance interval, creating the annular buffers, data normalization, recording the MP value as a function of r), and building the SLGM (estimating the model parameters by a maximum likelihood estimation (MLE) method);
Validating the estimated impact area: mapping the earthquake impact area based on the parameter rm and validating the detection result by using an official intensity map.
Figure 4. Impact area estimation workflow.
4.1. Data collection and processing
4.1.1. Social media data and population data
The social media data we employed in this study are derived from two services: Twitter and Sina-Weibo (a Twitter-like microblogging site widely used in China). The geo-tweets can be collected via the Twitter search application program interface (API) within a given radius of a given latitude/longitude. The georeferenced Weibo messages can be collected by the ‘nearby_timeline’ interface on the Sina-Weibo API. We transformed the collected messages into a geo-tweet-type internal data structure that contains only a user identification, a time-stamp, a geo-location, and a text message. It is worth mentioning that social media data with exact latitude and longitude coordinates are posted by the individuals using a mobile device application opt-in to geolocate their message. These social media data with exact coordinates do not include the reposted messages.
The population distribution data we used was provided by the LandScan Global Population Database (http://web.ornl.gov/sci/landscan/). LandScan represents the ambient population at a 1∗1 km grid resolution, which is the finest available resolution of global population distribution data (Bright, Rose, and Urban Citation2013).
4.1.2. Social media data preprocessing
Social media data containing the keywords ‘earthquake’ (地震) will be retained. However, this keyword selection method does not necessarily guarantee that all messages collected are actually relevant to a target event. Some users might send messages such as ‘Earthquake drill dawn’ or ‘Earthquake Conference’. This would influence the precision of the emergency information extraction; therefore, these messages have to be filtered out, and a semantic analysis of the text is needed.
Before the actual semantic text analysis of the social media data, the original social media texts need to be preprocessed to reduce statistical noise. The tweets and Weibo text should be split into individual words, and URLs, numbers and stop words (commonly used words that do not carry a distinct semantical meaning) should be removed before performing the actual semantic analysis. We removed stop words using a standard predefined list provided by the Natural Language Toolkit (NLTK; http://www.nltk.org/).
4.1.3. Earthquake-related social media sensor data extraction
To extract earthquake-related messages from our dataset, we built a text classifier model. An SVM was used as the machine-learning algorithm to build the classifier (Suykens and Vandewalle Citation1999). We trained our classifier with a free and reliably labeled dataset (http://socialsensing.eu/datasets) and used the classifier to predict our collected social media data. This free dataset contains tweets about two earthquakes (the L’Aquila earthquake and the Emilia earthquake), and it is manually annotated in the following way: (i) messages related to the disaster carrying damage information (damage class); (ii) messages without damage information but are relevant to the disaster (no damage class); and (iii) messages that are not relevant (not relevant class) (Cresci, Tesconi, et al. Citation2015). Our classifier aims to distinguish between relevant messages and nonrelevant messages. Therefore, we merged the first and second classes of the annotated dataset into a relevant class. Consequently, the relevant and nonrelevant free datasets became the learning corpus to train the text classifier model, and the trained model was used to classify our tweets and Weibo messages by assigning each of them a given class: relevant or not relevant.
Moreover, even if a social media message is related to the target earthquake, it might not be appropriate as an event sensor report. Unlike real sensor data, social media data originating from unaffected areas are responses to media coverage of the event rather than reports of the disaster itself (Sakaki, Okazaki, and Matsuo Citation2010; Crooks et al. Citation2013; Ryoo and Moon Citation2014). Such responses had a negative effect on the attempts to extract sensor data in our analysis. Crooks et al. (Citation2013) defined a signal-to-noise ratio (SNRT) for filtering social media sensor observations; they found that messages within 10 min following an earthquake had a higher SNRT. Therefore, we chose the relevant messages that occurred in the 10 min after an earthquake as the social media sensor data for our study. The time sensitivity of our method will be further discussed in section 6.
4.2. Building the SLGM for social media data
The component is composed of two parts made up of spatial statistics determination and model parameters estimation. The first part (i.e. the spatial statistics determination) consists of choosing the distance interval (based on the 1-km population resolution, we chose 1 km as the distance interval in our model; that is, ri+1 ‐ ri = 1 km). Then, the number of social media messages and the populations at different distances in the annular buffer from the earthquake epicenter with the distance interval are counted. Subsequently, the amount of normalized sensor data in each annular buffer area is calculated, and thus, we can record the MP value as a function of r.
The second part consists of estimating the model parameters. The MLE method is used to estimate the parameters of our SLGM. The MLE technique first proceeds to maximize a likelihood function, which in turn maximizes the agreement between the model and the data. This method intuitively selects the parameter values that maximize the probability of the data. After computing the maximum likelihood estimate of the unknown parameter rm, we mapped the estimated earthquake impact area.
4.3. Validating the estimated impact area
For validation purposes, the impact area detected by our model was compared with the official ShakeMap published by the USGS, which can be obtained from their website (http://earthquake.usgs.gov/shakemap). ShakeMap provides a map of the shaking intensity following significant earthquakes using the modified Mercalli intensity (MMI) scale to evaluate the effects of earthquakes. The MMI scale is composed of 12 levels of intensity on a scale from I (not felt) to XII (total destruction), and it is based on observable earthquake damage.
Of the 12 levels on the MMI scale, grade V represents the critical level. Walls will buckle and rupture in an area where the intensity is below grade V, but generally, the earthquake will not cause casualties and property damage. In contrast, in an area where the intensity is grade V or higher, the amount of damage increases considerably; some injuries will occur, dishes and windows will be broken, pendulum clocks may stop, and heavy furniture might begin to move (Wood and Neumann Citation1931). As our model detects the impact area where the earthquake will cause casualties and damage, we compare our detection result with the region whose intensity grade is greater than or equal to V in the ShakeMap. The following indexes are computed for the accuracy evaluation:
X, the ratio of the correctly detected area among the detected result:
Y, the ratio of the correctly detected area based on the ShakeMap, where the earthquake intensity ≥ V:
Z-measure, the degree of agreement between the detected result and the ShakeMap:The more accurate the detection result, the closer the Z-measure value is to unity.
In this manner, our approach seeks to quickly estimate the impact area following a large earthquake to enhance situational awareness and shorten response times. This approach is applied to two large earthquake cases, as described in the next section.
5. Experimental results
To validate our approach, we applied the SLGM to estimate the impact areas of two large earthquakes: the 2015 Nepal earthquake and the 2017 Jiuzhaigou earthquake. The 2015 Nepal earthquake occurred with a magnitude of 8.1 at 11:56:25 local time on 25 April 2015, and it was the largest earthquake to strike Nepal since 1944. The 2017 Jiuzhaigou earthquake struck with a magnitude of 7.0 at 21:19:46 local time on 8 August 2017 in Jiuzhaigou County, China. The dominant social media platforms in these two regions are Twitter and Sina-Weibo (https://weibo.com, the most popular microblogging service in China). Using these two earthquake cases, we show the applicability of our approach.
5.1. Data
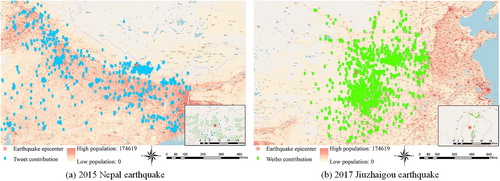
We collected 264763 geotagged tweets posted in a radius of 1609 kilometers (1000 miles) centered on the Nepal earthquake epicenter (84.731°E, 28.230°N) from 11:56 on 25 April 2015 to 23:59 on 28 April 2015; among those tweets, 8988 included the keyword ‘earthquake’. For the Jiuzhaigou earthquake, we collected 19779 geotagged Weibo messages posted in a radius of 1000 kilometers centered on the Jiuzhaigou earthquake epicenter (103.855°E, 33.193°N) from 21:19 on 8 August 2017 to 23: 59 on 8 August 2017; 5852 messages contained the keyword ‘地震’(earthquake). In a, we show the study area and the distributions of the tweets and population for the Nepal earthquake. Few tweets were collected to the north of Nepal, as Twitter is blocked in China. b provides an overview of the study area for the Jiuzhaigou earthquake with the locations of geolocated Weibo messages and the population distribution.
Figure 5. Overview of the study areas and data distributions.
shows the performance of our text classifier. The free dataset containing both earthquakes (the L’Aquila earthquake and the Emilia earthquake) used in this study was split into groups: 80% was used for training, and 20% was used for testing. The classifier accurately detected relevant messages (the F-scores reached 0.902 and 0.908 for the free test dataset). We used this trained model to classify our preprocessed tweets and Weibo messages. As shown in , each social media message for the two earthquakes was assigned to a given class: relevant or not relevant. We chose the relevant messages that occurred within 10 min after the target earthquakes as the social media sensor data for our study.
Table 2. Classification experiments performed using the free dataset as a training set. (Accuracy: a global score referring to the percentage of data correctly classified. Precision: the ratio of the number of correctly classified data over the total number of data classified as belonging to a particular class. Recall: the ratio of the number of correctly classified tweets over the total number of tweets belonging to a particular class in the test sets. F-score: the harmonic mean of precision and recall).
Table 3. Results of the classification of our tweets and Weibo messages.
5.2. Detection results
We chose 1 km as the distance interval, recorded the MP value as a function of r, and built the SLGM separately for these two earthquakes. To measure the goodness-of-fit of the SLGM, we used the R-squared value, which takes a value between zero and one. The closer the data points lie to the curve of our model, the closer the R-squared value is to one. The modeling results were as follows.
5.2.1. 2015 Nepal earthquake
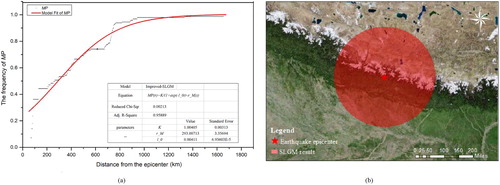
a shows the logistic spatial growth curve between MP and r. To facilitate the calculation, we calculated the percentages of MP rather than the actual values. As shown in a, the R-squared value reached 0.959, which means that our model fits the social media data for this earthquake, while the MLE method yielded a value of rm = 293 km. We show the impact area detected by the SLGM in b.
Figure 6. Earthquake impact area assessment for the 2015 Nepal earthquake as derived from the SLGM analysis: (a) the model fitting result; (b) the estimated impact area.
5.2.2. 2017 Jiuzhaigou earthquake
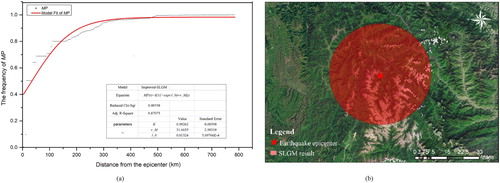
A similar experiment was performed for the Jiuzhaigou earthquake. a displays the MP versus r curve for the logistic spatial growth model. The SLGM also shows a good performance (0.871) in fitting the MP-r relationship of this earthquake, while rm was estimated to be 32 km. The detection result of this earthquake is depicted in b.
Figure 7. Earthquake impact area assessment for the 2017 Jiuzhaigou earthquake as derived from the SLGM analysis: (a) the model fitting result; (b) the estimated impact area.
To demonstrate the practicality of our approach, the areas estimated by our model are compared with the official intensity maps in the next section.
5.3. Verification of results
In and , we project the detected areas on top of the USGS ShakeMaps for both earthquakes; the red circles represent the boundaries of the detected areas based on the SLGM.
Figure 8. Comparison of the official intensity map produced by the USGS with the detection result of the impact area derived from the SLGM analysis for the 2015 Nepal earthquake.
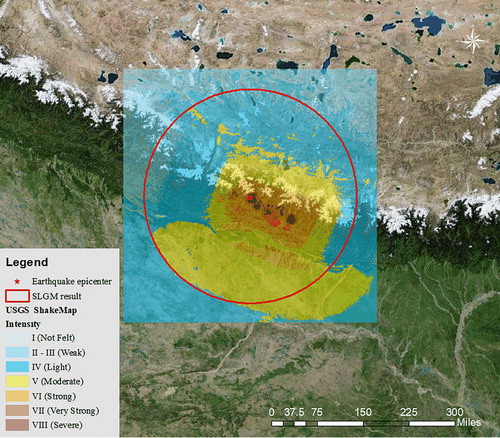
Figure 9. Comparison of the official intensity map produced by the USGS with the detection result of the impact area derived from the SLGM analysis for the Jiuzhaigou earthquake.
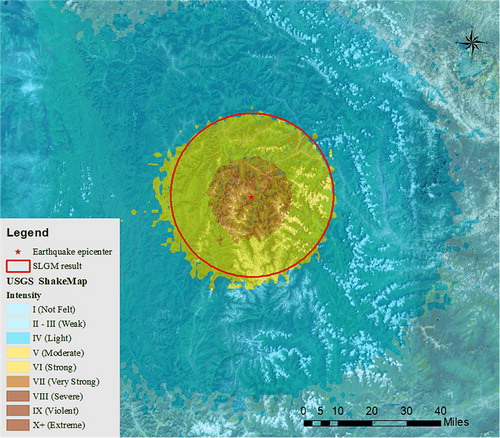
As shown in , for the Nepal earthquake, the region whose earthquake intensity is greater than or equal to V in the ShakeMap corresponds well to the area detected by the SLGM (with a radius of 293 km). More specifically, 52.37% of the detected area corresponds to the area where the earthquake intensity grade ≥ V in the ShakeMap (X = 52.37%), while 91.11% of the ShakeMap (where the earthquake intensity grade ≥ V) corresponds to the detected area (Y = 91.11%); the Z-measure was 71.74%. For the Jiuzhaigou earthquake, as shown in , we can observe that the model is also efficient in estimating the impact area (with a radius of 32 km), as demonstrated by the encouraging values (X = 98.81%, Y = 87.36%, Z-measure = 93.11%), similar to . These evaluation results show that our proposed SLGM effectively and quantitatively expresses the spatial growth process of social media citizen sensor data after an earthquake and that it can rapidly estimate the impact area with a reasonable accuracy.
The results show that we produced a more accurate estimate in the impact area of the Jiuzhaigou earthquake (93.11%) than in that of the Nepal earthquake (71.74%). Since the China firewall blocks Twitter, there were few tweets from the region to the north of Nepal. This might have affected the accuracy of the detected results for the Nepal earthquake. Moreover, the population around Jiuzhaigou is slightly more evenly distributed, and people in this study area use Sina-Weibo without limits. Thus, our result is reasonable: the more uniform the distribution of sensors is, the more precise the estimation.
6. Discussion
6.1. Evaluation of the SLGM time sensitivity to social media data
To test the time sensitivity of our proposed method, we also built the SLGM for the social media disaster-related data posted at different times after the target earthquakes. Comparisons of the fitting accuracies and their effects on the impact area detection results between different time periods are summarized in .
Table 4. The effect of time threshold filters on the impact area detection result produced by the SLGM.
The detection accuracies both steadily increase in the first few minutes of the two earthquakes (for the Nepal earthquake, R2 = 0.422 to 0.959, Z-measure = 50.49% to 71.74%; for the Jiuzhaigou earthquake, R2 = 0.919 to 0.976, Z-measure = 51.95% to 93.41%). After the first 10 min, the detection accuracies of the two events both fluctuate around a moderate level. However, in the following 12–20 min, the accuracies decrease rapidly, and our model is no longer suitable for detecting the impact areas for the two earthquake events. That is, despite having the highest total count of messages, the data posted in the first 20 min after the earthquakes are unsuitable for estimating the impact areas.
The model accuracy first increases a few minutes after the earthquake and then decreases. Arguably, this trend could be explained by the distribution of social media data, which is fueled not only by the impact of the earthquake but also by the widespread coverage of the earthquake on social media. Earthquake-related data posted a few minutes after an earthquake can be regarded as sensor values. As the amount of sensor data increases, the detected information becomes more reliable. After a certain period, user-posted data might represent not only the reaction to the earthquake but also the responses to the keyword ‘earthquake’, which cannot be regarded as sensor readings. This will result in a reduced credibility of the detected results. In the period we studied, the Z-measure values of the two earthquakes in the first 10 minutes were higher than those in the other periods.
6.2. Model external validity and limitations analysis
To determine the external validity and limitations of the SLGM, we tested it with other large earthquake events. We analyzed major U.S. earthquakes that occurred during 2000–2017 with magnitudes greater than 5 and depths of less than 60 km (the characteristics of destructive earthquakes), as declared by the USGS. Due to the lack of social media data for these historical events, another type of online citizen-sensor data was used in this paper. These data were collected from the dedicated crowdsourcing ‘Did You Feel It?’ (DYFI) program tapped by the USGS (http://earthquake.usgs.gov/dyfi/), where citizens use the Internet website to report their observations of any earthquakes (regardless of whether they felt them) with geolocation information. The number of DYFI citizen-sensors for these events followed a long-tailed distribution. We analyzed only the events where the number of citizen-sensor data points was greater than the average number of 8512. In total, 18 separate earthquake events were noted. We followed the same method as described above to estimate the impact areas from the DYFI data. shows the SLGM detection results for these 18 events
Table 5. SLGM detection results for additional earthquake events. (Event ID: each reported earthquake event is given a unique ID by the USGS).
All of the events exhibited strong logistic spatial growth processes in the citizen-sensor data; high R2 values were obtained for our SLGM fitting results (as shown in ). We found that for the events whose Z-measures were less than 0.6 (events ci14745580, ci14383980, and ci15481673), their epicenters were all around the West Coast of the United States. These resulted in lower sensor values around the epicenters; thus, our model results were not significant. For all earthquake events whose epicenters were far away from the ocean (events uw10530748, ld2002042000, nm606657, se609212, usp000jadn, and us10009757), their Z-measure values all reached 0.7. This shows that one may expect even more accruable results with a relatively uniform distribution of sensor values around the earthquake epicenter.
In general, our SLGM is reliable, especially for earthquake cases where the earthquake epicenter is located on a continental landmass and has a relatively uniform distribution of sensor values around it. Since the messages that people post on social media a few minutes after an earthquake can be regarded as sensor observations, social media data based on our model can enable a rapid assessment of the earthquake impact area (e.g. the DYFI online citizen-sensor data acquisition took several hours or even days.).
6.3. Social media data word cloud analysis
In addition to analyzing the SLGM time sensitivity to social media data and its limitations, we performed an additional social media text analysis to explore more useful information based on our detected results for the Nepal earthquake and Jiuzhaigou earthquake. We analyzed the contents of all collected messages and the messages in the corresponding detection areas. The word cloud shown in visualizes the frequency of individual words in our data corpus, where larger words are mentioned more frequently. In a, we show the word cloud for the Nepal earthquake; the left image was created with 264763 Twitter messages posted in a radius of 1609 km (1000 miles) centered on the epicenter, and the right image was created with 10249 tweets posted in the detected impact area (293 km). b shows the equivalent word cloud for the Jiuzhaigou earthquake; the left image was created with 19779 Weibo messages posted in a radius of 1000 km centered on the epicenter, and the right image was created with 245 Weibo messages posted in the detected impact area (32 km). It is easy to see that the social media data in the detected area are more relevant to the disaster.
Figure 10. Word cloud of the most frequent terms during the two earthquakes.
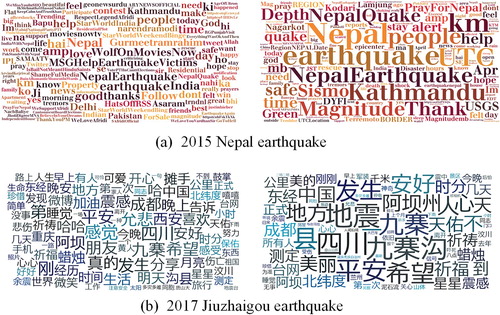
Thus, our model can not only quickly estimate the impact area after a large earthquake but also provide a reference for future work with a text-based or an image-based analysis of social media data. One could obtain a higher probability of identifying useful information in the detected impact area. Messages can be weighted based on the detected range prior to data processing. Hence, the efficiency of social media data analysis can be improved, and we can perform a more precise, quantitative assessment of the social media messages posted in the detected area.
7. Conclusions
Social media data that carry geographic references are easy to obtain, and they might represent real-time citizen-sensor data for a disaster; consequently, they could be used to enhance situational awareness. In this article, we present an approach that quickly estimates the impact area following a large earthquake via social media. Specifically, we apply a time-based theory to spatial analysis. We construct an analogy between changes in the biological population size over time and changes in citizen-sensor data size over distance, thereby proposing a novel model (i.e. the SLGM) to describe the spatial growth of citizen-sensor data after an earthquake. Then, we develop a framework to quickly estimate the earthquake impact area via social media based on the proposed SLGM. In this approach, we reveal the connection between the citizen-sensor data spatial growth trend and the earthquake impact area and apply this connection to model the social media citizen-sensor data, thereby estimating the impact area through spatial statistical analysis.
To demonstrate how our approach leverages citizen-sensor data from social media to quickly locate earthquake impact areas, we used representative case studies, namely, the 2015 Nepal earthquake and the 2017 Jiuzhaigou earthquake. The reliability and restriction of our SLGM was further discussed across 18 other earthquake events. The experimental results illustrate that the SLGM can effectively express the spatial growth of citizen-sensor data following a large earthquake, and the proposed model is suitable for producing a quick estimation of the earthquake impact area via social media. This approach allows us to quickly extract valuable earthquake emergency information following a large earthquake without requiring prior knowledge or feasible cases.
The citizen-sensor observations (derived from social media) in our cases were obtained after keyword-based filtering. However, it is possible that some messages were relevant to the earthquake but did not include the selected keyword and were thus not collected. This is a limitation of our study that results from using a keyword selection strategy to collect social media data. Additional key words, such as ‘shaking’ and ‘disaster’, will be included in our future work. Moreover, we used an external dataset as a training set to train the classification model for the classification of our messages, and we did not perform a manual verification of the resulting dataset to identify any misclassified relevant messages. This is an avenue for future research.
Additionally, we illustrated that the results obtained from social media were nevertheless useful for detecting the earthquake impact areas for the Nepal and Jiuzhaigou earthquakes. In future work, additional earthquake events will be included to further verify the effectiveness of our method. In addition, we will explore how different earthquake characteristics can influence the credibility and generalizability of the results obtained from social media data based on the SLGM.
Moreover, social media sensors are different from real sensors, and their distribution will be affected by demographic, economic, and community disparities among many other factors. Hence, further studies are needed to explore the possibility of incorporating more factors into our model to make it more reasonable and thus provide even more meaningful information to better support disaster management endeavors.
Acknowledgements
This product was made utilizing the LandScan 2012™ High Resolution global Population Data Set copyrighted by UT-Battelle, LLC, operator of Oak Ridge National Laboratory under Contract No. DE-AC05-00OR22725 with the United States Department of Energy. The United States Government has certain rights in this Data Set. Neither UT-BATTELLE, LLC NOR THE UNITED STATES DEPARTMENT OF ENERGY, NOR ANY OF THEIR EMPLOYEES, MAKES ANY WARRANTY, EXPRESS OR IMPLIED, OR ASSUMES ANY LEGAL LIABILITY OR RESPONSIBILITY FOR THE ACCURACY, COMPLETENESS, OR USEFULNESS OF THE DATA SET.
Disclosure statement
No potential conflict of interest was reported by the authors.
Additional information
Funding
References
- Amit, Sheth, Purohit Hemant, Smith Gary Alan, Brunn Jeremy, Jadhav Ashutosh, Kapanipathi Pavan, Lu Chen, and Wang Wenbo. 2014. “Twitris: A System for Collective Social Intelligence.” In Encyclopedia of Social Network Analysis and Mining, edited by Alhajj Reda, and Rokne Jon, 2240–2253. New York: Springer-Verlag New York.
- Atkinson, Gail M., and David J. Wald. 2007. ““Did You Feel It?” Intensity Data: A Surprisingly Good Measure of Earthquake Ground Motion.” Seismological Research Letters 78 (3): 362–368. doi:10.1785/gssrl.78.3.362.
- Badal, José, Miguel Vázquez-prada, and Álvaro González. 2005. “Preliminary Quantitative Assessment of Earthquake Casualties and Damages.” Natural Hazards 34 (3): 353–374. doi:10.1007/s11069-004-3656-6.
- Baranyi, József, and Carmen Pin. 2001. “A Parallel Study on Bacterial Growth and Inactivation.” Journal of Theoretical Biology 210 (3): 327–336. doi:10.1006/jtbi.2001.2312.
- Bhowmick, Amiya Ranjan, and Sabyasachi Bhattacharya. 2014. “A new Growth Curve Model for Biological Growth: Some Inferential Studies on the Growth of Cirrhinus Mrigala.” Mathematical Biosciences 254: 28–41. doi:10.1016/j.mbs.2014.06.004.
- Bright, Eddie A., Amy N. Rose, and Marie L. Urban. 2013. “LandScan 2012.” In. Oak Ridge, TN: Oak Ridge National Laboratory. http://www.ornl.gov/landscan/.
- Burks, L., M. Miller, and R. Zadeh. 2014. “Rapid Estimate of Ground Shaking Intensity by Combining Simple Earthquake Characteristics with Tweets.” Paper presented at the 10th US Nat. conf. earthquake Eng., front. earthquake Eng., Anchorage, AK, USA, Jul. 21Y25.
- Carlos, Castillo, Mendoza Marcelo, and Poblete Barbara. 2013. “Predicting Information Credibility in Time-Sensitive Social Media.” Internet Research: Electronic Networking Applications and Policy 23 (5): 560–588. doi:10.1108/IntR-05-2012-0095.
- Cresci, Stefano, Andrea Cimino, Felice Dell’Orletta, and Maurizio Tesconi. 2015. “Crisis Mapping During Natural Disasters via Text Analysis of Social Media Messages.” In Web Information Systems Engineering – WISE 2015: 16th International Conference, Miami, FL, USA, November 1-3, 2015, Proceedings, Part II, edited by Jianyong Wang, Wojciech Cellary, Dingding Wang, Hua Wang, Shu-Ching Chen, Tao Li and Yanchun Zhang, 250–258. Cham: Springer International Publishing. doi:10.1007/978-3-319-26187-4_21.
- Cresci, Stefano, Maurizio Tesconi, Andrea Cimino, and Felice Dell’Orletta. 2015. “A Linguistically-driven Approach to Cross-Event Damage Assessment of Natural Disasters From Social Media Messages.” In Proceedings of the 24th International Conference on World Wide Web, ACM, New York, NY, USA, 1195–1200. Florence: ACM. doi:10.1145/2740908.2741722.
- Crooks, Andrew, Arie Croitoru, Anthony Stefanidis, and Jacek Radzikowski. 2013. “#Earthquake: Twitter as a Distributed Sensor System.” Transactions in GIS 17 (1): 124–147. doi:10.1111/j.1467-9671.2012.01359.x.
- Dawed, Mohammed Yiha, Purnachandra Rao Koya, and Ayele Taye Goshu. 2014. “Mathematical Modelling of Population Growth: The Case of Logistic and Von Bertalanffy Models.” Open Journal of Modelling and Simulation 2 (04): 113–126. doi:10.4236/ojmsi.2014.24013.
- Earle, Paul S., Daniel C. Bowden, and Michelle R. Guy. 2011. “Twitter Earthquake Detection: Earthquake Monitoring in a Social World.” Annals of Geophysics 54 (6): 708–715. doi:10.4401/ag-5364.
- Earle, Paul, Michelle Guy, Richard Buckmaster, Chris Ostrum, Scott Horvath, and Amy Vaughan. 2010. “OMG Earthquake! Can Twitter Improve Earthquake Response?” Seismological Research Letters 81 (2): 246–251. doi:10.1785/gssrl.81.2.246.
- Enrico, Steiger, Albuquerque João Porto, and Zipf Alexander. 2015. “An Advanced Systematic Literature Review on Spatiotemporal Analyses of Twitter Data.” Transactions in GIS 19 (6): 809–834. doi:10.1111/tgis.12132.
- Fontugne, Romain, Kenjiro Cho, Youngjoon Won, and Kensuke Fukuda. 2011. “Disasters Seen Through Flickr Cameras.” In Proceedings of the Special Workshop on Internet and Disasters, ACM, New York, NY, USA, 1–10. Tokyo: ACM. doi:10.1145/2079360.2079365.
- Goodchild, Michael F. 2007. “Citizens as Sensors: the World of Volunteered Geography.” GeoJournal 69 (4): 211–221. doi:10.1007/s10708-007-9111-y.
- Goodchild, Michael F., and J. Alan Glennon. 2010. “Crowdsourcing Geographic Information for Disaster Response: A Research Frontier.” International Journal of Digital Earth 3 (3): 231–241. doi:10.1080/17538941003759255.
- Goolsby, Rebecca. 2010. “Social Media as Crisis Platform: The Future of Community Maps/Crisis Maps.” ACM Transactions on Intelligent Systems and Technology 1 (1): 1–11. doi:10.1145/1858948.1858955.
- Guy, Michelle, Paul Earle, Chris Ostrum, Kenny Gruchalla, and Scott Horvath. 2010. “Integration and Dissemination of Citizen Reported and Seismically Derived Earthquake Information via Social Network Technologies.” International Conference on Advances in Intelligent Data Analysis 2010: 42–53. doi:10.1007/978-3-642-13062-5_6.
- Huang, Qunying, and Yu Xiao. 2015. “Geographic Situational Awareness: Mining Tweets for Disaster Preparedness, Emergency Response, Impact, and Recovery.” ISPRS International Journal of Geo-Information 4 (3): 1549–1568. doi:10.3390/ijgi4031549.
- Judith, Gelernter, and Mushegian Nikolai. 2011. “Geo-Parsing Messages From Microtext.” Transactions in GIS 15 (6): 753–773. doi:10.1111/j.1467-9671.2011.01294.x.
- Kim, Kyoung-Sook, Ryong Lee, and Koji Zettsu. 2011. “mTrend:Discovery of Topic Movements on geo-Microblogging Messages.” ACM Sigspatial International Conference on Advances in Geographic Information Systems 2011: 529–532. doi:10.1145/2093973.2094066.
- Kropivnitskaya, Yelena, Kristy F. Tiampo, Jinhui Qin, and Michael A. Bauer. 2017. “The Predictive Relationship Between Earthquake Intensity and Tweets Rate for Real-Time Ground-Motion Estimation.” Seismological Research Letters 88 (3): 840–850. doi:10.1785/0220160215.
- Kryvasheyeu, Yury, Haohui Chen, Nick Obradovich, Esteban Moro, Pascal Van Hentenryck, James Fowler, and Manuel Cebrian. 2016. “Rapid Assessment of Disaster Damage Using Social Media Activity.” Science Advances 2 (3), doi:10.1126/sciadv.1500779.
- Li, Zhenlong, Cuizhen Wang, Christopher T. Emrich, and Diansheng Guo. 2018. “A Novel Approach to Leveraging Social Media for Rapid Flood Mapping: a Case Study of the 2015 South Carolina Floods.” Cartography and Geographic Information Science 45 (2): 97–110. doi:10.1080/15230406.2016.1271356.
- Mizunuma, Yuhiro, Shuhei Yamamoto, Yutaro Yamaguchi, Atsushi Ikeuchi, Tetsuji Satoh, and Satoshi Shimada. 2014. “Twitter bursts: Analysis of their occurrences and classifications.” Paper presented at the ICDS. http://www.thinkmind.org/download.php?articleid=icds_2014_7_40_10139.
- Murakami, Akiko, and Tetsuya Nasukawa. 2012. “Tweeting About the Tsunami?: Mining Twitter for Information on the Tohoku Earthquake and Tsunami.” International World Wide Web Conferences 2012: 709–710. doi:10.1145/2187980.2188187.
- Nagarajan, Meenakshi, Karthik Gomadam, Amit P. Sheth, Ajith Ranabahu, Raghava Mutharaju, and Ashutosh Jadhav. 2009. “Spatio-Temporal-Thematic Analysis of Citizen Sensor Data: Challenges and Experiences.” Lecture Notes in Computer Science 5802: 539–553. doi:10.1007/978-3-642-04409-0_52.
- Panagiota, Matsuka, Chanussot Jocelyn, and Pathier Erwan. 2011. “State of the art on remote sensing for vulnerability and damage assessment on urban context.” URBASIS Consort: Grenoble, France.
- Re, Giuseppe Del. 2000. “Models and Analogies in Science.” Hyle International Journal for Philosophy of Chemistry 6 (1): 5–15. http://www.hyle.org/journal/issues/6/delre.pdf.
- Resch, Bernd, Florian Usländer, and Clemens Havas. 2018. “Combining Machine-Learning Topic Models and Spatiotemporal Analysis of Social Media Data for Disaster Footprint and Damage Assessment.” Cartography and Geographic Information Science 45 (4): 362–376. doi:10.1080/15230406.2017.1356242.
- Robinson, Bella, Robert Power, and Mark Cameron. 2013. “A Sensitive Twitter Earthquake Detector.” In Proceedings of the 22nd International Conference on World Wide Web, ACM, New York, NY, USA, 999–1002. Rio de Janeiro: ACM. doi:10.1145/2487788.2488101.
- Ryoo, KyoungMin, and Sue Moon. 2014. “Inferring Twitter User Locations with 10 km Accuracy.” In Proceedings of the 23rd International Conference on World Wide Web, ACM, New York, NY, USA, 643–648. Seoul: ACM. doi:10.1145/2567948.2579236.
- Sakaki, Takeshi, Makoto Okazaki, and Yutaka Matsuo. 2010. “Earthquake Shakes Twitter Users: Real-Time Event Detection by Social Sensors.” In Proceedings of the 19th International Conference on World Wide Web, ACM, New York, NY, USA, 851–860. Raleigh, NC: ACM. doi:10.1145/1772690.1772777.
- Sakaki, T., M. Okazaki, and Y. Matsuo. 2013. “Tweet Analysis for Real-Time Event Detection and Earthquake Reporting System Development.” IEEE Transactions on Knowledge and Data Engineering 25 (4): 919–931. doi:10.1109/TKDE.2012.29.
- Sakaki, Takeshi, Fujio Toriumi, and Yutaka Matsuo. 2011. “Tweet Trend Analysis in an Emergency Situation.” In Proceedings of the Special Workshop on Internet and Disasters, ACM, New York, NY, USA, 1–8. Tokyo: ACM. doi:10.1145/2079360.2079363.
- Sheth, Amit. 2009. “Citizen Sensing, Social Signals, and Enriching Human Experience.” IEEE Internet Computing 13 (4): 87–92. doi:10.1109/mic.2009.77.
- Steiger, Enrico, Rene Westerholt, and Alexander Zipf. 2016. “Research on Social Media Feeds – A GIScience Perspective.” In European Handbook of Crowdsourced Geographic Information, edited by C. Capineri, M. Haklay, H. Huang, V. Antoniou, J. Kettunen, F. Ostermann, and R. Purves, 237–254. London: Ubiquity Press.
- Suykens, J. A. K., and J. Vandewalle. 1999. “Least Squares Support Vector Machine Classifiers.” Neural Processing Letters 9 (3): 293–300. doi:10.1023/a:1018628609742.
- Symonds, Matthew R. E., and Adnan Moussalli. 2011. “A Brief Guide to Model Selection, Multimodel Inference and Model Averaging in Behavioural Ecology Using Akaike’s Information Criterion.” Behavioral Ecology and Sociobiology 65 (1): 13–21. doi:10.1007/s00265-010-1037-6.
- Tourres, Marie-Aimee. 2003. “Technological Revolutions and Financial Capital: The Dynamics of Bubbles and Golden Ages.” Journal of Economic Issues 37 (3): 833–835. doi:10.1080/00213624.2003.11506628.
- Tsoularis, A., and J. Wallace. 2002. “Analysis of Logistic Growth Models.” Mathematical Biosciences 179 (1): 21–55. doi:10.1016/S0025-5564(02)00096-2.
- Wang, Yuan Zhi, Jia Jie Sun, Lian Xing Liu, and Fei Sheng. 2007. “Thinking About Introducing Space Sequence Concept.” [In Chinese.] Journal of Shenyang Institute of Engineering 3 (2): 179–180. doi:10.13888/j.cnki.jsie(ns).2007.02.026.
- Wood, H. O., and F., Neumann. 1931. “Modified Mercalli Intensity Scale of 1931.” Bulletin of the Seismological Society of America 21 (4): 277–283. http://www.bssaonline.org/content/21/4/277.accessible-long.
- Xu, Chong, Xiwei Xu, Fuchu Dai, Zhide Wu, Honglin He, Feng Shi, Xiyan Wu, and Suning Xu. 2013. “Application of an Incomplete Landslide Inventory, Logistic Regression Model and its Validation for Landslide Susceptibility Mapping Related to the May 12, 2008 Wenchuan Earthquake of China.” Natural Hazards 68 (2): 883–900. doi:10.1007/s11069-013-0661-7.
- Xu, Zhiheng, Yang Zhang, Yao Wu, and Qing Yang. 2012. “Modeling User Posting Behavior on Social Media.” In Proceedings of the 35th International ACM SIGIR Conference on Research and Development in Information Retrieval, ACM, New York, NY, USA, 545–554. Portland, OR: ACM. doi:10.1145/2348283.2348358.
- Yang, Tian Qing, X. I. Nan, Yi Zhang, and L. I. Jie-Fei. 2016. “Fast Determination Method of Seismic Intensity Distribution Based on Discrete Disaster Information.” [In Chinese.] Earthquake 36 (2): 48–59. doi:10.3969/j.issn.1000-3274.2016.02.005.
- Zhu, J., F. Xiong, D. Piao, Y. Liu, and Y. Zhang. 2011. “Statistically Modeling the Effectiveness of Disaster Information in Social Media.” Paper presented at the 2011 IEEE global humanitarian technology conference, Oct. 30 2011–Nov. 1 2011.