
ABSTRACT
Virtual reality (VR) is a frequently emphasized issue on the Digital Earth (DE) agenda. While current DE research is more engaged in the technical aspects of VR applications, this paper focuses on what is possible with immersive virtual environments (IVE) from the user's perspective. After a brief discussion of spatial presence and embodiment in the context of IVE, both concepts will be merged into a geovisualization immersion pipeline (GIP) as a framework with which to systematically link technical and cognitive aspects of IVE. We will then analyze the general criteria that must be met by IVE in order to facilitate the experience of spatial presence. Adapting these criteria to the special requirements of geospatial data, a definition of geovisualization immersive virtual environments (GeoIVE) is formulated. Finally, the theoretical considerations of this paper are set into practice, using a GeoIVE of a coral reef ecosystem as an example. As we shall see, while GIS do not provide data models or data compatibility for direct visualization of GeoIVE on VR output devices, game engines can serve as middleware to fill this gap.
1. Introduction – putting immersion on the Digital Earth agenda
Communication has always been a main objective on the research agenda of the International Society for Digital Earth (ISDE), (Goodchild et al. Citation2012). Gore’s (Citation1998) initial ideas of a Digital Earth (DE), which are still defining for the ISDE, were set within a context of scientific communication where large amounts of data are converted into accessible information: In Gore's paradigmatic DE scenario, a child – interacting with a virtual globe – accesses vast amounts of geo-referenced information at different spatial and temporal scale levels in 3D space. In this sense, Craglia et al. (Citation2012) also stress the importance of improved communication of scientific knowledge for DE development.
Reviewing prominent position papers on the DE vision (Goodchild Citation2008; Goodchild et al. Citation2012; Craglia et al. Citation2012), one can see that Gore's idea is mainly understood from a traditional cartographic and GIScience perspective (see also Liu et al. Citation2017), where maps and imagery at different levels of scale and resolution are linked dynamically. In line with this interpretation, virtual globes (e.g. Google Earth) are considered to be today's closest approximation of a DE. However, as Goodchild et al. (Citation2012) noted, ‘virtual globes fall short of Gore's vision of a Digital Earth for several reasons’ (11090): One such shortcoming is the reduction of three-dimensionality on 2D computer displays. Moreover, current geobrowsers only allow for low and medium resolution 3D views of terrain and surface (especially in urban environments), while 3D representations of more complex ecosystems (e.g. mixed forests or coral reefs) remain unavailable.
We show in this paper that immersive virtual environments (IVE) can overcome these shortcomings and facilitate the communication of scientific findings not only by illustrating different realities to the users, but also by giving them the sense of being there. It is worth mentioning that Gore's (Citation1998) original vision, where a child explores a DE with a head-mounted display (HMD), taking her on a ‘magic carpet ride through a 3-D visualization of the terrain’ (89), is a particularly apt description of an IVE. However, despite this early hint, the number of publications addressing the potential of IVE for DE remains limited (Duan et al. Citation2015) and a thorough discussion of such potential, both for researchers and users of DE, has yet to be held. On the practical side, this lack of theoretic research is paralleled by very limited VR (and AR) capabilities of current GIS.
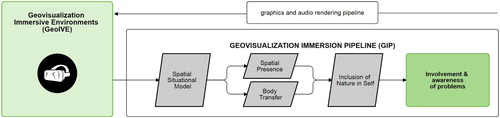
Against this background, we will develop a geovisualization immersion pipeline (GIP) as a framework with which to link technical and cognitive aspects of IVE in a systematic manner: After establishing a rough terminological setting in order to place the following arguments into a conceptually clear context, our discussion of IVE shall begin at the very end of the computer graphics pipeline, namely the point at which a 3D scene is rendered on screen (cf. ). As we will see, this step is essential for the immersive quality of a VR system. We will then continue the idea of a pipeline (i.e. a series of processing steps) on the user side via the GIP model, in order to describe how users can benefit from IVE in the field of geographic visualization. In addition, to frame the potential of the GIP for DE concerns in a terminological sense, the concept of geovisualization immersive environments (GeoIVE) will be proposed and typologically defined as a specific subcategory of IVE. Finally, a GeoIVE of a submarine ecosystem is described to complement the theoretical part of the paper.
Figure 1. Geovisualization Immersion Pipeline (GIP).
2. Immersive VR-systems
2.1. Virtual reality (VR)
The term virtual reality (VR) was coined in the 1980s, and soon entered the research agenda of cartographers (Taylor Citation1991). However, formulating a definition of VR in the context of geovisualization is still difficult, since substantial terminological ambiguity can be observed in the current literature: Concepts such as virtual landscapes (Minton Citation2014), virtual globes (Jones et al. Citation2014), VRGIS (Boulos et al. Citation2017) or Virtual Geographic Environments (VGE; Zhang et al. [Citation2016]) are used simultaneously, although different understandings of virtuality apply in each case. Moreover, there is often a lack of clear distinction made between virtuality, three-dimensionality (3D) and immersion. Some authors work on 3D-VR, while 3D-visualization is a self-evident precondition of VR for others. Likewise, some researchers investigate immersive virtual environments (IVE), while immersion is a prerequisite of virtuality for others. Finally, ambiguous conceptions of VR have also been documented by non-experts (Russell Citation1997). To avoid terminological confusion and ambiguity, the following discussion (based on early geovisualization research on immersive environments (MacEachren et al. Citation1999; MacEachren and Kraak Citation2001; Slocum et al. Citation2001)) will refer to geovisualization IVE (GeoIVE), which is defined below in further detail.
2.2. Immersion
Immersion is a description of a technology, and describes the extent to which the computer displays are capable of delivering an inclusive, extensive, surrounding and vivid illusion of reality to the senses of a human participant. Inclusive (I) indicates the extent to which physical reality is shut out. Extensive (E) indicates the range of sensory modalities accommodated. Surrounding (S) indicates the extent to which this virtual reality is panoramic rather than limited to a narrow field. Vivid (V) indicates the resolution, fidelity, and variety of energy simulated within a particular modality […]. (Slater and Wilbur Citation1997, 3)
The immersive quality of a VR system depends on a series of features, e.g. stereoscopic vision, image and object quality, field of view, update rate and tracking level (Cummings and Bailenson Citation2016). In order to integrate all of these features into highly immersive VR-systems, the following hardware components are needed (Schulze et al. Citation2011):
Graphics rendering units
3D stereo display
Tracking system
For example, in order to comply with the technical requirements of immersion-capable VR, we used (1) a Nvidia GeForce GTX 1080 graphics card together with (2) an Oculus Rift head-mounted display (HMD) equipped with a stereoscopic OLED display and a (3) 6 degrees of freedom (DoF) optical tracking system in the IVE presented in section 6.
3. From immersion to presence, from presence to embodiment – what's in IVE for the user?
3.1. Spatial presence
Once the components and features of immersive VR-systems are defined from a technological point of view, we can turn our focus to the possible benefits for IVE users. Current research on IVE is often based on the assumption that the objective of VR-applications is the creation of presence, generally understood as the sense of ‘being there’ (Cummings and Bailenson Citation2016). While the idea of presence can be traced to Gibson (Citation1979), different definitions have since been proposed (see Skarbez, Brooks, and Whitton (Citation2017) for a detailed analysis). Given that an exhaustive review of these concepts is beyond the scope of this paper, we will base our discussion on the following definition by Wirth et al. (Citation2007), which is in broad agreement with the Gibsonian understanding of presence.
Spatial Presence is a binary experience, during which perceived self-location and, in most cases, perceived action possibilities are connected to a mediated spatial environment, and mental capacities are bound by the mediated environment instead of reality. (Wirth et al. Citation2007, 497)
While the concept of spatial presence sounds promising for the Digital Earth research agenda, we must consider that the usage of IVE does not guarantee the experience of spatial presence and that spatial presence is not an exclusive property of IVE (Schubert and Crusius Citation2002).
3.2. Formation of spatial presence
Regarding the formation of spatial presence, a two-step process model of perceived (a) self-location and (b) possibilities of interaction was proposed by Wirth et al. (Citation2007): Within this theoretical framework, the user first constructs a mental model of the IVE, which allows answering the questions: ‘“is this stimulus a space/room?” and “if yes, what kind of space/room is it?”’ (ibid., 497). The quality of the IVE (e.g. spatial cues, attracting features) and user-specific factors (e.g. interest, involvement, spatial ability) both determine whether a mental model of the spatial environment, the so called spatial situation model (SSM), is being constructed as a result of step 1 (Hartmann et al. Citation2015).
The existence of a SSM is precondition for, but does not guarantee, spatial presence. Rather, to achieve the experience of being located in an IVE the user must, in a second step, accept the virtual environment as his primary reference space, answering the question ‘am I situated in this space?’ in the affirmative (Skarbez, Brooks, and Whitton Citation2017). Again, the media quality (e.g. persistence and consistence of the represented IVE, interactive features and properties on the user side, e.g. motivational factors) is a determinant factor for the transition to spatial presence (Coxon, Kelly, and Page Citation2016).
3.3. From spatial presence to embodiment
In many applications, geovisualization not only tries to provide users with the sense of spatial presence, but also to engage them with social and ecological concerns. However, communication of environmental issues is complicated by geographical, temporal and psychological distance: people tend to feel less responsibility for issues that are perceived as neither observable nor imminent (Trope, Liberman, and Wakslak Citation2007; DiMento and Doughman Citation2014).
Against this background, a Parallel Mediation Model was developed by Ahn et al. (Citation2016): In a series of user studies, these authors demonstrated that IVE lead to higher engagement when spatial presence is paralleled by embodiment, where the user navigates the IVE from the perspective of an avatar or animal (see Shapiro [Citation2014] for further readings on embodiment). As Ahn et al. show by asking probands to assume the perspective of a coral within the IVE of a reef, embodiment leads people to perceive ocean acidification as an imminent risk, hence increasing the involvement of IVE users with this environmental issue (Bailey, Bailenson, and Casasanto Citation2016).
With Schultz (Citation2001), we can understand this connectedness via body transfer between the user's self and the environment as inclusion of nature in self (INS): ‘The concept of INS adequately represents the virtual experience of inhabiting the body of an entity in nature, and feeling an interconnection with it […].’ (Ahn et al. Citation2016, 5). Empirical research indicates that increased INS triggers concern and involvement with environmental problems (Sevillano, Aragonés, and Schultz Citation2007). While the user's embodiment within the IVE facilitates both spatial presence and body transfer, the latter has an especially strong effect on the perception of INS, whereas the effect of spatial presence declines as a function of time.
4. Requirements of IVE for geovisualization concerns
4.1. The geovisualization immersion pipeline
In the previous sections, we approached the idea of IVE from both a technological and a user's point of view in order to provide a framework of understanding virtuality that not only implies computer-generated environments, but also the acceptance of these environments by the users as representations of reality and real-world problems. The concepts discussed above can be assembled into what we propose to call the geovisualization immersion pipeline ().
Basically, the geovisualization immersion pipeline (GIP) is a combination of the process model of spatial presence proposed by Wirth et al. (Citation2007) and the parallel mediation model presented by Ahn et al. (Citation2016), highlighting in addition the practice-oriented conception of geovisualization IVE applications. For geovisualization concerns, the pipeline showed in offers a (as yet rough) framework providing crosslinks to VR spatial cognition research (e.g. Dilworth’s [Citation2010] interactive theory of perception), which can facilitate evaluation and cause-analysis in case the IVE fails to involve the user.
4.2. Requirements of IVE
The GIP contains the steps necessary to situate an IVE user within a virtual ambience in a way that makes the user feel a (responsible) part of the environment represented. While we have already mentioned several factors, a more systematic listing of the VR parameters named in section 2.2 will provide a better understanding of the criteria a highly immersive virtual environment must meet in order to facilitate successful progress through the pipeline. We will begin from a meta-analysis on the effects of immersive features on spatial presence, published by Cummings and Bailenson (Citation2016) and based on more than 80 empirical investigations, which will be complemented accordingly for each of the features to be discussed (see also Bowman and McMahan [Citation2007]). Only features that have, on average, a high or medium impact on the generation of spatial presence will be considered.
4.2.1. DoF-rich positional tracking
Tracking allows the translation of real-world into virtual-world movement. Degrees of freedom (DoF) describe the parameters that can be transmitted. Six DoF tracking enables both translation and rotation along the x, y and z axes, thus meeting the criteria of freedom of movement. User studies show that DoF-rich positional tracking has a strong effect on the formation of spatial presence (Balakrishnan and Sundar Citation2011). Considering the importance of tracking for possible interaction between user and IVE, freedom of movement also favors INS (Skalski et al. Citation2011).
4.2.2. Update rate
Summarizing the experiments analyzed by Cummings and Bailenson (Citation2016), the rendering rates of virtual environments demonstrate a significant impact on the level of presence conveyed by VR applications. While these authors express their caution about the small sample sizes included in tests of this feature, the importance of high rendering rates is in line with the aforementioned spatial presence process model (Wirth et al. Citation2007), where the user constantly judges the appropriateness of the IVE as his or her primary reference frame. Continuous virtual representation (i.e. rendered at high update rates) facilitates this decision, thus supporting the experience of spatial presence. It is notable that all studies that have analyzed update rates date from the 1990s, when judder-free visualization was a major challenge compared to that possible with the high processing performance of current graphics rendering units (Barfield, Baird, and Bjorneseth Citation1998).
4.2.3. Field of view
Field of view is usually described by two angular values, comprising the (horizontal and vertical) segments of the environment a person can perceive at a given moment (without moving the eyes). In IVE these criteria are usually defined by the screen size and characteristics of the HMD used. Studies of this feature (Johnson and Stewart Citation1999; Bracken et al. Citation2010) indicate that wider fields of view facilitate the experience of spatial presence.
4.2.4. High vs. low immersive VR
Over recent years, a series of studies have directly compared IVE vs. low-immersive desktop applications, including a variety of the aforementioned features in different combinations. Evaluation of the overall results obtained from this type of experiment (e.g. Kim et al. Citation2014; Cummings and Bailenson Citation2016) has shown that VR applications with stereo display and a tracking system have a significantly higher impact on the generation of spatial presence. Moreover, Ahn et al. (Citation2016) demonstrated that the use of stereoscopic displays has a statistically significant effect on the occurrence of body transfer and INS.
5. Geovisualization immersive virtual environments (GeoIVE)
Readers with a geovisualization background may have noted the absence of one set of attributes among the aforementioned requirements of IVE: image quality, fidelity and photorealism are not listed in section 4.2. This absence is not a matter of simple omission, but instead reflects the fact that the empirical research documents only a medium sized effect of fidelity on the formation of spatial presence and INS (Reeves and Nass Citation1996; Welch et al. Citation1996). However, if we extend our focus beyond the research on spatial presence to another area of IVE application, namely the large scale visualization of specific situations (e.g. driving a car or performing surgery), a different picture emerges: Van Leeuwen et al. (Citation2015), for instance, demonstrated that performance on driving simulators increases significantly when a high fidelity VR environment is provided. Nagendran et al. (Citation2013) made similar observations regarding operating time and performance for surgical trainees using VR simulators (Ruthenbeck et al. Citation2013).
At this point a question arises: what kind of ambience does a geovisualization IVE (GeoIVE) actually represent? For instance, virtual simulation of surgeries is probably of little concern to GIScience (although empirical findings made outside of the subject area can also be of major interest for geovisualization application). We therefore propose a fresh definition of GeoIVE in order to apply the aforementioned theoretical fundaments to a clearly specified field of research. We will present this definition by means of a list of criteria that IVE must meet in order to be considered a GeoIVE.
5.1. Defining criteria for GeoIVE
From a technological point of view, GeoIVE must allow for interactive and stereoscopic exploration in order to facilitate the formation of spatial presence. With this in mind, IVE do not include common desktop-based applications (e.g. VGI, computer games) and videos. However, autostereoscopic displays (Buchroithner and Knust Citation2013; Chen et al. Citation2017), where users perceive stereoscopic images without a HMD, will have to be included into this definition when relevant technologies are brought to the market and positive effects on the GIP are supported empirically.
If we wish users to move through the geovisualization immersions pipeline (GIP), GeoIVE must be modeled at a scale of 1:1, i.e. the perspective of the represented environment the users would perceive on site. As we have argued in section 3, such perspective is a precondition for the generation of spatial presence.
Regarding image quality and photorealism, a scale of 1:1 implies that the elements of a GeoIVE are modeled at a level of detail that allows the user unambiguous (i.e.: 1:1) assignment between the virtually experienced model and the corresponding real world object (be it from a photo or based on previous personal experience, for instance).
The environments represented in a GeoIVE must be realistic. They can also be georeferenced, although this is not necessary. This means that the GeoIVE must be modeled realistically in terms of its components and their distribution. In the case of a GeoIVE of a Caribbean coral reef, for example, appropriate fauna and flora must be located within the appropriate reef zones (e.g. lagoon or crest). However, according to the requirements defined in section 2 and 3, the GeoIVE need not necessarily be georeferenced to any particular site in order to comply with the requirements of the GIP. Consequently, prototypes of particular ecosystems and changing environmental conditions can be modeled (e.g. ocean acidification, rising temperatures) and simulated within the GeoIVE.
Generalization and selection of features and attributes are among the fundamental principles of cartography and geovisualization (Kraak and Ormeling Citation2010). These can also be applied to GeoIVE. Generalization not only implies a reduction of data, but also allows focusing on particular topics of interest. It should be noted that generalization is not in conflict with the criteria of a realistic 1:1 visualization. In practical terms, generalization can refer to, for example, the modeling of prototypes, which are objects that combine the most typical attributes of a category (such as those of a certain coral species), allowing the user to rapidly recognize and classify the model (Rosch [Citation1978]). Moreover, generalization allows focusing on particular aspects of the topic(s) visualized, for example, by modeling only the most important species of a given ecosystem, or by focusing on special environmental issues (e.g. coral bleaching).
5.2. Definition of GeoIVE
Considering the aforementioned criteria, we propose the following definition of GeoIVE in order to provide a condensed theoretical and terminological fundament for the following example of use:
Geovisualization immersive virtual environments (GeoIVE) are a subcategory of immersive virtual environments (IVE). As such, they must offer interactive navigation and a stereoscopic view, which allows users to experience spatial presence and pass through the geovisualization immersion pipeline. Unlike other types of IVE, a GeoIVE visualizes geographic environments in a generalized but realistic manner, at a 1:1 scale.
6. Caribbean coral reefs – a GeoIVE case study
In this section, we will outline how parts of a Caribbean coral reef were modeled under the above-defined terms of a GeoIVE. An underwater ecosystem was chosen for several reasons: On the one hand, coral reefs are visually rich and ecologically complex environments. On the other hand, most people lack direct experience of these ecosystems. Since GeoIVE provide a feasible way to make submarine environments accessible and tangible for everyone, a VR coral reef promises a particularly useful scenario. Given that coral reefs belong to the most threatened ecosystems worldwide, GeoIVE can provide new ways to raise problem awareness and sensitivity.
6.1. Study area & data basis
The site visualized in this project is located in the National Marine Park of Puerto Morelos, near the city of Cancun, Mexico. It forms part of the Mesoamerican Reef System, the world's second largest barrier reef. An area of 3.5 × 3.5 km with water depths of up to 20.9 m was modeled, including the ‘Limones reef’, one of the few sites within the reef system where a high presence of elkhorn corals (Acropora palmata) can still be observed (Rodríguez-Martínez et al. Citation2014; cf. ).
Figure 2. Study area and benthic coverage.
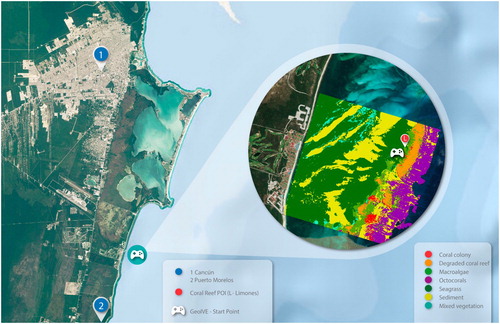
Based on WorldView-2 imagery and in-situ data, detailed information pertaining to both the bathymetry (with a vertical resolution of 10 cm at a 4 m pixel size) and benthic habitats of the study area were available (Cerdeira-Estrada et al. Citation2012). For the present GeoIVE, we utilized a seven-part classification of seafloor coverage (). Moreover, on-site video and photographic material provided solid references for modeling of ambience (cf. section 6.3) and species composition.
Furthermore, a list of the most important species of reef fauna and flora was derived from the National Information System on Biodiversity (SNIB), developed by CONABIO. Together with CONABIO's image data base, information from the SNIB allowed us to both model and texture relevant species in a realistic manner.
6.2. Modeling and texturing of species
Based on the SNIB inventory, 28 species (1 sea turtle, 4 fish species, 6 algae, 2 octocorals, 4 seagrasses and 11 corals) were modeled in Blender, an open-source 3D computer graphics software. The turtle and fish species were modeled from guide images, taken from side-, back-/front- and top-/bottom views: These images were used to fit vertices of basic geometry objects (e.g. cuboids) to the identifying features of the species to be constructed. Where possible (e.g. in the case of fish), mirroring was applied to reduce the effort by only modeling half of an object. Texturing and (if applicable) rigging were also conducted in Blender (). Procedural texturing was used to model coral polyps.
Figure 3. Species modeling and texturing, using the example of the loggerhead sea turtle (Caretta caretta).
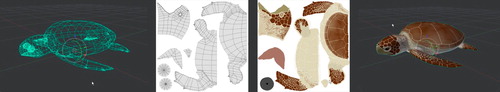
In an iterative process, the render results were constantly crosschecked by oceanographers with diving experience in the study area, in order to ensure fidelity at a species recognition level. All generated models are available online, both in web-enabled and generic 3D file formats (https://sketchfab.com/conabio).
6.3. Ecosystem modeling
Based on VR replicas of the relevant species (section 6.2), Unreal Engine (UE) was used to generate a GeoIVE application where the user can navigate through the study area in a completely independent manner. While both the integration of 3D visualization into geographic information systems (GIS) and importation of GIS data into 3D computer graphics software are already available, direct compatibility between GIS and VR output devices is as yet limited (Manyoky et al. Citation2014). Middleware (e.g. game engines like UE or Unity) is therefore required to make the GIS data available and interactively explorable within the GeoIVE (Boulos et al. Citation2017).
Conceptual issues must also be considered: Current GIS data usually does not have the necessary resolution and information to visualize fauna and flora in 3D at species level. Moreover, GIS focus instead on geographic ground-related information. In contrast, ambience (incl. atmospheric conditions and lighting from different sources) or, more generally speaking, immersion and spatial presence, are qualities that current GIS-based visualization does not address sufficiently.
We therefore considered a two-step approach where (1) 3D-models and pre-referenced geodata are used to populate the GeoIVE, while (2) the ambience (and 6 DoF-interactivity) is generated in UE.
6.3.1. Reef bathymetry and population
Bathymetry data was imported into UE as heightmap and subsequently converted into a 3D mesh. Information on benthic coverage () was then (temporarily) mapped onto the bathymetry mesh in order to distribute and allocate all 3D models correctly. Three methods of object distribution were adopted:
As shown in , almost half of the study area is covered by seagrass. For efficient usage of computing resources, normal mapping (Gortler Citation2012) was therefore applied to these areas. In addition, UE's SimpleGrassWind node was used to simulate the effect of wave movement on the seagrasses.
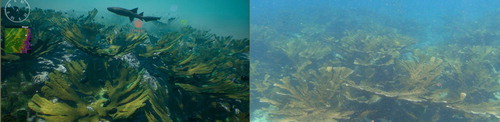
Unlike seagrass, corals do not form extensive meadows but rather occur in compact colonies. To reflect this characteristic, several colonies were modeled based on photographic reference material and distributed (in accordance with ) within all relevant parts of the study area. shows an example of an original site and its VR replica.
In addition to the stationary reef system coverage, we also included several fish and sea turtle species into the GeoIVE. The rigged models were distributed via path animation in the relevant parts of the ecosystems.
Figure 4. Original site (right) and VR-replica (left) – example taken from the ‘Limones reef’ (with elkhorn corals). The GeoIVE example on the left also shows a reference map and 3D icons used to access species fact sheets.
6.3.2. Ambience
Generating a realistic ambience is a precondition to the experience of spatial presence and thus an essential aspect of GeoIVE. The underwater environment represented in this study makes particular demands on ambience rendering; however, several measures were taken to meet these requirements.
In technical terms, the GeoIVE discussed here is constructed as a box, where the bathymetry data and the water surface define the lower and upper limits, respectively. Since the study area has been limited to 3.5 × 3.5 km, four side-walls define the virtual environment accordingly. Navigation was programed so that users can move freely within the VR box, but cannot cross the side-walls or the water surface.
In order to visualize water with its typical characteristics for the study area, UE's post-process-volume function was applied to assign water color. To simulate visibility range, we used UE's exponential height fog. The water surface was constructed with a plane-object with a translucent material, and caustics were generated by an animated material applied to the principal light source. Particle systems visualized suspended solids and air bubbles (cf. ). All of the described water characteristics were defined in accordance with reference photos (). Finally, stereo scuba sounds were added on the audio channel to support site-appropriate ambience.
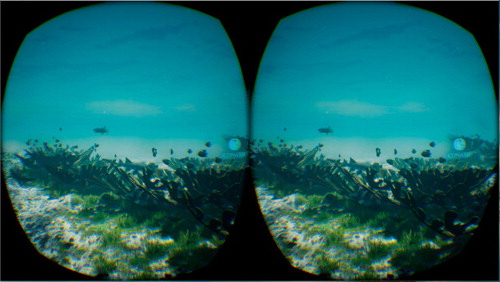
Figure 5. Scene from the GeoIVE at the Limones reef with elkhorn corals (Acropora palmata).
6.4. Navigation and additional information
The GeoIVE discussed here was tailored for the Oculus Rift headset, (then) equipped with a wireless game controller. Navigation is based on what Christie, Olivier, and Normand (Citation2008) call the flying vehicle control model metaphor (Duan et al. Citation2015): We programed the controller to allow for surging (x-axis), swaying (y-axis) and heaving (z-axis), as well as yawing, all at a constant speed. To simplify navigation, tilting on the x- and y-axis (i.e. rolling and pitching) was only enabled by movement of the head(set). A reference map, together with a compass, shows the user their current position and diving direction within the GeoIVE. To provide the user with additional information on the species modeled, 3D icons were placed within the GeoIVE giving interactive access to fact sheets in audio and text format (cf. , left).
6.5. Publication and dissemination
The application's executable files (for Microsoft Windows, currently the main platform of the Oculus Rift headset) are freely available under a CC BY-NC-ND 4.0 license. Unreal project files are available on request. Since the number of users with an Oculus Rift headset at hand is still limited, we are cooperating with different museum and science centers (e.g. the Natural History Museum in Mexico City) in order to integrate GeoIVE workstations into permanent and temporary exhibitions. Furthermore, a freely available desktop version was published in order to provide the general public with the information generated (http://biodiversidad.gob.mx/geoviz).
6.6. Future trends in GeoIVE modeling
Large-scale ecosystem modeling is, especially for natural (compared to built) environments, still a time-consuming process. This is due to the lack of functionalities and data models of current GIS, which would allow the appropriate description of photo-realistic 3D models at a 1:1 scale. Species modeling and animation within the workflow described were therefore conducted manually from scratch.
Regarding the latter argument, several trends can be observed that will act to significantly speed up GeoIVE modeling. Even with low resources, techniques of close-range photogrammetry (e.g. Structure-from-Motion: SfM) allow capture of both the geometry and texture of static objects in high resolution (Carrivick, Smith, and Quincey Citation2016). While SfM has already been used in submarine ecosystems (Burns et al. Citation2015; Leon et al. Citation2015), we achieved unsatisfactory results under the present reef scenario. Applied at the level of individual corals, the particles and objects constantly in motion because of water currents led to artifacts when calculating 3D geometries. Nevertheless, for terrestrial ecosystems, SfM already provides practicable solutions to the automatic generation of high-quality 3D content, especially where zoological or type specimens are available.
While imaging techniques such as SfM can speed up the generation of 3D models, a GeoIVE is also defined by the interactions between elements of flora and fauna, e.g. food chains or predator-prey-relationships. Implementing artificially intelligent (AI) behavior into game engines (and GIS software) will clearly reduce the amount of individual object animation and also allow the use of GeoIVE as platforms for simulating future or past environmental scenarios. As part of the present project, we are currently working on AI-based algorithms to represent flocking behavior of reef fishes (see also Zapotecatl, Munoz-Meléndez, and Gershenson Citation2016).
7. Summary
‘The ultimate display would, of course, be a room within which the computer can control the existence of matter. A chair displayed in such a room would be good enough to sit in.’ (Sutherland Citation1965, 507). While we cannot sit in virtual chairs as yet, recent years have seen significant breakthroughs in VR technology. Clear definitions of virtuality are therefore more necessary than ever in order to establish this topic consistently in the DE research agenda.
In this article, we first reviewed the important terms used in the study of virtual environments, including immersion, spatial presence and embodiment. As we have tried to argue, spatial presence can serve as the conceptual anchor point to frame the idea of virtuality in a way that not only implies computer-generated environments, but also the acceptance of these environments by the users as representations of reality and relevant real-world problems.
Under the designation of GeoIVE, we have then proposed a concept definition that considers both technological and user aspects, linking immersion with spatial presence and embodiment in the GIP framework. This concept was put into practice using the example of a coral reef ecosystem. As we demonstrate, current VR technology can produce realistic geovisualization on the basis of pre-georeferenced data. While no direct compatibility between GIS and VR output devices is available, GeoIVE generation will remain a time-consuming process, spatially limited to local scenarios. However, even on a small scale, we can provide a deeper understanding regarding the potential of immersive geovisualization for the DE envisioned by Gore. This will also require increasing interdisciplinary research: Current investigations on immersive VR and its cognitive implications often build on non- georeferenced, pseudo-realistic or even fictitious environments, while GIScience (incl. DE) has been focusing instead on non-immersive, desktop based VR application at a global and regional scale level, and the notion of GeoIVE providing spatial presence at a 1:1 scale level remains to be thoroughly discussed. Nevertheless, if we wish to convert computer displays into the ‘ultimate display’ envisioned by Sutherland 50 years ago, this idea is both technically feasible and cognitively worthwhile.
Disclosure statement
No potential conflict of interest was reported by the authors.
References
- Ahn, S. J. G., J. Bostick, E. Ogle, K. L. Nowak, K. T. McGillicuddy, and J. N. Bailenson. 2016. “Experiencing Nature: Embodying Animals in Immersive Virtual Environments Increases Inclusion of Nature in Self and Involvement with Nature.” Journal of Computer-Mediated Communication 21 (6): 399–419. doi:10.1111/jcc4.12173.
- Bailey, J. O., J. N. Bailenson, and D. Casasanto. 2016. “When Does Virtual Embodiment Change Our Minds?” Presence: Teleoperators and Virtual Environments 25 (3): 222–233. doi:10.1162/PRES_a_00263.
- Balakrishnan, B., and S. Sundar. 2011. “Where Am I? How Can I Get There? Impact of Navigability and Narrative Transportation on Spatial Presence.” Human–Computer Interaction 26 (3): 161–204. doi:10.1080/07370024.2011.601689.
- Barfield, W., K. M. Baird, and O. J. Bjorneseth. 1998. “Presence in Virtual Environments as a Function of Type of Input Device and Display Update Rate.” Displays 19 (2): 91–98. doi:10.1016/S0141-9382(98)00041-9.
- Boulos, M. N. K., Z. Lu, P. Guerrero, C. Jennett, and A. Steed. 2017. “From Urban Planning and Emergency Training to Pokémon Go: Applications of Virtual Reality GIS (VRGIS) and Augmented Reality GIS (ARGIS) in Personal, Public and Environmental Health.” International Journal of Health Geographics 16 (1): 1–11. doi:10.1186/s12942-017-0081-0
- Bowman, D. A., and R. P. McMahan. 2007. “Virtual Reality: How Much Immersion is Enough?” Computer 40 (7): 36–43. doi:10.1109/MC.2007.257.
- Bracken, C. C., G. Pettey, T. Guha, and B. E. Rubenking. 2010. “Sounding Out Small Screens and Telepresence.” Journal of Media Psychology 22: 125–137. doi:10.1027/1864-1105/a000017.
- Buchroithner, M., and C. Knust. 2013. “The Third Dimension in Cartography: Recent and Future Developments.” Kartographische Nachrichten 63: 127–132.
- Burns, J. H. R., D. Delparte, R. D. Gates, and M. Takabayashi. 2015. “Integrating Structure-from-Motion Photogrammetry with Geospatial Software as a Novel Technique for Quantifying 3D Ecological Characteristics of Coral Reefs.” PeerJ 3: e1077. doi:10.7717/peerj.1077.
- Carrivick, J. L., M. W. Smith, and D. J. Quincey. 2016. Structure from Motion in the Geosciences. Chichester: John Wiley & Sons.
- Cerdeira-Estrada, S., T. Heege, M. Kolb, S. Ohlendorf, A. Uribe, A. Müller, R. Garza, et al. 2012. “Benthic Habitat and Bathymetry Mapping of Shallow Waters in Puerto Morelos Reefs Using Remote Sensing with a Physics Based Data Processing.” IEEE International, 4383–4386. doi:10.1109/IGARSS.2012.6350402.
- Chen, H. S., H. F. Wang, C. J. Chou, and T. H. Lin. 2017. “Visual Comfort in Autostereoscopic Display.” Journal of the Society for Information Display 25 (5): 320–330. doi:10.1002/jsid.554.
- Christie, M., P. Olivier, and J. M. Normand. 2008. “Camera Control in Computer Graphics.” Computer Graphics Forum 27 (8): 2197–2218. doi:10.1111/j.1467-8659.2008.01181.x.
- Coxon, M., N. Kelly, and S. Page. 2016. “Individual Differences in Virtual Reality: Are Spatial Presence and Spatial Ability Linked?” Virtual Reality 20 (4): 203–212. doi:10.1007/s10055-016-0292-x.
- Craglia, M., K. de Bie, D. Jackson, M. Pesaresi, G. Remetey-Fülöpp, C. Wang, and A. Annoni. 2012. “Digital Earth 2020: Towards the Vision for the Next Decade.” International Journal of Digital Earth 5 (1): 4–21. doi:10.1080/17538947.2011.638500.
- Cummings, J. J., and J. N. Bailenson. 2016. “How Immersive is Enough? A Meta-Analysis of the Effect of Immersive Technology on User Presence.” Media Psychology 19 (2): 272–309. doi:10.1080/15213269.2015.1015740.
- Dilworth, J. 2010. “Realistic Virtual Reality and Perception.” Philosophical Psychology 23 (1): 23–42. doi:10.1080/09515080903533942.
- DiMento, J., and P. Doughman. 2014. “Introduction: Making Climate Change Understandable.” In Climate Change: What It Means for Us, Our Children, and Our Grandchildren, edited by Jospeh DiMento, and Pamela Doughman, 1–14. Cambridge: MIT Press.
- Duan, Q., J. Gong, W. Li, S. Shen, and R. Li. 2015. “Improved Cubemap Model for 3D Navigation in Geo-Virtual Reality.” International Journal of Digital Earth 8 (11): 877–900. doi:10.1080/17538947.2014.947339.
- Gibson, J. 1979. The Ecological Approach to Visual Perception. Boston: Houghton-Mifflin.
- Goodchild, M. 2008. “The Use Cases of Digital Earth.” International Journal of Digital Earth 1 (1): 31–42. doi:10.1080/17538940701782528.
- Goodchild, M., H. Guo, A. Annoni, L. Bian, K. de Bie, F. Campell, M. Craglia, et al. 2012. “Next-Generation Digital Earth.” Proceedings of the National Academy of Sciences 109 (28): 11088–11094. doi:10.1073/pnas.1202383109.
- Gore, A. 1998. “The Digital Earth: Understanding Our Planet in the 21st Century.” Australian Surveyor 43 (2): 89–91. doi: 10.1080%2F00050348.1998.10558728
- Gortler, S. J. 2012. Foundations of 3D Computer Graphics. Cambridge: MIT Press.
- Hartmann, Tilo, Werner Wirth, Holger Schramm, Christoph Klimmt, Peter Vorderer, André Gysbers, Saskia Böcking, et al. 2016. “The Spatial Presence Experience Scale (SPES).” Journal of Media Psychology 28: 1–15. doi:10.1027/1864-1105/a000137.
- Hartmann, T., W. Wirth, P. Vorderer, C. Klimmt, H. Schramm, and S. Böcking. 2015. “Spatial Presence Theory: State of the Art and Challenges Ahead.” In Immersed in Media, edited by M. Lombard, F. Biocca, J. Freeman, W. IJsselsteijn, and R. Schaevitz, 115–135. Heidelberg; New York: Springer.
- International Society for Presence Research. 2000. “The Concept of Presence: Explication Statement.” Accessed July 24, 2017. https://ispr.info/.
- Johnson, D. M., and J. E. Stewart II. 1999. “Use of Virtual Environments for the Acquisition of Spatial Knowledge: Comparison among Different Visual Displays.” Military Psychology 11: 129–148. doi:10.1207/s15327876mp1102_1.
- Jones, K., R. Devillers, Y. Bédard, and O. Schroth. 2014. “Visualizing Perceived Spatial Data Quality of 3D Objects within Virtual Globes.” International Journal of Digital Earth 7 (10): 771–788. doi:10.1080/17538947.2013.783128.
- Kim, K., M. Z. Rosenthal, D. J. Zielinski, and R. Brady. 2014. “Effects of Virtual Environment Platforms on Emotional Responses.” Computer Methods and Programs in Biomedicine 113: 882–893. doi:10.1016/j.cmpb.2013.12.024.
- Kraak, M. J., and F. Ormeling. 2010. Cartography: Visualization of Geospatial Data. Harlow: Prentice Hall.
- Laarni, J., N. Ravaja, T. Saari, S. Böcking, T. Hartmann, and H. Schramm. 2015. “Ways to Measure Spatial Presence: Review and Future Directions.” In Immersed in Media, edited by M. Lombard, F. Biocca, J. Freeman, W. IJsselsteijn, and R. Schaevitz, 139–185. Heidelberg; New York: Springer.
- Leon, J. X., C. M. Roelfsema, M. I. Saunders, and S. R. Phinn. 2015. “Measuring Coral Reef Terrain Roughness Using ‘Structure-from-Motion’ Close-Range Photogrammetry.” Geomorphology 242: 21–28. doi:10.1016/j.geomorph.2015.01.030.
- Liu, Z., C. Wang, Q. Lin, and Y. Liu. 2017. “Review of the Development of Digital Earth Research During 1998–2015 Based on a Bibliometric Analysis.” International Journal of Digital Earth 10 (7): 749–763. doi:10.1080/17538947.2017.1310940.
- MacEachren, A. M., R. Edsall, D. Haug, R. Baxter, G. Otto, R. Masters, S. Fuhrmann, and L. Qian. 1999. “Exploring the Potential of Virtual Environments for Geographic Visualization.” In Annual Meeting of the Association of American Geographers, Honolulu, HI (pp. 23–27).
- MacEachren, A. M., and M. J. Kraak. 2001. “Research Challenges in Geovisualization.” Cartography and Geographic Information Science 28 (1): 3–12. doi:10.1559/152304001782173970.
- Manyoky, M., U. Wissen Hayek, K. Heutschi, R. Pieren, and A. Grêt-Regamey. 2014. “Developing a GIS-Based Visual-Acoustic 3D Simulation for Wind Farm Assessment.” ISPRS International Journal of Geo-Information 3 (1): 29–48. doi:10.3390/ijgi3010029.
- Minton, J. 2014. “Real Geographies and Virtual Landscapes: Exploring the Influence on Place and Space on Mortality Lexis Surfaces Using Shaded Contour Maps.” Spatial and Spatio-Temporal Epidemiology 10: 49–66. doi:10.1016/j.sste.2014.04.003.
- Nagendran, M., K. S. Gurusamy, R. Aggarwal, M. Loizidou, and B. R. Davidson. 2013. “Virtual Reality Training for Surgical Trainees in Laparoscopic Surgery.” Cochrane Database of Systematic Reviews 8. doi:10.1002/14651858.CD006575.pub3.
- Reeves, B., and C. Nass. 1996. The Media Equation: How People Treat Computers, Television, and New Media Like Real People and Places. New York: Cambridge University Press.
- Rodríguez-Martínez, Rosa E., Anastazia T. Banaszak, Melanie D. McField, Aurora U. Beltrán-Torres, Lorenzo Álvarez-Filip, and Benjamin Ruttenberg. 2014. “Assessment of Acropora Palmata in the Mesoamerican Reef System.” PLOS ONE 9 (4): e96140. doi:10.1371/journal.pone.0096140.
- Rosch, E. 1978. “Principles of Categorization”.” In Cognition and Categorization, edited by Eleanor Rosch, and Barbara Lloyd, 27–48. Hillsdale: Lawrence Erlbaum.
- Russell, A. L. 1997. “Nonexpert Conceptions of Virtual Reality.” Journal of Research on Computing in Education 30 (1): 53–66. doi:10.1080/08886504.1997.10782213.
- Ruthenbeck, G. S., J. Hobson, A. S. Carney, S. Sloan, R. Sacks, and K. J. Reynolds. 2013. “Toward Photorealism in Endoscopic Sinus Surgery Simulation.” American Journal of Rhinology & Allergy 27 (2): 138–143. doi:10.2500/ajra.2013.27.3861.
- Schubert, T., and J. Crusius. 2002. “Five Theses on the Book Problem: Presence in Books, Film and VR.” Paper presented at PRESENCE 2002 – 5th International Workshop on Presence, 53–59. Porto: Universidad Fernando Pessoa.
- Schultz, P. W. 2001. “The Structure of Environmental Concern: Concern for Self, Other People, and the Biosphere.” Journal of Environmental Psychology 21 (4): 327–339. doi:10.1006/jevp.2001.0227.
- Schulze, J. P., H. S. Kim, P. Weber, A. Prudhomme, R. E. Bohn, M. Seracini, and T. A. DeFanti. 2011. “Advanced Applications of Virtual Reality.” Advances in Computers 82: 217–260. doi: 10.1016/B978-0-12-385512-1.00006-2
- Sevillano, V., J. I. Aragonés, and P. W. Schultz. 2007. “Perspective Taking, Environmental Concern, and the Moderating Role of Dispositional Empathy.” Environment and Behavior 39 (5): 685–705. doi:10.1177/0013916506292334.
- Shapiro, L., ed. 2014. The Routledge Handbook of Embodied Cognition. New York: Routledge.
- Skalski, P., R. Tamborini, A. Shelton, M. Buncher, and P. Lindmark. 2011. “Mapping the Road to Fun: Natural Video Game Controllers, Presence, and Game Enjoyment.” New Media & Society 13: 224–242. doi:10.1177/1461444810370949.
- Skarbez, R., F. P. Brooks Jr, and M. C. Whitton. 2017. “A Survey of Presence and Related Concepts.” ACM Computing Surveys (CSUR) 50 (6): 1–39. doi:10.1145/3134301.
- Slater, M., and S. Wilbur. 1997. “A Framework for Immersive Virtual Environments (FIVE): Speculations on the Role of Presence in Virtual Environments.” Presence: Teleoperators and Virtual Environments 6 (6): 603–616. doi:10.1162/pres.1997.6.6.603.
- Slocum, T. A., C. Blok, B. Jiang, A. Koussoulakou, D. R. Montello, S. Fuhrmann, and N. R. Hedley. 2001. “Cognitive and Usability Issues in Geovisualization.” Cartography and Geographic Information Science 28 (1): 61–75. doi:10.1559/152304001782173998.
- Sutherland, I. 1965. “The Ultimate Display.” Information Processing 1965. In Proceedings of the IFIP Congress, edited by W. A. Kalenich, 506–508. Washington, DC: Spartan Books.
- Taylor, D. R. F. 1991. “A Conceptual Basis for Cartography: New Directions for the Information Era.” The Cartographic Journal 28 (2): 213–216. doi: 10.1179/caj.1991.28.2.213
- Trope, Y., N. Liberman, and C. Wakslak. 2007. “Construal Levels and Psychological Distance: Effects on Representation, Prediction, Evaluation, and Behavior.” Journal of Consumer Psychology 17 (2): 83–95. doi:10.1016/S1057-7408(07)70013-X.
- Van Leeuwen, P. M., C. Gómez i Subils, A. Ramon Jimenez, R. Happee, and J. C. de Winter. 2015. “Effects of Visual Fidelity on Curve Negotiation, Gaze Behaviour and Simulator Discomfort.” Ergonomics 58 (8): 1347–1364. doi:10.1080/00140139.2015.1005172.
- Welch, R. B., T. T. Blackmon, A. Liu, B. A. Mellers, and L. W. Stark. 1996. “The Effects of Pictorial Realism, Delay of Visual Feedback, and Observer Interactivity on the Subjective Sense of Presence.” Presence: Teleoperators and Virtual Environments 5 (3): 263–273. doi:10.1162/pres.1996.5.3.263.
- Wirth, W., T. Hartmann, S. Böcking, P. Vorderer, C. Klimmt, H. Schramm, T. Saari, et al. 2007. “A Process Model of the Formation of Spatial Presence Experiences.” Media Psychology 9 (3): 493–525. doi:10.1080/15213260701283079.
- Zapotecatl, J. L., A. Munoz-Meléndez, and C. Gershenson. 2016. “Performance Metrics of Collective Coordinated Motion in Flocks.” Proceedings of the Artificial Life Conference 2016, 322–329. doi:10.7551/978-0-262-33936-0-ch054
- Zhang, C., M. Chen, R. Li, C. Fang, and H. Lin. 2016. “What’s Going on about Geo-Process Modeling in Virtual Geographic Environments (VGEs).” Ecological Modelling 319: 147–154. doi:10.1016/j.ecolmodel.2015.04.023.