
 ?Mathematical formulae have been encoded as MathML and are displayed in this HTML version using MathJax in order to improve their display. Uncheck the box to turn MathJax off. This feature requires Javascript. Click on a formula to zoom.
ABSTRACT
Urbanization in China is closely connected with ambient particulate matter 2.5 (PM2.5). However, the potential for altering PM2.5 through the urban landscape characteristics is uncertain. In this study, we analyzed the urban PM2.5 pollution situation for 2014–2016 and investigated the impact of landscape factors on urban PM2.5 in China at the city level. All the prefecture-level cities were stratified by urban population size into small (<500,000), medium (500,000–1,000,000), and large (>1,000,000), and the other second-level administrative cities were assigned as ‘other’ cities. The multivariate regression model including both urban landscape factors and social-economic variables explained 70.0%, 32.8%, 19.2%, and 12.4% of the arithmetic mean PM2.5 concentration (AMC-PM2.5) for the other, small, medium, and large cities, respectively. With regard to the configuration of land cover, agricultural activity is a major contributor of PM2.5 pollution, for which the explanatory power ranged from 7.6% (for the large cities) to 64% (for the other cities). In addition, grassland aggregation also has a limited but negative effect on urban PM2.5 pollution, despite the negligible effect on dry deposition. Overall, these findings likely reflect the interaction between urban air quality and urbanization, and will have implications for air quality control strategies.
1. Introduction
Air pollution, in which ambient fine particulate matter (PM2.5) acts as a vital protagonist, has aroused widespread public concern. Numerous studies have indicated that even short-term human exposure to PM2.5 is associated with increased cardiovascular and respiratory morbidity and mortality (Zhou et al. Citation2011; Wang et al. Citation2014), especially for the elderly (Zeng et al. Citation2010). As the world’s second-largest economy and the most populous nation, more than 56% of the population of China, which is higher than the global average level (54%) (Marchand and Siegel Citation2015), live in urban areas, and this number is projected to reach 73% by 2050 (United Nations Citation2012). For China, as one of the hardest-hit areas and a rapidly developing country, it has been documented that more than 500 million urban residents are at risk of severe PM2.5 pollution (He, Han, and Zhang Citation2016). However, to date, the mechanisms leading to urban PM2.5 formation in China remain highly uncertain, in part because of the capricious climate, complex chemical components (Zhang et al. Citation2015), and diverse sources of urban PM2.5 in different regions (Hu et al. Citation2017).
Sustainable economic and social development is essential to eradicate poverty while ensuring environmental protection (McCarty and Kaza Citation2015). A number of studies have focused on the relationships between urban form characteristics and PM2.5 exposure. For instance, Clark, Millet, and Marshall (Citation2011) investigated the effects of population form (including density and centrality) and transit supply on PM2.5 in 111 U.S. urban areas, and McCarty and Kaza (Citation2015) focused on the correlation between urban area form and PM2.5 in metropolitan areas of America. It is noted that these studies have limited applicability with regard to China, as a result of the large differences between China and the other study areas. Meanwhile, several studies have attempted to explore the interaction between the PM2.5 of China and urban characteristics, mainly at the individual city level (e.g. Beijing [Han et al. Citation2015b; Fan et al. Citation2017] and Wuhan [Xu et al. Citation2016]) or the urban agglomeration level (e.g. Jing-Jin-Ji, Yangtze River Delta, Pearl River Delta, Chang-Zhu-Tan, Chengdu-Chongqing, and Guanzhong [Feng, Zou, and Tang Citation2017]). Nonetheless, experts have called for a more thorough consideration of China’s urbanization at the national scale (Han, Zhou, and Li Citation2015a; Li et al. Citation2016; Wang et al. Citation2017). However, there are still three main research gaps with regard to these national-scale studies. Firstly, the study periods of most of the studies are pre-2015 (e.g. 246 prefecture-level cities during 1999–2011 [Li et al. Citation2016], 190 cities in 2013 [Zhang and Cao Citation2015], and 190 cities in 2014 [Wang et al. Citation2017]), while both the general public and the authorities are more concerned with the current pollution situation, especially since the most recent revision of the environmental protection laws in China (2014). Secondly, limited by the relatively low urbanization level and the sparsely distributed PM2.5 monitoring stations, some autonomous prefectures (i.e. cities at the second administrative level,) have attracted much less concern than the prefecture-level cities, as mentioned before. Thirdly, composition-related landscape factors (e.g. built-up proportion, ecological land proportion [Han et al. Citation2015b]), nighttime light intensity (Larkin et al. Citation2016), and population data (e.g. population density [Han, Zhou, and Li Citation2015a] and urbanization-induced population migration [Shen et al. Citation2017]) have been the major focus in recent studies, in addition to statistical data (Li et al. Citation2016) and gross domestic product (Wang et al. Citation2017). Meanwhile, the effect of each land-cover type on PM2.5 pollution concentration is less well understood and requires further study. For instance, in 2015, Suzhou and Wuhu, two large cities in Anhui province, experienced AMC-PM2.5 concentrations that were significantly different (71.75 μg/m3 in Suzhou and 49.09 μg/m3 in Wuhu), despite the cities being mainly affected by similar pollution sources, including dust and vehicle emissions. It is of interest to note that these two cities are comparable in built-up proportion and numbers of residents (31.4/32.2% for built-up proportion and 1.47/1.67 million urban residents), but there is a large discrepancy in the average size of the built-up parcels within the urban areas (4.29 ha. for Suzhou and 6.68 ha. for Wuhu, it is mentioned that all these parameters are calculated in this research, the below is same). That is to say, it is of value to analyze the associations between spatial layout (i.e. both composition and configuration) of land cover and PM2.5 in the different urban levels of China, as cities of different sizes may suffer from specific problems.
In view of this, by controlling the natural environmental, population, and economic factors, this study was aimed at quantifying the effects of the urban land-cover landscape on the arithmetic mean PM2.5 levels (AMC-PM2.5) in China for 2014–2016, using a multivariate regression model. We used the available long-term datasets in relation to AMC-PM2.5 levels to analyze the large-scale spatial () and temporal (i.e. seasonal and monthly) variations (). In the meantime, the availability of remote sensing data enabled the analyses to be undertaken at a larger spatial extent (including all the cities at the second administrative level in mainland China) and finer resolution (e.g. 30 m for land cover) than had previously been possible. It is noted that cities of different levels may suffer from specific PM2.5 problems. For instance, cropland landscapes are more important for small cities with agriculture-based economies, while built-up/population-related factors are more important for metropolises such as Wuhan. In view of this, by controlling for all the confounding factors, we addressed the effects of the urban landscape at each city level, according to the urban scale division of the State Council of China. Finding strategies to balance urban air pollution, development levels, and land-cover functions in these areas, including a more sustainable management of urban planning, will be essential for China to achieve the goals of the Action Plan on Prevention and Control of Air Pollution (available at: http://www.gov.cn/zwgk/2013-09/12/content_2486773.htm).
Figure 1. The current AMC-PM2.5 state of China. Left: long-term two-year arithmetic mean concentrations of PM2.5 for each of the 325 cities evaluated from 01 June 2014 to 31 May 2016. Top right: two digital photos (taken on a high air quality day and a foggy day, respectively, where TEM and RH are short for temperature and relative humidity, respectively) from the Bird’s Nest Stadium, Beijing. Bottom right: similar photos from the campus of Wuhan University, Wuhan.
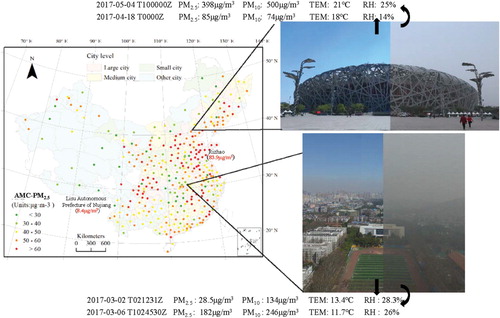
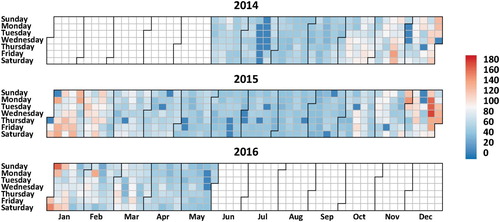
Figure 2. Average arithmetic mean PM2.5 levels of the 325 cities in China, from 01 June 2014 to 31 May 2016.
2. Materials and methods
2.1. Urban area extraction
The materials used for the urban area extraction were the China Land Use/Cover Dataset (CLUD), including a 30 m summary of built-up land for the year circa 2015 (Liu et al. Citation2014), an elevation dataset (website: http://earthexplorer.usgs.gov/), and the administrative boundaries (website: http://www.gadm.org). The producer’s accuracies and user’s accuracies of all the thematic categories of the CLUD data have been reported to be higher than 90% (Liu et al. Citation2014). The urban area boundary delineation was based on the following three steps (Zhou et al. Citation2014): 1) a built-up intensity map was produced for each city by a 1 km × 1 km moving window method based on the CLUD data; 2) the built-up intensity map was split into high- and low-intensity land according to a 50% threshold; and 3) the built-up parcels were gathered in the high-intensity land by an aggregation distance of 2 km. Given the urban boundary for each city, the pollution data and the urban landscape factors were then both averaged at the city level.
2.2. Urban PM2.5 estimation
The severe PM pollution status in China has forced the government to act. On 29 February 2012, the third revision of the National Ambient Air Quality Standards (NAAQS) (GB 3095–2012) (Chinese Ministry of Environmental Protection (MEP) Citation2012) was published, in which PM2.5 was included in the NAAQS for the first time. Since then, a national network of real-time hourly PM2.5 monitoring stations (made up of 1,510 monitoring stations, see: http://www.cnemc.cn/) has been gradually established. The values from the monitoring stations at each city are automatically reported to the MEP, and are published after being validated through the Technical Guideline on Environmental Monitoring Quality Management (HJ 630–2011) (Chinese MEP Citation2011).
The study period ranges from 01 June 2014 to 31 May 2016 (data are missing or invalid for 15–23 July, 28 July, and 04 October 2014; 01 January 2015; and 09 January 2016, and were thus removed, see ). In this study, to produce long-term pollution data for the individual sites, a quality check was first conducted on the hourly data to remove problematic data points (e.g. nonnumeric recordings), and the available daily average was calculated only when there were valid data for more than 20 h during the day. The inclusion criteria for the monitoring stations were: 1) available observations for at least 75% of the days in the study period; 2) designated as non-source oriented (i.e. ‘ambient’); and 3) located in urban areas. In this way, data from 738 stations in 325 cities were used in this research.
Due to the spatially uneven distribution of the stations, we needed to interpolate the ground site data into surface data. In a similar way to the calculation approach presented in Clark, Millet, and Marshall (Citation2011), Equations (Equation1(1)
(1) ) and (Equation2
(2)
(2) ) were used to calculate the daily population-weighted (PW) and arithmetic mean (AM) PM2.5 concentrations for each urban area:
(1)
(1)
(2)
(2) where ci, pi are the interpolated concentration (using inverse distance weighting of the daily available observations from the three nearest monitoring stations within 50 km) and estimated population (from the latest gridded population dataset for the year 2010, relative error: 4.5–13.6%, Fu, Jiang, and Huang [Citation2014]) in each 1 km grid cell i within the urban area; and n is the number of 1 km grid cells within the urban area. Given the daily PM2.5 pollution level, two annual averages (01 June 2014 to 31 May 2015; and 01 June 2015 to 31 May 2016, to average the mean concentration levels of each day in a civil year) and the two-year average concentration were then estimated.
2.3. Spatial metrics of urban land cover
In landscape ecology, land-cover map patterns represent the data of interest as a mosaic of discrete patches. Each patch is a continuous parcel in a free-form shape, where each pixel in a patch belongs to the same land-cover type. summarizes the urban land-cover layout factors utilized in this study, which were estimated from the CLUD, which is a ∼30 m gridded summary of national land cover (including cropland (CL), grassland (GL), water bodies, forest, and built-up land (BL)). We used FRAGSTATS (McGarigal et al. Citation2002), which is a spatial pattern analysis package, to quantify the spatial composition and configuration. In this study, proportion, elongation, aggregation, and isolation for each land-cover type were calculated. The abbreviation of the metric is prefixed with the short name of the land-cover type. For instance, CL_PLAND refers to the proportion of cropland within the urban area. Table A.1 summarizes the independent variables considered in each city group.
Table 1. Landscape pattern metrics used in the study.
2.4. Stratified statistical analysis
According to the urban scale division of the State Council of China (available at: http://www.gov.cn/zhengce/content/2014-11/20/content_9225.htm) and the sixth national census (the latest and most detailed, available at: http://www.stats.gov.cn/ztjc/zdtjgz/zgrkpc/dlcrkpc/dlcrkpczl/), the prefecture-level cities were grouped as, small, medium, and large (). In addition to these prefecture-level cities, there were 48 secondary administrative cities, including 27 minority-nationality autonomous prefectures, 11 minority-nationality autonomous municipalities, and some county-level cities. Although accounting for a considerable proportion of the urban areas in China, these cities have attracted much less concern, due to the lack of measurements of the factors of interest. In this study, we classified these cities as the ‘other’ city group (). We first evaluated the daily, annual, and two-year average PM2.5 pollution levels in the 325 cites of China. The four city groups were compared by ANOVA analysis, including a summary of AMC-PM2.5 and its difference with PWC-PM2.5. Finally, to investigate the relationship between the spatial metrics of land cover and AMC-PM2.5, a multivariate linear regression model (Broman and Speed Citation2002) for each city group was applied, with the model structures consisting of a subset of variables selected via forward and backward stepwise regression. A univariate association analysis (including zero-order and partial Pearson correlations) was also conducted to endorse the correlations between the selected factor and AMC-PM2.5. The adjusted factors used in the regression model included both natural environmental and socio-economic factors. The natural environmental variables were two-year average temperature (Tem.), two-year average precipitation (Pre.), and two-year average dilution rate (Dil.), as well as distance to coast (Coast). The socio-economic factors were urban population per square kilometer (POPD) and total value of nighttime light per square kilometer (NTLD). Details of the production processes for these adjusted factors can be found in Appendix Notes A1–A3. Variable selection was processed using the corrected Akaike Information Criterion (AIC) (Burnham and Anderson Citation2002), which is an information-theoretic approach. By this means, variables with the greatest explanatory power and least multicollinearity were retained to establish the final model. In the reduced regression models, the highly auto-correlated independent factors were eliminated.
Table 2. Descriptive statistics of the city groups of China.
3. Results
3.1. General PM2.5 pollution situation
During the two study years, taking all 325 cities as a whole, although the annual average showed a decreasing tendency (by 4.8 ± 4.4 μg/m3 for AMC-PM2.5) over the study period, there were still 115.5 ± 81.9 days where pollution exceeded Grade II of the NAAQS of China. According to the NAAQS of China (Grade II), as many as 282 and 260 cities did not meet the annual standard for AMC-PM2.5 during the two study years, respectively. The two-year average 24 h AMC-PM2.5 concentrations ranged from 8.45 μg/m3 (Lisu Autonomous Prefecture of Nujiang, an other city in Yunnan province) to 83.89 μg/m3 (Rizhao, in Shandong province), with a general average of 50.21 ± 15.31 μg/m3. Specifically, the northern regions () and the inland regions contain the severely affected cities, where the top two hardest-hit areas—the North China Plain and the northwest desert area—are a result of anthropogenic activity/interaction between wind circulation and terrain and Asian dust, respectively. As can be seen in , except for the cities suffering from Asian dust, the rest of the other cities located in the Yunnan-Guizhou Plateau and Tibetan Plateau are less affected by AMC-PM2.5 pollution as they benefit from the low level of human activities and the large areas of ecological land cover. PM2.5 shows remarkable seasonable variability, with the highest levels seen during the winter and the lowest during the summer (). We can attribute the former situation to the enhanced anthropogenic emission in the cold temperature period, the temperature inversion, and the weak wind. In contrast, the latter situation can be attributed to the Asian summer monsoon and increased precipitation (Zhang and Cao Citation2015).
3.2. Group comparison
The pollution levels and the differences of all the cities in the four urban divisions are listed and compared in and , respectively. Overall, the AMC-PM2.5 pollution level increases with the city level. By the use of a one-way ANOVA analysis, it was found that the differences between the four city groups are significant. In detail, the other cities present significantly lower PM2.5 pollution levels than the large and the medium divisions (). At the same time, with regard to AMC-PM2.5, there is no significant difference between the large cities and the medium cities, and between the small cities and the other cities (). The AMC-PM2.5 levels in the other cities (with less than 0.5 million urban residents) are significantly lower than in the large and the medium cities, with large intra-class variation. On the one hand, the harsh natural environment (i.e. Asian dust) is partly responsible for the severe PM2.5 pollution in some of the other cities (for instance, Haidong prefecture in Qinghai province, with 71.84 μg/m3, see ). On the other hand, due to the reduced human emissions as well as the large amount of ecological land cover, some other cities are relatively free from PM2.5 pollution. For instance, the two-year average AMC-PM2.5 in Enshi Tujia and Miao Autonomous Prefecture in Hubei province, where the forest coverage rate reaches 70%, is 13.19 μg/m3. We further recorded the concentration difference between PWC-PM2.5 and AMC-PM2.5 for each city group (). From the mean value, this indicates that, within the urban areas, the densely populated regions are more polluted, but this phenomenon is only significant in the small city group. Moreover, it is of interest to note that the differences increase with the decrease of the city level.
Table 3. Descriptive statistics of AMC-PM2.5 and its difference with PWC-PM2.5 in the four urban divisions.
Table 4. Games-Howell multiple comparisons between the pairwise city groups.
3.3. Association with urban landscape factors
The last two columns of each group in represent the correlation analysis results, which are consistent with the results from the corresponding stepwise regression. The stepwise multivariate models of PM2.5 are shown in the first three columns of , where the multicollinearity in each model has been avoided (see Appendix Table A3). The reduced models incorporating integrated urban landscape factors explain 70.0%, 32.8%, 19.2%, and 12.4% of the concentration of AMC-PM2.5 for the other, small, medium, and large cities, respectively. When taking the socio-economic factors as controlling factors, the built-up related metrics present only limited effects. The grassland aggregation level works in favor of the aggravation of PM2.5 pollution in all the prefecture-level cities, and the isolation of grassland patches with a larger size results in a small drop in the concentration of PM2.5 in the other cities. Cropland plays a significant role in every city group. Compared to the medium and large cities, agricultural activity in the small and other cities acts as an important pollution source (i.e. CL_PLAND for the small and other cities is R2 = 24.4% and R2 = 64.3%, respectively). With regard to the elongation level of cropland, it is associated with an increase in AMC-PM2.5 in the other cities (R2 = 3%). It should be noted that, in the stepwise regression model, more informative independent variables have been picked out from the clusters of highly correlated variables, to avoid the multicollinearity problem (Appendix Table A4).
Table 5. Multivariate association between AMC-PM2.5 and urban landscape factors.
When further focusing on agricultural activity, it is well known that straw burning in autumn in China has an unignorable impact on PM2.5 (Zhang, Liu, and Hao Citation2016). However, this effect may be confused with the effect of fertilizer, which is mostly applied in spring and early summer, as the stepwise regression was conducted for the annual AMC-PM2.5. To investigate this issue, the relationships between the cropland composition metrics (both proportion [CL_PLAND] and the size of the largest cropland patch within the urban area) and seasonal/annual AMC-PM2.5 are presented in . Due to the lack of a straw burning metric, we added fire radiative power (FRP) acquired from the Visible Infrared Imaging Radiometer Suite (VIIRS) Active Fire Data (see Appendix Note A3) as an additional proxy to control the partial correlation process. The suitability of this data was confirmed in Zhang et al. (Citation2015). As nitrogen fertilizer is applied mostly in spring and early summer, the largest correlation value in confirms the impact of fertilizer on PM2.5 in the urban areas in China.
Table 6. Univariate association (partial Pearson correlation) between cropland composition metrics and AMC-PM2.5 concentration.
4. Discussion
The environmental protection laws in China were revamped in 2014 by the Chinese government. However, after two years of intense effort, PM2.5 concentration still often fails to meet the standard criteria. Despite the awakening of public awareness, there is a lack of awareness of the impact of anthropogenic activities on AMC-PM2.5 pollution. An important message is the need for greater understanding of how the layout of the urban land cover of cities impacts the air quality of China. Our results will have some important implications for China, revealing a conflict between urbanization, the environment, and economic growth.
In contrast to the recent studies that have mainly focused on developed regions (Xu et al. Citation2016), this paper has reported on the PM2.5 status in the urban areas of different city levels. As an addition to the survey of city-average PM2.5 of 190 cities in 2013 (Zhang and Cao Citation2015), this research further reports on the most recent two-year situation in all the second-level administrative urban areas of China and the associated non-attainment rates. During the study period, the national two-year average was 50.21 ± 15.31 μg/m3 for daily PM2.5, and around 15.8%±11.2% of the days were non-attainment days that exceeded the new NAAQS standard of China. In view of the spatial distribution, the results obtained in this study are consistent with the measurements for 2013 (Zhang and Cao Citation2015). However, the two-year average for 2014–2016 is below that for 2013 (i.e. 61 μg/m3 in Zhang and Cao [Citation2015]), for the following reasons. 1) Our result represents an average status for 325 cities across multiple city levels (including both small and other cities), whereas the previous study mainly focused on cities at the medium level (and above). Considering that pollution status generally gets worse with the increase of city level, a national average that does not consider the smaller cities may lead to some overestimation. 2) In accordance with the view that ambient PM2.5 pollution has improved significantly between 2014 and 2016 (Song et al. Citation2017), our result can be considered as reasonable. 3) Compared to the hourly data from all the monitoring sites used in Zhang and Cao (Citation2015), in this study, we calculated the distance-weighted ambient concentration of all the valid urban areas, which is a more consistent approach for measuring the status of urban PM2.5 pollution. In addition, the increased number of PM2.5 monitoring stations in recent years enables more accurate PM2.5 concentration estimation.
When linking urban PM2.5 concentration with land-cover factors, the most obvious correlation is that agricultural activity has an impact on urban PM2.5 in multiple city levels. China is a great agrarian country, and is also the biggest user of fertilizer in the world (Food and Agricultural Organization of the United Nations Citation2016). To balance the trade-off between achieving crop production targets and the environmental bearing capacity, efficient allocation of nitrogen should be ensured (Mueller et al. Citation2014). In this study, it was found that allocating cropland layout has a non-negligible role in diluting the PM2.5, as the fertilizer released from the soil can be transformed into a precursor of PM2.5 (Han et al. Citation2015b). Consistent with the conclusion that even small fertilizer emission decreases can have a strong and absolute impact on PM2.5 reduction in East Asia (Pozzer et al. Citation2017), we have further identified the specific impacts across multiple city levels. In addition to the model mainly addressing fertilizer emission, which reported that East Asia would benefit from a large relative change, reducing the number of deaths by ∼8% (Pozzer et al. Citation2017), it is suggested that taking the spatial configuration of cropland into consideration would further reduce the ambient pollution concentration and the mortality attributable to air pollution. It is of interest to see that the proportion of cropland increases with the city level (Table A.1), which will sound alarm bells for the different city groups in China, rather than only the small and other cities. Thus, agricultural industrialization, efficient agriculture waste management, slashing fertilizer losses to the environment, and keeping compactness and avoiding connectivity and sprawl in the spatial allocation of cropland are noteworthy suggestions for urban planning. Furthermore, it is of interest to see the limited but negative function of grassland aggregation on urban PM2.5 pollution, despite the negligible effect on dry deposition (Chen et al. Citation2016). Therefore, it is suggested that the design of green spaces in the urban environment should also consider this issue.
Limited data availability and incomplete integration of landscape-related causes have hampered the understanding of the associations with PM2.5 pollution in China. The high-resolution remote sensing data used in this study strengthen the statistical power in analyzing the PM2.5 at the city scale, as the results we captured are based on a cross-sectional analysis by the use of the most recent empirical evidence. It is also noted that the current high spatial density of ground pollution monitoring stations can support studies at the city level. The ubiquity of air pollution during China’s urbanization highlights the enormous challenges involved in achieving continued socio-economic growth without environmental degradation. To date, the focus in the discussions of the impact of air pollution has been on anthropogenic aspects. Future actions should be aimed at sustainable development with mitigated PM2.5 pollution.
5. Conclusion
China, the world’s second-largest economy and the most populous nation, which is experiencing an unprecedented urbanization rate, is among the countries with the most severe ambient PM2.5 pollution. In this study, we utilized a unique and high-resolution geo-spatial dataset to fully investigate the interactions at the city level. Based on the stratified statistical analysis of all the second-level administrative cities in the Chinese mainland, we found that: 1) During the last two years, more than 90% of the cities did not reach the annual Grade II standard of the NAAQS of China. Among these cities, there were 158.6 ± 74.2 days where AMC-PM2.5 exceeded the daily Grade II standard of the NAAQS of China. As stratified by urban population size, the large cities suffered from the most severe PM2.5 pollution, while the other cities and the small cites suffered from less PM2.5 exposure. 2) Comparing PWC-PM2.5 with AMC-PM2.5 in each city group, it can be seen that the densely populated areas suffer from more severe air pollution. Thus, it can be stated that urban residents, who are not only the victims of PM2.5 pollution but also the source of the pollutant, have a great effect on urban PM2.5 concentration. 3) Agricultural activity is a major contributor of PM2.5 pollution, which is severe in the small and other cities. The ubiquity of air pollution during China’s urbanization highlights the enormous challenges involved in achieving continued socio-economic growth without environmental degradation. It is therefore of great significance to analyze the urban landscape relationship with PM2.5 in present-day China and provide suggestions for urban planning.
Supplementary_Material
Download MS Word (24.9 KB)Acknowledgement
The authors would like to thank the handling editor and anonymous reviewers for their careful reading and helpful remarks.
Disclosure statement
No potential conflict of interest was reported by the authors.
Additional information
Funding
Related Research Data
References
- Broman, Karl W., and Terence P. Speed. 2002. “A Model Selection Approach for the Identification of Quantitative Trait Loci in Experimental Crosses.” Journal of the Royal Statistical Society: Series B (Statistical Methodology) 64 (4): 641–656. doi:10.1111/1467-9868.00354.
- Burnham, K. P., and D. R. Anderson. 2002. Model Selection and Multimodel Inference. New York, NY: Springer.
- Chen, L., C. Liu, R. Zou, M. Yang, and Z. Zhang. 2016. “Experimental Examination of Effectiveness of Vegetation as bio-Filter of Particulate Matters in the Urban Environment.” Environmental Pollution 208: 198–208. doi: 10.1016/j.envpol.2015.09.006
- Chinese Ministry of Environmental Protection. 2011. “Technical Guideline On Environmental Monitoring Quality Management (HJ 630–2011).” Accessed 2 January 2017. http://kjs.mep.gov.cn/hjbhbz/bzwb/other/qt/201109/W020120130585014685198.pdf
- Chinese Ministry of Environmental Protection. 2012. “Ambient Air Quality Standards (GB 3095 2012).” Accessed 2 January 2017. http://kjs.mep.gov.cn/hjbhbz/bzwb/dqhjbh/dqhjzlbz/201203/W020120410330232398521.pdf
- Clark, Lara P., Dylan B Millet, and Julian D Marshall. 2011. “Air Quality and Urban Form in U.S. Urban Areas: Evidence From Regulatory Monitors.” Environmental Science & Technology 45 (16): 7028–7035. doi: 10.1021/es2006786
- Fan, Shuxin, Xiaopeng Li, Jing Han, Yu Cao, and Li Dong. 2017. “Field Assessment of the Impacts of Landscape Structure on Different-Sized Airborne Particles in Residential Areas of Beijing, China.” Atmospheric Environment 166 (Supplement C): 192–203. doi:10.1016/j.atmosenv.2017.07.026.
- Feng, Huihui, Bin Zou, and Yumeng Tang. 2017. “Scale- and Region-Dependence in Landscape-PM2.5 Correlation: Implications for Urban Planning.” Remote Sensing 9 (9): 918. doi:10.3390/rs9090918.
- Food and Agricultural Organization of the United Nations. 2016. “Agriculture Organization of the United Nations Statistics Division (2014).” Production Available in: http://faostat3.fao.org/browse/Q/QC/S [Review date: April 2015].
- Fu, Jingying, Dong Jiang, and Yaohuan Huang. 2014. “China Grid Population Distribution Data set (PopulationGrid_China).” Global Change Science Research Data Publishing System. doi:10.3974/geodb.2014.01.06.V1.
- Han, Lijian, Weiqi Zhou, and Weifeng Li. 2015a. “City as a Major Source Area of Fine Particulate (PM2.5) in China.” Environmental Pollution 206: 183–187. doi:10.1016/j.envpol.2015.06.038.
- Han, Lijian, Weiqi Zhou, Weifeng Li, Derege T. Meshesha, Li Li, and Mingqing Zheng. 2015b. “Meteorological and Urban Landscape Factors on Severe air Pollution in Beijing.” Journal of the Air & Waste Management Association 65 (7): 782–787. doi:10.1080/10962247.2015.1007220.
- He, Chunyang, Lijian Han, and Robin Q. Zhang. 2016. “More Than 500 Million Chinese Urban Residents (14% of the Global Urban Population) are Imperiled by Fine Particulate Hazard.” Environmental Pollution 218: 558–562. doi:10.1016/j.envpol.2016.07.038.
- Hu, Jianlin, Lin Huang, Mindong Chen, Hong Liao, Hongliang Zhang, Shuxiao Wang, Qiang Zhang, and Qi Ying. 2017. “Premature Mortality Attributable to Particulate Matter in China: Source Contributions and Responses to Reductions.” Environmental Science & Technology 51 (17): 9950–9959. doi:10.1021/acs.est.7b03193.
- Larkin, Andrew, Aaron van Donkelaar, Jeffrey A Geddes, Randall V Martin, and Perry Hystad. 2016. “Relationships Between Changes in Urban Characteristics and Air Quality in East Asia From 2000 to 2010.” Environmental Science & Technology 50 (17): 9142–9149. doi: 10.1021/acs.est.6b02549
- Li, Guangdong, Chuanglin Fang, Shaojian Wang, and Siao Sun. 2016. “The Effect of Economic Growth, Urbanization, and Industrialization on Fine Particulate Matter (PM2.5) Concentrations in China.” Environmental Science & Technology 50 (21): 11452–9. doi:10.1021/acs.est.6b02562.
- Liu, Jiyuan, Wenhui Kuang, Zengxiang Zhang, Xinliang Xu, Yuanwei Qin, Jia Ning, Wancun Zhou, et al. 2014. “Spatiotemporal Characteristics, Patterns, and Causes of Land-use Changes in China Since the Late 1980s.” Journal of Geographical Sciences 24 (2): 195–210. doi:10.1007/s11442-014-1082-6.
- Marchand, K., and M. Siegel. 2015. “Migrants and Cities: New Partnerships to Manage Mobility.” World Migration Report.
- McCarty, Joshua, and Nikhil Kaza. 2015. “Urban Form and air Quality in the United States.” Landscape and Urban Planning 139: 168–179. doi:10.1016/j.landurbplan.2015.03.008.
- McGarigal, Kevin, Sam A Cushman, Maile C Neel, and Eduard Ene. 2002. “FRAGSTATS: spatial pattern analysis program for categorical maps.”
- Mueller, Nathaniel D., Paul C. West, James S. Gerber, Graham K. Macdonald, Stephen Polasky, and Jonathan A. Foley. 2014. “A Tradeoff Frontier for Global Nitrogen Use and Cereal Production.” Environmental Research Letters 9 (5): 054002. doi: 10.1088/1748-9326/9/5/054002
- Pozzer, Andrea, Alexandra P. Tsimpidi, Vlassis A. Karydis, Alexander De Meij, and Jos Lelieveld. 2017. “Impact of Agricultural Emission Reductions on Fine-Particulate Matter and Public Health.” Atmospheric Chemistry and Physics 17 (20): 12813–12826. doi: 10.5194/acp-17-12813-2017
- Shen, Huizhong, Shu Tao, Yilin Chen, Philippe Ciais, Burak Güneralp, Muye Ru, Qirui Zhong, Xiao Yun, Xi Zhu, and Tianbo Huang. 2017. “Urbanization-induced Population Migration has Reduced Ambient PM2.5 Concentrations in China.” Science Advances 3 (7): 1–13. doi: 10.1126/sciadv.1700300
- Song, Congbo, Jianjun He, Lin Wu, Taosheng Jin, Xi Chen, Ruipeng Li, Peipei Ren, Li Zhang, and Hongjun Mao. 2017. “Health Burden Attributable to Ambient PM2.5 in China.” Environmental Pollution 223: 575–586. doi: 10.1016/j.envpol.2017.01.060
- United Nations. 2012. World Urbanization Prospects: the 2012 Revision. New York: United Nations.
- Wang, Li, Yonghua Li BingganWei, Hairong Li, Fengying Zhang, Mark Rosenberg, Linsheng Yang, Jixia Huang, Thomas Krafft, and Wuyi Wang. 2014. “A Study of air Pollutants Influencing Life Expectancy and Longevity From Spatial Perspective in China.” Science of The Total Environment 487: 57–64. doi:10.1016/j.scitotenv.2014.03.142.
- Wang, Shaojian, Chunshan Zhou, Zhenbo Wang, Kuishuang Feng, and Klaus Hubacek. 2017. “The Characteristics and Drivers of Fine Particulate Matter (PM2.5) Distribution in China.” Journal of Cleaner Production 142 (Part 4): 1800–1809. doi:10.1016/j.jclepro.2016.11.104.
- Xu, Gang, Limin Jiao, Suli Zhao, Man Yuan, Xiaoming Li, Yuyao Han, Boen Zhang, and Ting Dong. 2016. “Examining the Impacts of Land Use on Air Quality From a Spatio-Temporal Perspective in Wuhan, China.” Atmosphere 7 (5): 62. doi: 10.3390/atmos7050062
- Zeng, Yi, Danan Gu, Jama Purser, Helen Hoenig, and Nicholas Christakis. 2010. “Associations of Environmental Factors with Elderly Health and Mortality in China.” American Journal of Public Health 100 (2): 298–305. doi: 10.2105/AJPH.2008.154971
- Zhang, Yan-Lin, and Fang Cao. 2015. “Fine Particulate Matter (PM(2.5)) in China at a City Level.” Scientific Reports 5: 14884. doi:10.1038/srep14884.
- Zhang, Libo, Yongqiang Liu, and Lu Hao. 2016. “Contributions of Open Crop Straw Burning Emissions to PM 2.5 Concentrations in China.” Environmental Research Letters 11 (1): 014014. doi: 10.1088/1748-9326/11/1/014014
- Zhang, Renyi, Gehui Wang, Song Guo, Misti L. Zamora, Qi Ying, Yun Lin, Weigang Wang, Min Hu, and Yuan Wang. 2015. “Formation of Urban Fine Particulate Matter.” Chemical Reviews 115 (10): 3803–3855. doi:10.1021/acs.chemrev.5b00067.
- Zhou, Jiang, Kazuhiko Ito, Ramona Lall, Morton Lippmann, and George Thurston. 2011. “Time-series Analysis of Mortality Effects of Fine Particulate Matter Components in Detroit and Seattle.” Environmental Health Perspectives 461: 466.
- Zhou, Decheng, Shuqing Zhao, Shuguang Liu, and Liangxia Zhang. 2014. “Spatiotemporal Trends of Terrestrial Vegetation Activity Along the Urban Development Intensity Gradient in China’s 32 Major Cities.” Science of the Total Environment 488–489: 136–145. doi: 10.1016/j.scitotenv.2014.04.080