
 ?Mathematical formulae have been encoded as MathML and are displayed in this HTML version using MathJax in order to improve their display. Uncheck the box to turn MathJax off. This feature requires Javascript. Click on a formula to zoom.
ABSTRACT
Social media, including Twitter, has become an important source for disaster response. Yet most studies focus on a very limited amount of geotagged data (approximately 1% of all tweets) while discarding a rich body of data that contains location expressions in text. Location information is crucial to understanding the impact of disasters, including where damage has occurred and where the people who need help are situated. In this paper, we propose a novel two-stage machine learning- and deep learning-based framework for power outage detection from Twitter. First, we apply a probabilistic classification model using bag-of-ngrams features to find true power outage tweets. Second, we implement a new deep learning method–bidirectional long short-term memory networks–to extract outage locations from text. Results show a promising classification accuracy (86%) in identifying true power outage tweets, and approximately 20 times more usable tweets can be located compared with simply relying on geotagged tweets. The method of identifying location names used in this paper does not require language- or domain-specific external resources such as gazetteers or handcrafted features, so it can be extended to other situational awareness analyzes and new applications.
1. Introduction
Power outages cause tremendous economic loss and threaten people's health during disasters. In 2012 Hurricane Sandy caused 8.5 million power outages, leading to $35 billion in damages; many victims waited more than 2 weeks for power to be restored (http://www.pennlive.com/midstate/index.ssf/2012/11/restoring_power_to_hurricane_s.html). Restoration was slow not only due to the large-scale and severe damages caused by the hurricane, but also because utility companies experienced significant delays in gathering efficient power outage information and allocating their limited power resources (Lee, Shin, and Zadeh Citation2013). Timely power outage detection is critical for utility companies and emergency responders to ensure efficient power restoration. Companies rely almost exclusively on customers to report electricity failures, and restoration is verified by checking back in with reporting customers or dispatching a field crew to the site. This traditional method is ineffective, especially during times of massive outages. In contrast to telephone calls, advanced metering infrastructure (AMI) technology enables utilities to monitor power outages more precisely and restore power more quickly. Existing AMI methodologies involve detecting power outages based on data generated by smart meters, which measure and record customers' real-time electricity usage (Chen et al. Citation2015; Liu and Schulz Citation2002). For example, an outage would be detected when a smart meter stopped recording usage, and the utility company would be automatically alerted. Chai et al. (Citation2016) developed the frequency monitoring network, GridEye, based on frequency disturbance recorder sensors that monitor the stability of grid networks. Despite the accuracy of electronic sensors, large-scale AMI deployments are expensive and lengthy. According to the IEI report (Electric Company Smart Meter Deployments: Foundation for A Smart Grid, October 2016), only 30 utility companies in the United States (out of thousands) have fully deployed smart meters.
Unlike expensive and proprietary physical sensors, social sensors (i.e. social media) are free and in the public domain. Sakaki, Okazaki, and Matsuo (Citation2010) compare Twitter users to social sensors and tweets to sensory information. Takeichi et al. (Citation2014) further state that Twitter often behaves like a social sensor in which users actively sense real-world events and spontaneously mention these events in cyberspace. The data generated by millions of social sensors are user-created content or volunteered geographic information (VGI) (Goodchild Citation2007). Social media, as an important channel for VGI information, has emerged as an efficient two-way communication medium through which utility companies can share information related to outages with their customers and customers can report outages. During a disaster and its aftermath, social media are widely used to spread important information. Twitter operates as a real-time, public microblogging network with more than 300 million active monthly users. Hence, it has become an ideal data source for monitoring and accessing the extent of disasters (Huang and Xiao Citation2015). For example, Twitter has been used to detect events such as earthquakes (Sakaki, Okazaki, and Matsuo Citation2010), wildfires (Boulton, Shotton, and Williams Citation2016), and power outages (Boulton, Shotton, and Williams Citation2016; Sun et al. Citation2016). However, most existing work focuses on geotagged data (i.e. known latitude/longitude coordinates); unfortunately, this body of data represents only about 1% of all tweets (Middleton, Middleton, and Modafferi Citation2014). Even though less than 0.5% of Twitter users turn on the geotagging feature in tweets due to privacy concerns (Li, Wang, and Chang Citation2012), they may still mention location information in their tweet content. Location information could be harvested from millions of additional tweets using location detection technologies.
Location detection can be considered as a subtask of named entity recognition (NER). One of the most fundamental tasks in information extraction, NER aims to classify words within text into different categories (e.g. person, organization, and location). The conditional random field (CRF) has served as the dominant machine learning method for NER, with well-known Stanford NER model developed at Stanford University (Finkel, Grenager, and Manning Citation2005). The original Stanford NER tool is trained on formal texts such as news data, which are remarkably different from short, informal, and noisy Twitter data. Hence, applying an NER model that focuses on complex data can generate poor performance in analyzing tweets. Lingad, Karimi, and Yin (Citation2013) showed that NER tools retrained on Twitter data can significantly boost location detection from tweets. In contrast to existing methods, deep learning methods–specifically, recurrent neural networks (RNNs) and convolutional neural networks–are usually trained in an end-to-end fashion, significantly reducing dependency on hand-engineered features. In this paper, different NER models are applied to tweets regarding power outages and compared for location detection. Models include the original Stanford NER, retrained Stanford NER with tweets, and a deep learning RNN (i.e. bidirectional long short-term memory (LSTM) networks.
This paper most notably presents a machine learning- and deep learning-based framework for mapping power outages using Twitter data that has not been geotagged. A deep learning method is applied to enhance location detection from tweets. Because geotagged tweets are scarce, we use public address data to augment the limited training data set, a method that improves location detection. Our method significantly increases the availability of location-based tweets, enabling power outage monitoring on a much larger scale. The advanced natural language processing (NLP) techniques and deep learning methods used in this study may also improve future location-based social media studies of many kinds.
2. Literature review
The method of harvesting location information from tweets is related to work on geoparsing (Jones and Purves Citation2009). Geoparsing allows a researcher to convert place names and qualitative details in text into specific spatial references such as latitude and longitude coordinates. Given the massive amount of data available, it is important to develop efficient and accurate methods to automatically identify various types of geographic information. Place names include geopolitical entities and administrative divisions (e.g. country, city names), street names, buildings, and points of interest (POI) (e.g. hotels, restaurants, parks); and colloquial place names. Identifying vernacular descriptions of locations becomes an especially important task considering the amount and value of VGI information (Hu, Mao, and McKenzie Citation2018). Geoparsing methods can be generally classified into three categories: (1) gazetteer matching (i.e. a dictionary of place names is used to match location names in text), (2) linguistic pattern and semantic rules matching, and (3) machine learning methods. Also, hybrid methods are often used (Gelernter and Shilpa Citation2013). Detailed discussions of geoparsing methods and challenges are provided in Leidner and Lieberman (Citation2011) and Monteiro, Davis Jr, and Fonseca (Citation2016).
This paper focuses on location extraction from short text (i.e. tweets). Due to the brevity, lack of structure, and commonly use of abbreviations, and prevalence of misspellings, machine-based recognition of geographic information in tweets is a difficult task. Kinsella, Murdock, and O'Hare (Citation2011) used coordinates extracted from geotagged tweets to create a language model that infers the location of the tweet based on the term distribution within geotagged tweets. Gelernter and Mushegian (Citation2011) applied Stanford NER software, based on a CRF model to recognize place names in tweets. However, because the standard NER model uses formal text such as news data, it cannot recognize locations that are noncapitalized, abbreviated, misspelled, or colloquial (Gelernter and Mushegian Citation2011). To improve the out-of-the-box Stanford NER, Lingad, Karimi, and Yin (Citation2013) retrained the NER model using labeled tweets, where location names are manually annotated. Results have shown a significant improvement in detecting location information in tweets, including the names of POIs such as hotels, restaurants, and malls. Malmasi and Dras (Citation2015) reported the best result in the ALTA 2014 Twitter Location Detection competition task (Molla and Karimi Citation2014), but their method relied heavily on a mix of NLP tools (i.e. noun phrase parser), gazetteers, and manually defined rules, which cannot be easily scaled to other data sets.
In recent years, deep learning methods have been used successfully in computer vision applications including image recognition and object detection (LeCun, Bengio, and Hinton Citation2015). Deep learning methods have significantly reduced dependency on hand-engineered features for linguistic pattern and semantic analysis. Collobert et al. (Citation2011) introduced the first deep learning method for NER; it is a simple but effective feed-forward neutral network containing only one convolution layer. This model, however, is restricted to a fixed window size (e.g. three to five words in close proximity) but disregards ‘long-distance’ relationships between words in a sentence. In contrast, RNNs, in particular, LSTM networks (Hochreiter and Schmidhuber Citation1997), can take into account an infinite amount of context for a word to predict the current output through purpose-built memory cells. While the networks consider word- and sentence-level information to predict the named entities independently, they discard dependencies across sentence-level tags. To further improve NER performance, a CRF layer, which can model a sequence of labels by considering neighbors' labels, is usually added to further process network outputs to find the best sequence of labels (Huang, Xu, and Yu Citation2015; Lample et al. Citation2016). In this paper, we adopt the bidirectional LSTM model with a CRF layer to identify location names from tweets.
3. Methodology and results
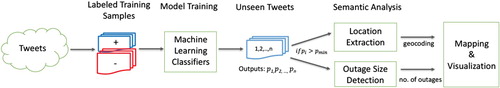
shows the framework of our methodology. First, we classified tweets into true and false power outage tweets. Second, tweets with a high probability were considered true power outage reports for the purposes of this research and passed to the second step for location detection. If the number of power outages for the event was mentioned in tweets, we extracted that information based on regular expression patterns.
Figure 1. The proposed framework of power outage classification and location detection.
3.1. Data collection and preprocessing
We used Twitter Streaming API to collect tweets containing at least one of the following keywords: ‘power outage’, ‘power outages’,‘power cut’, ‘power blackout’, and ‘blackout’ over the period from 3 September to 9 October 2016. We also set a geographic boundary to collect tweets posted from the United States. In total, 612,178 tweets were obtained, with non-English tweets removed. A special word tokenizer was written to split each tweet into tokens. The tokens included URLs; hashtags (i.e. a string preceded by #); user name mentions (i.e. a string preceded by @); date and time strings (e.g. 9/1/2016, 10:30 AM); numbers (e.g. 13.99, 2000); and emoticons. To reduce feature space, we standardized each tweet by transforming text into lowercase, replacing the URL with special character ‘<URL>’, and replacing mentioned usernames with ‘@username’. Emoticons were converted to Unicode strings (e.g. the term ‘smiley’ to replace smiley faces, the term ‘sad’ to replace frowny faces). With this conversion, emotions are treated the same as other normal words. Because very short tweets rarely contain useful information, we removed tweets containing less than three words.
3.2. Machine learning classification of power outage tweets
To train the classifiers, we manually labeled positive and negative tweets, and duplicate tweets were removed. In order to avoid overlap with testing data, training data is randomly selected from a different time period, i.e. from November 2016 to February 2017. We defined positive tweets as reporting an actual power outage event and negative as not about a real power outage or otherwise being irrelevant (see examples in ). Positive tweets clearly stated a power outage event and usually contained location, number of outages, and expressions of sad emotion. Conversely, even though all the negative tweets included power outage-related keywords, they were not actually discussing a real power outage. For example, alternate meanings for the term ‘power’ sometimes caused a false positive tweet to enter the data pool. See the sixth example given in : ‘@realDonaldTrump I would like to c u cut government in half and give states the power back’, in which ‘power’ refers political power rather than electricity.
Table 1. Positive and negative power outage tweet examples.
Three annotators manually labeled a random sample of 2355 positive and 2355 negative tweets. Classification results were compared based on k-fold cross-validation; here, we set k = 5. We randomly split the data set into five equally sized samples (i.e. 20% each) and left one sample as test data and the other k − 1 folds of datasets for training. k iterations need to be conducted, and then the performance is the average of the values computed in the loop.
compares classification results across multiple machine learning models, including logistic regression, multinomial and Bernoulli naive bayes, and linear support vector classification (SVC) (i.e. a linear support vector machine for classification). These classifiers are implemented by Python scikit-learn libraries, where the default parameter settings are adopted (parameter updates do not show a significant change in classification performance). For each model, we compared different feature sets including (1) features generated by the bag-of-words model (i.e. individual word of the data set) weighted by the term frequency and term-frequency inverse-document-frequency (TFIDF) (Sparck Jones Citation1972), and (2) features generated by the bag-of-ngrams model weighted by TFIDF. TFIDF measures the importance of a term (t) to a document (d) in a collection of documents (D), which is calculated by , where
is the occurrence frequency of t in d and
is the logarithm of the inverse of the division between the number of documents containing t and the total number of documents in D. TFIDF of ngrams is generated by the bag-of-ngrams model, where ngrams is a contiguous sequence of n words. Specifically, we used a combinations of unigrams (i.e. a single word) and bigrams (i.e. two consequent words). We also added trigrams (i.e. three words) as features, but performance did not improve. Results were evaluated in terms of four metrics: precision, recall, F-score, and accuracy, calculated as shown below.
(1)
(1) where tp represents true positive, tn represents true negative, fp represents false positive, and fn represents false negative. The set of tweets labeled as true power outages and also are correctly detected by our method constitutes true positive data. The set of true power outage tweets that were misclassified as negative constitutes true negative data. The set of true power outage tweets missed by our method constitutes false negative. The set of false power outage data misclassified as true power outage tweets (i.e. false alarms) constitutes false positive data. According to the definition in Equation Equation1
(1)
(1) , precision measures the fraction of relevant tweets from all the tweets identified as relevant, while recall is the fraction of relevant tweets within all the actual relevant documents. The precision decreases or increases as the recall increases or decreases. F-score is a weighted average of the precision and recall, which we use to compare the performance of various machine learning classifiers.
Table 2. Comparison of machine learning classifiers on power outage tweet classification.
As shown in , all the models tested generate promising results, with a F-score of higher than 0.8. Among all the classifiers (i.e. logistic regression, naive bayes, and SVC), using tfidf-ngram features give better results than tf- and tfidf-unigram (i.e. bag-of-words) features. It can be because adding bigrams is useful in identifying more informative phrases (such as ‘outage in’, ‘outage at’, ‘internet outage’) than single word for classification. With the same tfidf-ngram features, classifiers perform almost equally well in terms of F-score and accuracy. In this study, we adopted the SVC-tfidf-ngram model for the classification of large-scale power outage tweets, which uses a linear L2-squared hinge loss function and a penalty parameter of C = 1.0.
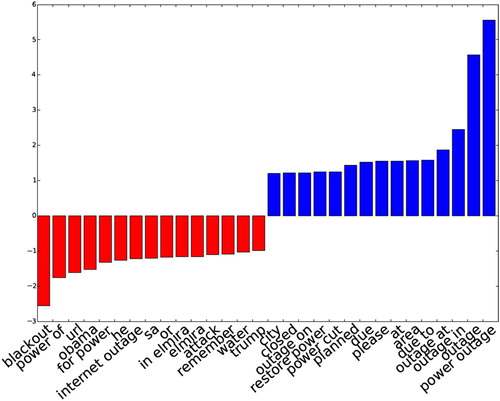
plots the top most informative positive and negative features. Location related features such as ‘outage in’, ‘outage at’, ‘at’, ‘in’, ‘area’, and other words such as ‘due to’, ‘please’, and ‘closed’ are important positive features, while ‘blackout’ (because it often co-occurs with the word ‘drunk’), ‘obama’, ‘internet outage’ are negative features.
Figure 2. Top positive and negative features for power outage classification using the SVC and bag-of-ngram model.
In practice, not only do we want to know if a tweet is actually about a power outage, but we also want to know the confidence score on the prediction. To obtain the confidence score, we performed probability calibration for the SVM outputs based on Platt's sigmoid model (Platt Citation1999), as shown in Equation (Equation2(2)
(2) ).
(2)
(2) where x is the input and
is the output of the classifier. A and B are parameters learned by the algorithm. Briefly speaking, Platt scaling fits a logistic regression model to classifier outputs and produces probability estimates (from 0 to 1). Classification results have shown that, among the set of 621,544 tweets containing power outage-related keywords, 90,060 (14%) tweets had a probability
, which we consider positive tweets. Among the set of positive tweets, the percentage of tweets with
is 85% (76,588);
, 73% (65,667);
, 55,234 (61%);
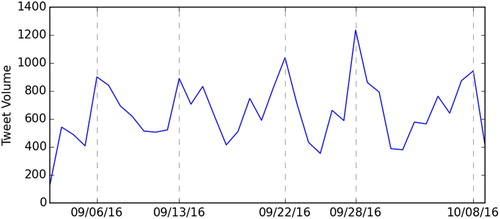
, 40,316 (45%). shows the number of power outage tweets with a probability of
over the study period. Spikes of outage tweets can clearly be seen across two hurricanes–Hermine (28 August to 8 September 2016) and Matthew (28 September to 10 October 2016)–and on September 13, when there were major power outages in north New Jersey (including the Newark Airport), as well as on 22 September 2016, when a fire at a Puerto Rico power plant caused utility failure.
Figure 3. Daily power outage tweet volume (6 September to 8 October 2016).
3.3. Location extraction
After identifying the set of true power outage tweets, we identified and mapped outage locations. As stated earlier, location detection can be considered an NER subtask. We compared several NER models for their usefulness in performing location detection in tweets: the original Stanford NER, Stanford NER retrained with tweets, and a deep learning neural network model.
3.3.1. Stanford NER: conditional random field classifier
Stanford's NER (https://nlp.stanford.edu/software/CRF-NER.shtml), a cutting-edge NER tool, uses CRF and distributional similarity-based features to improve NER (Finkel, Grenager, and Manning Citation2005). CRF is a conditional sequence model: Given a sequence of observations (e.g. words), it aims to find the highest possible sequence of states (e.g. named entity tags). The entity tag for each word in a sentence is predicted, not independently, but by considering the tags of neighboring words. For this research, we examined two versions of CRF models: the original Stanford NER that is pretrained based on news and Wikipedia data, and the retrained model based on the annotated Twitter data. The features that we adopt to train CRF models include current word, previous word, next word, part-of-speech (POS) tag of current word, surrounding-sequence POS tag, word shape features, character n-gram, and left and right words within the window size of 6 words.
3.3.2. Deep learning method: bidirectional LSTM
LSTM can be used to model sequential data. Given an input vector , it returns another sequence vector
, where
is a state corresponding to
at time step t. The key component of LSTMs is the memory cell, which contains several ‘forget gates’ that can control the amount of information flow into or out of their memory (Hochreiter and Schmidhuber Citation1997). This design allows LSTM to account for long-distance dependencies, while the traditional RNNs tend to be biased toward the most recent inputs in the sequence (Bengio, Simard, and Frasconi Citation1994). To understand a unit in a sequence, considering both the left- and right-hand sides are useful. To model the left (or right) context of a word
in a sentence, a forward (or backward) LSTM model can be used. The bidirectional LSTM model proposed in (Graves and Schmidhuber Citation2005) combines the forward and backward LSTMs, offering advantages compared to the single-direction methodologies. In the NER problem, bidirectional LSTM networks allow the model to take into account a long-range context on both left- and right-hand sides of a word. shows the network architecture of this deep learning method, which includes a word and character embedding layer, bi-LSTM (followed by a linear and softmax layer), and a CRF layer that optimizes sequence labeling at the end.
Figure 4. The network architecture of bi-LSTM-CRF for location detection.
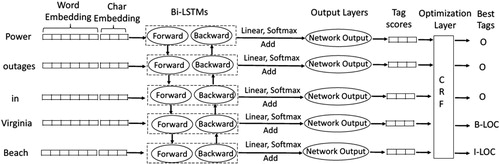
First, the embedding layer transforms discrete features into a continuous vector representation that combines both word- and character-based embeddings. Here, the discrete features are word and character indices: Word index is the word ID in the vocabulary, and character index is the ID in a unique character set, including abcdefghijklmnopqrstuvwxyz0123456789- ![]() . Real-valued word embeddings learned by neural language models have been shown to successfully capture syntactic and semantic information about words, which has significantly improved the performance of a variety of NLP tasks such as syntactic parsing, NER, and sentiment analysis (Collobert et al. Citation2011; Lample et al. Citation2016). The word embeddings adopted in this paper are pretrained using an unsupervised learning algorithm, GloVe, which aims to learn vector representations for words based on aggregated global word-word co-occurrence statistics from a corpus (see (Pennington, Socher, and Manning Citation2014) for details on the model and training process). The word-embedding dimension we use is 100; it can be downloaded from https://nlp.stanford.edu/projects/glove/. While word embedding represents what a term means, character-level embedding captures information about word morphology and shape (i.e. what the word looks like) (Santos and Zadrozny Citation2014). Character embeddings along 25 dimensions were randomly initialized in this task. Then, each word,
. Real-valued word embeddings learned by neural language models have been shown to successfully capture syntactic and semantic information about words, which has significantly improved the performance of a variety of NLP tasks such as syntactic parsing, NER, and sentiment analysis (Collobert et al. Citation2011; Lample et al. Citation2016). The word embeddings adopted in this paper are pretrained using an unsupervised learning algorithm, GloVe, which aims to learn vector representations for words based on aggregated global word-word co-occurrence statistics from a corpus (see (Pennington, Socher, and Manning Citation2014) for details on the model and training process). The word-embedding dimension we use is 100; it can be downloaded from https://nlp.stanford.edu/projects/glove/. While word embedding represents what a term means, character-level embedding captures information about word morphology and shape (i.e. what the word looks like) (Santos and Zadrozny Citation2014). Character embeddings along 25 dimensions were randomly initialized in this task. Then, each word, , in a sentence was converted into a vector
to concatenate the word– and character-level embeddings.
Second, a sequence of word vector representations obtained from the embedding layers was given to a bidirectional LSTM. The output of each network at each time step was decoded by a linear layer and a log-softmax layer into log probabilities for each tag category. These two vectors were then added together to produce the final output of the network: a sequence of vectors containing the probability of each named entity label for each corresponding token. Third, the sequence of probability vectors from the previous output layer was given to the final sequence optimization layer, CRF, to identify the best sequence of predicted named entity labels for the whole sequence.
From the first to the final layers, word features were transformed into named entity tag scores. The parameters of all layers were learned during the training process. Our model is trained based on a back-propagation algorithm using stochastic gradient descent with a learning rate of 0.005. The dropout rate was 0.5 (i.e. the smaller dropout rate led to longer training time and higher rates reduced performance). Our implementation of this bidirectional LSTM and CRF architecture was based on a cutting-edge deep learning NER system, NeuroNER (Dernoncourt, Lee, and Szolovits Citation2017) developed by MIT. Unlike the traditional machine learning classifiers, deep learning method can effectively learn features directly from training data instead of relying on handcrafted features.
3.3.3. NER model comparisons
The location-annotated Twitter data we used for our research was provided by the ALTA 2014 Twitter Location Detection competition (Molla and Karimi Citation2014). The original training and testing sets included 2000 and 1000 tweet IDs, respectively. Some tweets were deleted or became invalid, making our data set 1851 for training and 930 tweets for testing. The training data was randomly split into two subsets: 1600 for training and 251 for validation. The training set is used to train the neural network parameters, and the validation set is used to determine when to stop training. Annotated locations included place names and POIs, in either main text strings or hashtags.
The named entity tags were encoded with the standard Beginning/Inside/Outside (BIO) format, where B- represents the beginning of a named entity, I- indicates the token is inside an entity but is not the first word, and O- is used for tokens outside of an entity. provides an example of a BIO-encoded sentence.
Table 3. Example of sentence encoded with BIO tagging scheme.
shows the NER test results based on four models: (1) the original Stanford NER, (2) the Stanford NER model retrained with location-annotated Twitter data, (3) the winner of the ALTA 2014 task, and (4) NeuroNER. The original Stanford NER model generated high precision (0.9451) but very low recall (0.3207). It can identify formal location names (e.g. city and county names) but fails to recognize street names, zip code, city or place name abbreviations, and location hashtags. Retraining Stanford NER with location-annotated tweets can significantly boost its recall and improve the F-score to 0.7728. The method used by Malmasi and Dras (Citation2015) for the ALTA 2014 competition task relied heavily on a mix of NLP tools (i.e. noun phrase extraction), gazetteers, and manually defined rules, which cannot be easily scaled to other datasets. In contrast, the deep learning bidirectional LSTM-CRF model outperforms all other methods in terms of F-score (0.8094) without using any manually defined features, rules, or gazetteers. This method generalizes to different languages and new data and domains. Therefore, in the following session, we utilized the deep learning model to detect location names from tweets.
Table 4. Model comparisons: location detection results on the ALTA 2014 datasets.
3.3.4. Applying NER model for location detection in power outage tweets
Our starting data set of 1600 tweets included a very limited amount of labeled data. To increase the number of training samples, we leveraged the open data source OpenAddresses (OA) (https://openaddresses.io/), a VGI project integrating address data contributed by worldwide volunteers. We considered the street names to be true samples of location names. We collected 8,107 unique street addresses in New York City as training data, 1673 addresses in Rochester, New York, as validation data, and 772 addresses in Cambridge, MA, as testing data. We took steps to ensure minimal overlap between the training and test data; only one address appears both in training and test data sets. lists the data sets used to train, validate, and test NeuroNER for location detection. To test whether the addition of street address as training data can improve location recognition, we compared two models: the first with ALTA Twitter data as training data only, and the second with both ALTA and street address data as training data. Results in show that adding street addresses for training improved the F-score from 0.81 to 0.85. Therefore, in the following, we used the deep learning model trained using a combination of ALTA data and street addresses to detect power outage locations in tweets.
Table 5. Datasets used for training, validating, and testing the location detection model.
Table 6. Location detection using the bidirectional LSTM-CRF model with different training datasets.
As discussed in Section 3.2, 40,316 power outage tweets in the data set had a classification probability of . We then applied our location detection method on these strongly positive power outage tweets. Here, we must clarify two terms: ‘geotagged’ and ‘geodetected’. Tweets with known coordinates are geotagged data, and tweets for which a location could be detected from text by our method are geodetected data. shows that, of all the positive power outage tweets, only 1386 (3.44%) were geotagged tweets, while 28,825 (71.5%) were geodetected, after applying our location detection method. In other words, nearly 20 times more geodetected tweets are available compared to geotagged data. Our location detection method will enrich the pool of geographic data available for mapping large-scale power outages. shows examples of location strings detected power outage tweets. As we can see the location strings identified are different types including state/county/city names, streets, place/area names, and zipcode, expressed either in text strings or hashtags.
Table 7. Number of geotagged and geodetected tweets among 40,316 power outage tweets with  .
.
Table 8. Examples of locations detected from tweets by using bidirectional LSTM-CRF.
After locations were detected, we geoparsed unstructured location information into geographical coordinates. Bing Maps Location API was used via Python's geocoding library (i.e. geopy), which accepts a location string as the input and generates address name and latitude/longitude coordinates. For example, Battleship Road extracted from a tweet is converted to (Battleship Rd, Camden, SC 29020, United States, ). We acknowledge the limitation of Bing Maps API for geocoding ambiguous place names (e.g. location names that exist in multiple regions). So, when multiple results are returned, the most likely one is selected in our results. With the coordinates obtained, we then mapped power outage locations.
As shown in Section 3.2, results include 40,316 positive power outage tweets with a classification probability of , and among which, 71.5% of the data is geodetected. Because there are too many points to visualize in one graph, we only selected a small fraction of data for a better visualization. Here, we set the classification probability filter as:
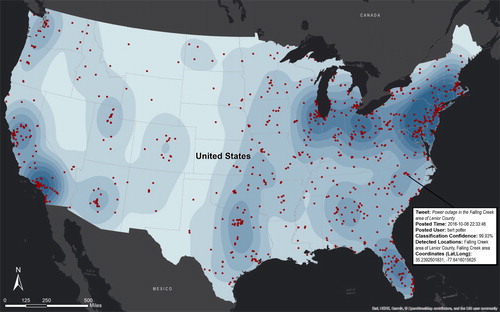
, which gives 1790 tweets, i.e. 4% of all the 40,316 positive power outage tweets. shows the selected small subset of all the geodetected power outage tweets obtained in Section 3.3.4. Each pinpoint represents a power outage tweet at the geodetected location, and a pop-up window shows its key attributes (e.g. tweet, time posted, user who posted the tweet, and location names detected by our method). These pieces of information enable emergency responders to better understand power outage situations.
Figure 5. Maps of selected power outage tweets across the United States ().
3.4. Outage size detection
Understanding the damage level incurred with power outage events is also important for emergency responders and utility companies. Some tweets mention how many power outages have occurred as of the time of the tweet (e.g. ‘9,200 customers have power outages, and the number is climbing’; ‘At least more than one hundred people have power outages in our neighborhood; 1000 outages in King County’) To capture such patterns, we defined linguistic rules, which can be written in regular expression patterns (e.g. numbers or digits followed by keywords such as ‘customers’, ‘people’, ‘members’, ‘outages’, ‘power cuts’) within a small window size (i.e. there words). Phrases matching such patterns were extracted and reported as the size of outages.
3.5. Validation
To validate our results, we compared the number of power outage tweets with the official number of customers without power, as reported in the National Outage Map (NOM) developed by Oak Ridge National Laboratory (ORNL) for the US Department of Energy. NOM data is available at a county level, but due to the data scarcity, we also conduct the correlation analysis based on the aggregated data at the state-level.
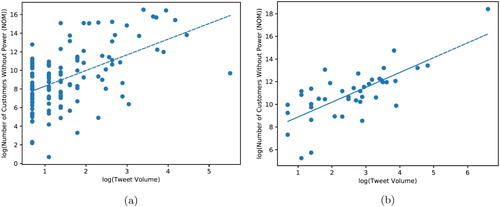
shows a strong positive linear correlation between the number of geodetected power outage tweets and the number of customers in the counties and states recorded by NOM during Matthew Hurricane. At the county-level, it shows a statistically significant correlation with a Pearson correlation coefficient (
, n = 131). At the state level, the linear correlation is stronger, with a Pearson correlation coefficient
(
). The positive correlations show the effectiveness of our method for power outage detection using social media. The number of power outages reported by NOM is collected from hundreds of utility companies’ websites. However, any change to a website's structure can reduce how effective crawling it is; this can be avoided only with consistent manual updates – a difficult and time-consuming endeavor. It should be noted that not every utility company has or actively maintains their websites, and website updates often come after a time lag. Therefore, Twitter – real-time, public, and widely used by millions – can provide a valuable data source for power outage monitoring and can complement information gathered from utility companies' websites.
Figure 6. Scatter plot of power outage tweets versus number of customers without power, as reported by National Outage Map, for the period during which Matthew Hurricane affected Florida (6–7 October 2016) at both the US county and state levels. (a) County-level. (b) State-level.
4. Conclusion
This paper provides a novel machine learning- and deep learning-based framework for locating and classifying near-real-time power outages from social media. This research is different from existing work that focuses on geotagged tweets (i.e. those with known latitude/longitude coordinates), and our work promises to enrich the data available for power outage research by enlarging the pool of available data. We are the first to use a deep learning model to identify locations associated with power outage tweets. Results have shown an improvement compared to other methods: (1) the original Stanford NER model trained on newswire text performed poorly on tweets that are full of informal languages, misspellings, abbreviations, hashtags, and unreliable capitalization and punctuation; (2) traditional rule- and machine learning-based methods rely on handcrafted features which are time-consuming to develop and may not generalize well to new corpus. In contrast, the great advantage of deep learning methods can be attributed to their effectiveness to learn useful features automatically from the training dataset. The deep learning model used in this paper, bidirectional LSTM model coupled with a CRF top layer, does not require any prior knowledge, nor a gazetteer, and it does not depend on other NLP tools for preprocessing (e.g. part-of-speech, chunking). Therefore, it can be easily adapted to new data and domains.
Detecting locations within social media text automatically and accurately help solve the problem of geotagged data scarcity and significantly adds a rich amount of geographic data that emergency responders can leverage to find people who need help. Our results show a classification accuracy of 86% and significantly increase the amount of location data from 1386 geotagged tweets to 28,825 geodetected tweets, providing about 20 times more data than geotagged only. This work highlights the value of using free and public social sensor data (i.e. Twitter) to locate areas experiencing power outages during a disaster without adding expensive communication infrastructures. This social sensor-based outage detection framework can be integrated with existing physical sensor-based monitoring systems to improve outage detection efficiency and accuracy.
In the future, we will leverage the Geographic Big Data Analytics platform, PlanetSense (Thakur et al. Citation2015) to harvest and analyze massive data from multiple social media (e.g. Twitter, Facebook, Instagram, Flicker) and news media to track the status of power outage in the US. Once fully developed, this methodology could be integrated with platforms designed to monitor near-real-time situational awareness of US energy infrastructures, such as the FNET/GridEye monitoring system (Chai et al. Citation2016) and EAGLE-I (Environment for Analysis of Geo-Located Energy Information) technology (U.S. Department of Energy Citation2015).
Acknowledgments
This manuscript has been authored by UT-Battelle, LLC under Contract No. DE-AC05-00OR22725 with the US Department of Energy. The United States Government retains and the publisher, by accepting the article for publication, acknowledges that the United States Government retains a non-exclusive, paid-up, irrevocable, worldwide license to publish or reproduce the published form of this manuscript, or allow others to do so, for United States Government purposes. The Department of Energy will provide public access to these results of federally sponsored research in accordance with the DOE Public Access Plan (http://energy.gov/downloads/doe-public-access-plan). Also, we would like to thank to Laurie Varma from ORNL for her diligent technical editing and proofreading of the manuscript.
Disclosure statement
No potential conflict of interest was reported by the authors.
ORCID
Jibonananda Sanyal http://orcid.org/0000-0002-7789-3199
Budhendra Bhaduri http://orcid.org/0000-0003-1555-1377
Additional information
Funding
References
- Bengio Y., P. Simard, and P. Frasconi. 1994. “Learning Long-Term Dependencies with Gradient Descent Is Difficult.” IEEE Transactions on Neural Networks 5 (2): 157–166. doi: 10.1109/72.279181
- Boulton C. A., H. Shotton, and H. T. Williams. 2016. “Using Social Media to Detect and Locate Wildfires.” Tenth International AAAI Conference on Web and Social Media.
- Chai J., Y. Liu, J. Guo, L. Wu, D. Zhou, W. Yao, Y. Liu, T. King, J. R. Gracia, and M. Patel. 2016. “Wide-Area Measurement Data Analytics Using FNET/GridEye: A Review.” Power Systems Computation Conference (PSCC), 2016, 1–6.
- Chen S. J., T. S. Zhan, C. H. Huang, J. L. Chen, and C. H. Lin. 2015. “Nontechnical Loss and Outage Detection Using Fractional-Order Self-Synchronization Error-Based Fuzzy Petri Nets in Micro-Distribution Systems.” IEEE Transactions on Smart Grid 6 (1): 411–420. doi: 10.1109/TSG.2014.2345780
- Collobert R., J. Weston, L. Bottou, M. Karlen, K. Kavukcuoglu, and P. Kuksa. 2011 August. Natural Language Processing (Almost) from Scratch. Journal of Machine Learning Research 12: 2493–2537.
- Dernoncourt F., J. Y. Lee, and P. Szolovits. 2017. “NeuroNER: An Easy-to-Use Program for Named-Entity Recognition Based on Neural Networks.” Proceedings of the 2017 Conference on Empirical Methods in Natural Language Processing: System Demonstrations. Copenhagen: Association for Computational Linguistics, 97–102.
- Finkel J. R., T. Grenager, and C. Manning. 2005. “Incorporating Non-Local Information into Information Extraction Systems by Gibbs Sampling.” Proceedings of the 43rd Annual Meeting on Association for Computational Linguistics, 363–370.
- Gelernter Judith, and Shilp Balaji. 2013. “An Algorithm for Local Geoparsing of Microtext.” GeoInformatica 17 (4): 635–667. doi: 10.1007/s10707-012-0173-8
- Gelernter Judith, and Nikola Mushegian. 2011. “Geo-Parsing Messages from Microtext.” Transactions in GIS 15 (6): 753–773. doi: 10.1111/j.1467-9671.2011.01294.x
- Goodchild Michael F. 2007. “Citizens as Sensors: The World of Volunteered Geography.” GeoJournal69 (4): 211–221. doi: 10.1007/s10708-007-9111-y
- Graves A., and J. Schmidhuber. 2005. “Framewise Phoneme Classification with Bidirectional LSTM Networks.” Neural Networks, 2005. Proceedings of IJCNN'05., Vol. 4, 2047–2052.
- Hochreiter S., and J. Schmidhuber. 1997. “Long Short-Term Memory.” Neural Computation, 9 (8): 1735–1780. doi: 10.1162/neco.1997.9.8.1735
- Hu Yingjie, Huin. Mao, and Gran McKenzie. 2018. “A Natural Language Processing and Geospatial Clustering Framework for Harvesting Local Place Names from Geotagged Housing Advertisements.” International Journal of Geographical Information Science 1–25.
- Huang Q., and Y. Xiao. 2015. “Geographic Situational Awareness: Mining Tweets for Disaster Preparedness, Emergency Response, Impact, and Recovery.” ISPRS International Journal of Geo-Information 4 (3): 1549–1568. doi: 10.3390/ijgi4031549
- Huang Z., W. Xu, and K. Yu. 2015. “Bidirectional Lstm-Crf Models for Sequence Tagging.” arXiv preprint arXiv:1508.01991.
- Jones Christopher B., and Ross S. Purves. 2009. “Geographical Information Retrieval.” Encyclopedia of Database Systems, 1227–1231. Springer.
- Kinsella Sheila, Vaness Murdock, and Nei O'Hare. 2011. “I'm Eating a Sandwich in Glasgow: Modeling Locations with Tweets.” Proceedings of the 3rd International Workshop on Search and Mining User-generated Contents, 61–68. ACM.
- Lample G., M. Ballesteros, S. Subramanian, K. Kawakami, and C. Dyer. 2016. “Neural Architectures for Named Entity Recognition”. Proc. NAACL-HLT.
- LeCun Yann, Yoshu Bengio, and Geoffre Hinton. 2015. “Deep Learning.” Nature 521 (7553): 436. doi: 10.1038/nature14539
- Lee K., J.y. Shin, and R. Zadeh. 2013. “ Twitter's Effectiveness on Blackout Detection During Hurricane Sandy.”
- Leidner Jochen L., and Michael D. Lieberman. 2011. “Detecting Geographical References in the Form of Place Names and Associated Spatial Natural Language.” SIGSPATIAL Special 3 (2): 5–11. doi: 10.1145/2047296.2047298
- Li Rui, Shengji Wang, and Kevin Chen-Chua Chang. 2012. “Multiple Location Profiling for Users and Relationships from Social Network and Content.” Proceedings of the VLDB Endowment 5 (11): 1603–1614. doi: 10.14778/2350229.2350273
- Lingad J., S. Karimi, and J. Yin. 2013. “Location Extraction from Disaster-Related Microblogs.” Proceedings of the 22nd International Conference on World Wide Web, 1017–1020.
- Liu Y., and N. N. Schulz. 2002. “Knowledge-Based System for Distribution System Outage Locating Using Comprehensive Information.” IEEE Transactions on Power Systems 17 (2): 451–456. doi: 10.1109/TPWRS.2002.1007917
- Malmasi S., and M. Dras. 2015. “Location Mention Detection in Tweets and Microblogs.” International Conference of the Pacific Association for Computational Linguistics, 123–134.
- Middleton S. E., L. Middleton, and S. Modafferi. 2014. “Real-Time Crisis Mapping of Natural Disasters Using Social Media.” IEEE Intelligent Systems 29 (2): 9–17. doi: 10.1109/MIS.2013.126
- Molla D., and S. Karimi. 2014. “Overview of the 2014 ALTA Shared Task: Identifying Expressions of Locations in Tweets.” Australasian Language Technology Association Workshop 2014, 151.
- Monteiro Bruno R., Clodoveu A. Davis Jr, and Fre Fonseca. 2016. “A Survey on the Geographic Scope of Textual Documents.” Computers & Geosciences 96: 23–34. doi: 10.1016/j.cageo.2016.07.017
- Pennington J., R. Socher, and C. D. Manning. 2014. “Glove: Global Vectors for Word Representation.” EMNLP 14: 1532–1543.
- Platt J. 1999. “Probabilistic Outputs for Support Vector Machines and Comparisons to Regularized Likelihood Methods.” Advances in Large Margin Classifiers 10 (3): 61–74.
- Sakaki T., M. Okazaki, and Y. Matsuo. 2010. “Earthquake Shakes Twitter Users: Real-Time Event Detection by Social Sensors.” Proceedings of the 19th International Conference on World Wide Web, 851–860.
- Santos C. D., and B. Zadrozny. 2014. “Learning Character-Level Representations for Part-of-Speech Tagging.” Proceedings of the 31st International Conference on Machine Learning (ICML-14), 1818–1826.
- Sparck Jones K. 1972. “A Statistical Interpretation of Term Specificity and Its Application in Retrieval.” Journal of Documentation 28 (1): 11–21. doi: 10.1108/eb026526
- Sun H., Z. Wang, J. Wang, Z. Huang, N. Carrington, and J. Liao. 2016. “Data-Driven Power Outage Detection by Social Sensors.” IEEE Transactions on Smart Grid 7 (5): 2516–2524. doi: 10.1109/TSG.2016.2546181
- Takeichi Y., K. Sasahara, R. Suzuki, and T. Arita. 2014. “Twitter as Social Sensor: Dynamics and Structure in Major Sporting Events.” Artificial Life 14: 778–784.
- Thakur G. S., B. L. Bhaduri, J. O. Piburn, K. M. Sims, R. N. Stewart, and M. L. Urban. 2015. “PlanetSense: A Real-Time Streaming and Spatio-Temporal Analytics Platform for Gathering Geo-Spatial Intelligence from Open Source Data. Proceedings of the 23rd SIGSPATIAL International Conference on Advances in Geographic Information Systems, 11.
- U.S. Department of Energy. 2014. “The Development of EAGLE-I: The First-Ever Technology to Track Power Outages Nationwide. Accessed February 15, 2017. https://energy.gov/articles/development-eagle-i-first-ever-technology-track-power-outages-nationwide.