
 ?Mathematical formulae have been encoded as MathML and are displayed in this HTML version using MathJax in order to improve their display. Uncheck the box to turn MathJax off. This feature requires Javascript. Click on a formula to zoom.
ABSTRACT
Agricultural drought threatens food security. Numerous remote-sensing drought indices have been developed, but their different principles, assumptions and physical quantities make it necessary to compare their suitability for drought monitoring over large areas. Here, we analyzed the performance of three typical remote sensing-based drought indices for monitoring agricultural drought in two major agricultural production regions in Shaanxi and Henan provinces, northern China (predominantly rain-fed and irrigated agriculture, respectively): vegetation health index (VHI), temperature vegetation dryness index (TVDI) and drought severity index (DSI). We compared the agreement between these indices and the standardized precipitation index (SPI), soil moisture, winter wheat yield and National Meteorological Drought Monitoring (NMDM) maps. On average, DSI outperformed the other indices, with stronger correlations with SPI and soil moisture. DSI also corresponded better with soil moisture and NMDM maps. The jointing and grain-filling stages of winter wheat are more sensitive to water stress, indicating that winter wheat required more water during these stages. Moreover, the correlations between the drought indices and SPI, soil moisture, and winter wheat yield were generally stronger in Shaanxi province than in Henan province, suggesting that remote-sensing drought indices provide more accurate predictions of the impacts of drought in predominantly rain-fed agricultural areas.
1. Introduction
Drought is a complex natural phenomenon that can be difficult to accurately quantify (Quiring Citation2010). Although drought is the most common disaster in arid areas, it occurs throughout the world, even in wet and humid regions (Dai Citation2011). The American Meteorological Society divides drought into four categories: meteorological drought, agricultural drought, hydrological drought and social and economic drought (Heim Citation2002). In this present study, we will focus on agricultural drought, which refers to soil moisture deficits during a given period that result in crop failure (Mishra and Singh Citation2010). Agricultural drought may occur during different crop growth stages, leading to different crop yield reductions. The quantification of agricultural drought and its effects on crop yield are further complicated by high spatial and temporal variation in the frequency, timing, and severity of drought.
Drought indices have been developed to provide effective tools to detect, monitor, and evaluate drought events (Niemeyer Citation2008). More than 150 drought indices have been developed for different places, objectives, and applications in the past few decades (Zargar et al. Citation2011). Originally, traditional meteorological data such as precipitation and temperature were used to develop drought indices (Wu et al. Citation2013), including the Standardized Precipitation Index (SPI; McKee, Doesken, and Kleist Citation1993), the Palmer drought severity index (PDSI; Palmer Citation1965), and the moisture anomaly index (Z-index; Palmer Citation1965). Although these meteorological drought indices usually worked well at the level of individual meteorological stations, they worked less well at a regional level due to limited coverage of most large areas by a sufficient number of stations. Thus, the scattered meteorological data that is often available over a large region is usually insufficient to support for timely drought detection, monitoring, and decision making (Son et al. Citation2012; Unganai and Kogan Citation1998).
Remote sensing data provides a valuable alternative to station-based data, since it permits drought monitoring at a large scale, especially in regions with a low population density and a harsh environment (Rhee, Im, and Carbone Citation2010; Wu et al. Citation2013). For more than three decades, various remotely sensed drought indices have been developed for drought monitoring (Peng, Deng, and Di Citation2015). The provides some widely used remotely sensed drought indices.
Table 1. The widely used remotely sensed drought indices.
Despite the ongoing development and improvement of drought indices, the accurate assessment of drought remains challenging, and the generality of those remote sensing indices are unclear. Comparison of various drought indices can help us to understand drought events better, and to comprehensively analyze the performance of the drought indices (Zhang et al. Citation2017). Morid, Smakhtin, and Moghaddasi (Citation2006) found that it’s necessary to use several indices to have a more accurate result due to variation in the responses of different indices to local conditions. Bayarjargal et al. (Citation2006) found it was difficult to select the most reliable drought index, and the precision of meteorological measurements at the local level was insufficient to validate remotely sensed drought indices over a wide region. Work by Zhang et al. (Citation2017) compared the usefulness of 13 remotely sensed drought indices across the Continental United States for studying drought phenomena, and found that the performance of the drought indices varied in different climate zones, and suggested that the future development of combined indices could focus more on empirical weighting based on the climate. Therefore, it is difficult to propose a single drought index that to accurately monitor the drought conditions throughout a large region, due to complex landscape and climate.
The direct impacts of agricultural drought are seen as a reduction of crop yield. Quiring and Papakryiakou (Citation2003) found that there is a statistically significant relationship between the Z-index and Red Spring wheat yield in all crop districts, but the strength of the correlations varied among the crop district. Wang et al. (Citation2016) analyzed the performance of soil moisture measurements and five climate-based drought indices, to monitor the threat of drought to winter wheat in China and Tian, Yuan, and Quiring (Citation2018) evaluated six drought indices for agricultural drought monitoring in the south-central United States, both of their results are all indicated SPEI outperformed the other indices, due to the SPEI define the wetness and dryness periods using the balance between precipitation and potential evapotranspiration. Zhang, Mu, and Huang (Citation2016) found that DSI have a favorable capability to monitor agricultural drought severity at the provincial scale in northern China. Anderson et al. (Citation2016) conducted drought monitoring in eight major agricultural states in eastern Brazil based on ESI, and found that ESI performed better in predicting the impacts of drought on the yield of main crops (soybean, maize and wheat).
Due to the spatial and temporal variations in the occurrence and severity of agricultural drought and different applications of remotely sensed drought indices, it is necessary to compare the remotely sensed drought indices to capture the drought event process and analyze the drought impacts on winter wheat yield at the large spatial area. In this study, we evaluated the ability of three widely used remotely sensed drought indices (VHI, DSI and TVDI) for agricultural drought monitoring in Shaanxi and Henan provinces in the North China Plain, during the main winter wheat growing season from 2000 to 2013. We also used SPI, winter wheat yield, soil moisture and NMDM maps to evaluate and compare the agricultural drought monitoring ability of the remotely sensed drought indices.
2. Data and methods
2.1. Study area
The study area include Shaanxi and Henan provinces in northern China, which extend from 31°24′N to 42°37′N and from 105°30′E to 122°4′E and cover about 372800 km2 (). Henan province has a continental monsoon climate and lies in the transition zone from the northern subtropics to the warm temperate zone, with an average temperature ranging from 12.1°C to 15.7°C, and an average annual rainfall ranging from 532 mm to 1380 mm. Because of the influence of monsoon, the precipitation is concentrated from June to August, and the percentage of effective irrigated area to cultivated area is more than 65% (Data Source: National Bureau of Statistics of China, http://www.stats.gov.cn/). Shaanxi province has a continental monsoon climate, with an average temperature ranging from 8°C to 16°C and an average annual rainfall ranging from 275 mm to 1274 mm, and the effective irrigated area to cultivated area is less than 40% (Data Source: National Bureau of Statistics of China, http://www.stats.gov.cn/). Because of the spatial variability and the seasonal and interannual variability of rainfall, this region is very sensitive to drought which can greatly affect the crop yield.
Figure 1. Study area: ten cities in Henan and Shaanxi provinces (Section 3.3). Note: AY: Anyang; HB: Hebi; XX: Xinxiang; ZZ: Zhengzhou; XC: Xuchang; PDS: Pingdingshan; LH: Luohe; SMX: Sanmenxia.
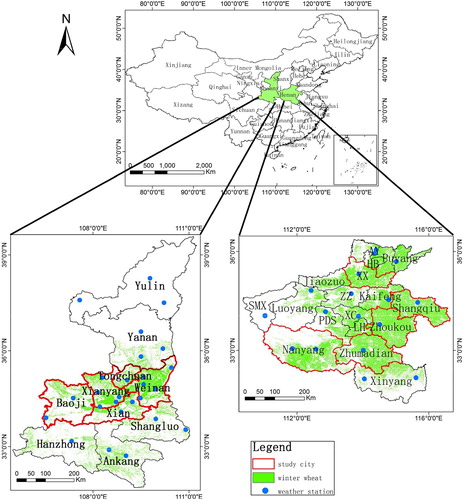
We chose five main winter wheat producing cities of each province to analyze the effect of agricultural drought on winter wheat yield during main growing seasons. The ten cities are Zhumadian, Nanyang, Zhoukou, Shangqiu and Xinxiang in Henan province and Weinan, Xianyang, Tongchuan, Xi’an and Baoji in Shaanxi province. A crop rotation between winter wheat and summer maize is the main cultivation system in this area. presents the key growth stages of winter wheat in the study area.
Table 2. The general growth stages of winter wheat for the study area.
2.2. Data
2.2.1. Remote sensing data and winter wheat mask
Remote sensing data used in this study is Moderate Resolution Imaging Spectroradiometer (MODIS) products including 8-day and monthly MOD11 LST, MOD13 NDVI (http://reverb.echo.nasa.gov/reverb/) and MOD16 ET/PET (http://www.ntsg.umt.edu/project/mod16) products. These products are provided at 1-km resolution for the two provinces, and we used data from 2000 to 2013. The MODIS data has a high temporal resolution and wide coverage. It can therefore be used to detect the dynamic changes in vegetation conditions during the growth period. In the present study, we only used the data during winter wheat growing season to generate the time series of MODIS products (NDVI, LST, ET/PET). In addition, the winter wheat planting area with 500 m spatial resolution is obtained from time series of MODIS reflectance data (MOD09A1) by using random forest method (Hao et al. Citation2015; Liu et al. Citation2017).
2.2.2. Precipitation, soil moisture and crop yield data
We obtained monthly precipitation data from 2000 to 2013 and 10-day soil moisture data from 2000 to 2013 at 43 meteorological stations in this study area from the China Meteorological Data Sharing Service System (http://cdc.cma.gov.cn/). And the soil moisture data is weight water content which can be used to characterize soil relative humidity. The prefecture city-level winter wheat yield data for the two provinces from 2000 to 2013 were obtained from the National Bureau of Statistics of China (http://data.stats.gov.cn/).
2.2.3. National meteorological drought monitoring (NMDM) maps
The NMDM maps were provided by the National Climate Center of China Meteorological Administration (http://cmdp.ncc-cma.net), which uses a Comprehensive Index (CI) to monitor the daily national meteorological drought of China. CI comprehensively considers the short-term (nearly 30 days) precipitation, long-term (nearly 90 days) climatic characteristics, the Relative Moisture Index (M) of the past 30 days and the water balance between precipitation and evaporation. CI reflects both the effects of precipitation anomalies at both a short-term scale (monthly) and a long-term scale (seasonally) and the water deficit at a short-term scale(monthly) which would affect crop growth (Zhang, Zou, and Xiao Citation2006). This indicator is suitable for real-time monitoring of meteorological drought and assessment of historical meteorological drought, and it can be calculated using the Equations (1) and (2):(1)
(1)
(2)
(2) Where Z30 and Z90 are SPI for the most recent 30 days and 90 days, respectively; M30 is the relative moisture index for the most recent 30 days; PE is potential evapotranspiration, and P is precipitation. The parameters a, b, and c are assigned values of 0.4, 0.4, and 0.8, respectively (Zhou et al. Citation2013).
2.3. Methods
There are dozens of drought indices that are potentially suitable for monitoring agricultural drought in northern China, we used three typical remotely sensed drought indices in this study. These drought indices are all synthetic drought indices, TVDI is based on the simplified NDVI-LST triangular feature space, VHI is based on the variety in long time series NDVI and LST, and DSI integrated NDVI and ET/PET. And both NDVI, LST, and ET/PET are all crucial factors of drought monitoring. Thus, we use VHI, DSI, and TVDI to carry out our research.
2.3.1. Calculation of VHI, TVDI and DSI
VHI, which is based on the combinations of VCI and TCI, was developed by Kogan (Kogan Citation1995a, Citation1995b, Citation1997). Equation (3) shows the computation of VHI.(3)
(3) Where a and (1-a) specify the relative giving’s of VCI and TCI to the value of VHI, and in this study we used the a value of 0.5.
VCI was developed by scaling NDVI values from 0 to 1 using the minimum and maximum NDVI for each location, which tried to discriminate the weather component and the ecosystem component by using the Equation (4) (Kogan Citation1990, Citation1995a).(4)
(4)
(5)
(5) Where
represents the NDVI for pixel i at the time of j,
and
represent the long time series minimum and maximum NDVI, respectively, for pixel i, NIR and RED represent the reflectance in near infrared and red band respectively.
The algorithm conduction of TCI is a LST normalization for each pixel by using maximum and minimum temperature in the given time series.(6)
(6) Where
represents the LST for pixel i at the time of j,
and
represent the long time series minimum and maximum LST, respectively, for pixel i.
TVDI was proposed based on the simplified NDVI-LST triangular feature space. In this feature space, Tmin, which represents the minimum temperature, is used as the wet edge; and the dry edge is decided by Tmax, which is the maximum surface temperature observation for a given NDVI (Sandholt, Rasmussen, and Anderson Citation2002). Since the dry edge and wet edge have great influence on the accuracy of TVDI, Tang’s method was used to calculate the TVDI which has the superiority of filtering the false dry points and is more robustly resistant to the outliers (Tang, Li, and Tang Citation2010).(7)
(7)
(8)
(8)
(9)
(9)
Where is the land surface temperature at a pixel, whose NDVI value is
;
represents the maximum land surface temperature for a given NDVI;
represents the minimum land surface temperature for a given NDVI; a, b, a’ and b’ are the undetermined coefficients.
DSI combines the elements of ET/PET and NDVI. NDVI can describe the vegetation growth stage and photosynthesis, while ET/PET can express crop water stress condition. Their combination can reflect the drought conditions. There are three steps in the calculation of DSI. In the first step, we standardize the long time series of NDVI and ET/PET data (Equations (10) and (11)). The second step is to add the standardized NDVI and ET/PET (Equation (12)). In the third step, we standardize the results of the addition to derive DSI (Equation (13)).(10)
(10)
(11)
(11)
(12)
(12)
(13)
(13)
Where and
represent the standardized NDVI and ET/PET,
and
represent the value of NDVI and ET/PET at a certain period.
,
and
represent the average value of long time series NDVI, ET/PET and Z data,
,
and
represent the standardized deviation of NDVI, ET/PET and Z respectively.
2.3.2. Comparison with SPI
In this study, we calculated the SPI for the 43 weather stations in Henan and Shaanxi province using monthly precipitation data from 2000 to 2013. 3-month and 6-month SPI (SPI3, SPI6) were calculated to explore their relationship with the three remotely sensed drought indices. It is widely accepted that SPI3 and SPI6 are suitable for monitoring various drought types and describing drought events that affect agricultural practices (Edwards and McKee Citation1997; Gebrehiwot, Veen, and Maathuis Citation2011; Sun et al. Citation2013).
We compared the monthly remotely sensed drought indices with SPI in two ways, both spatial comparison and temporal comparison. In spatial comparison, we used the long time series SPI and the corresponding remotely sensed drought indices to make correlation at each meteorological station. And in temporal comparison, we used the SPI of all meteorological stations and the corresponding remotely sensed drought indices to make correlation during each month from January to June. There is a spatial mismatch between the SPI values at meteorological station level and the remotely sensed drought indices at 1-km resolution. Therefore, if there is only one station in a given cell of the 1 km × 1 km grid, we used the data from the station as the mean value for that cell; conversely, if there are more than one station in a cell, we averaged all stations’ data in that cell to obtain the mean value for that cell of the grid. We then compared the meteorological station value for each cell with the remote sensing data of that cell.
2.3.3. Comparison with soil moisture
Soil moisture is the optimum indicator of agricultural drought. Therefore, we used soil moisture data to evaluate the performance of the drought indices at both spatial and temporal scales. At spatial scale, we chose a drought event in Shaanxi province from September 2012 to February 2013 to compare the spatial distributions of the drought indices. On the time scale, we divided the winter wheat growing season into three periods (period 1: October, November and December; period 2: January and February; period 3: March, April, May and June), and calculated the correlations between soil moisture and remotely sensed drought indices for each period and for the whole period. We compared the 8-day remotely sensed drought indices with soil moisture, but the temporal resolution of the soil moisture data was 10 days. Therefore, we divided the month into three 10-day periods to determine which of these periods the remote sensing data belonged to, and then used the corresponding soil moisture data to calculate the correlation with remotely sensed drought indices.
2.3.4. Comparison with winter wheat yield
We calculated the correlations between winter wheat yield and the drought indices to evaluate their performance of different drought indices. Crop yield is affected by many factors in addition to agricultural drought, such as insects and diseases, fertility, and technical progress (variety and management). Thus, the yield data cannot be directly compared with the drought indices. In this study, we therefore detrended the crop yield time series to isolate the effects of non-climate factors following the method of Lobell, Wolfram, and Justin (Citation2011). We used Equation (14) to detrend the crop yield:(14)
(14) Where Yi is the detrended crop yield for location i, Yoi is the observed crop yield, and Yti is the trend crop yield. The detrended crop yield was then standardized using Equation (15) before calculating the correlations with the drought indices (Du et al. Citation2013). The standardized crop yield St.Y was calculated as follows.
(15)
(15) Where Yi is the detrended crop yield,
represents the mean of the detrended crop yields and σY represents the standard deviation of the detrended crop yield.
We calculated correlations between the remotely sensed drought indices and winter wheat yield at the prefecture-city level. First, the 8-day ET, PET, NDVI, LST and TVDI data for winter wheat from 2000 to 2013 at 1-km spatial resolution were aggregated to the prefecture-city level for each city. We then calculated the prefecture-city level drought indices for each 8-day period during the main winter wheat growing season. Finally, we used the five typical cities selected in each province to calculate the correlation with the winter wheat yield from 2000 to 2013.
3. Results
3.1. Correlations between drought indices and SPI
It should be noted that TVDI is negatively correlated with SPI, so we multiplied the correlation results between TVDI and SPI by −1 to facilitate comparisons with other remotely sensed drought indices. Although this changes the direction of the correlation, it does not affect interpretation of the strength of the correlation.
3.1.1. Comparison of drought indices and SPI at the level of individual meteorological stations
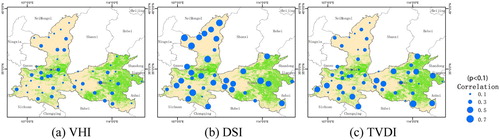
and show the correlations between the remotely sensed drought indices and SPI at two time scales (SPI3 and SPI6). These results showed that DSI and TVDI performed better than VHI for most stations in both Shaanxi and Henan province. DSI had the largest number of stations with statistically significant correlations, whereas VHI had the smallest number of stations with statistically significant correlations. (b) and (b) show that DSI had stronger correlations with SPI with most correlation coefficients greater than or equal to 0.3. This demonstrated that DSI outperform the other two remotely sensed drought indices in terms of its correlations with SPI.
Figure 2. The correlations between the monthly drought indices and 3-month standardized precipitation index (SPI3) for the study area. Note that the correlation between TVDI and SPI is negative, but we multiplied these values by –1 to focus on the magnitude of the correlation rather than its direction.
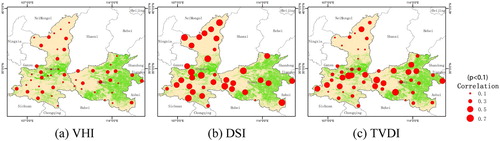
Figure 3. The correlations between the monthly drought indices and the 6-month standardized precipitation index (SPI6) for the study area. Note that the correlation between TVDI and SPI is negative, but we multiplied these values by –1 to focus on the magnitude of the correlation rather than its direction.
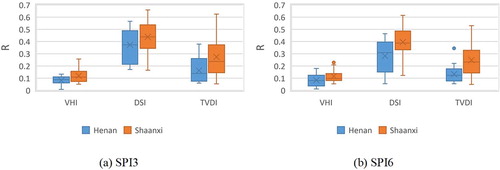
As depicted in , the correlations between the drought indices and SPI are stronger in Shaanxi province than in Henan province, especially for DSI and TVDI. This is likely to be explained by the fact that the impacts of drought would be more significant in the rain-fed areas of Shaanxi province than in the irrigated areas of Henan province. The irrigated areas generally meet the crop’s water requirements for growth and development, so serious water stress is rare. These results suggest that the remotely sensed drought indices are more strongly correlated with SPI in regions dominated by rain-fed cultivation than in irrigation-dominated regions.
Figure 4. Box plots for the correlations between the monthly drought indices and the standardized precipitation index (SPI). Horizontal lines represent the median value, X represents the mean, boxes represent the 25% to 75% interval, and whiskers represent the 95% confidence interval. Note that the correlation between TVDI and SPI is negative, but we multiplied these values by –1 to focus on the magnitude of the correlation rather than its direction.
3.1.2. Temporal comparison of drought indices and SPI
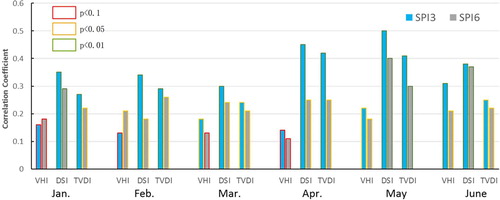
shows that VHI had the weakest correlation with SPI throughout the growing season. The correlation between VHI and SPI ranged from about 0.11 in April and about 0.22 in May, except the correlation between SPI3 and VHI reached 0.31 in June. TVDI shows low correlation with both SPI3 and SPI6 from January to March and in June, but high correlations appeared in April and May. It is clear that DSI was most strongly related to SPI3 and SPI6 during the growing season among the three drought indices, and the highest value of the correlation coefficient occurred in May, which can reach 0.5. Moreover, the correlations between the remotely sensed drought indices and SPI3 are higher than those with SPI6. These results suggest that DSI is most strongly correlated with the in situ SPI (both SPI3 and SPI6) throughout the growing season, which is consistent with the results at the meteorological station level.
Figure 5. Values of the correlation between the remotely sensed drought indices and the standardized precipitation index (SPI3, 3 months; SPI6, 6 months) during the winter wheat growing season. Note that the correlation between TVDI and SPI is negative, but we multiplied these values by –1 to focus on the magnitude of the correlation rather than its direction.
3.2. Comparison of drought indices and soil moisture
3.2.1. Comparison with soil moisture during a drought event
To investigate the response of the remotely sensed drought indices to a drought event in more detail, we focused on the drought event that occurred in Shaanxi province from October 2012 to April 2013. This period had the lowest average precipitation since 1961. The three remotely sensed drought indices were compared visually with soil moisture and NMDM maps by dividing into 5 drought grades to assess their performance of monitoring agricultural drought conditions (Mu et al. Citation2013; Son et al. Citation2012; Sun et al. Citation2013; Wang et al. Citation2004; Zhang, Zou, and Xiao Citation2006).
We performed this analysis for 11 time periods for different day of year (DOY) dates: the sowing to tillering stage (DOY2012-281, DOY2012-305, DOY2012-345), wintering stage (DOY2013-017, DOY2013-025), green-up stage (DOY2013-065), jointing stage (DOY2013-081, DOY2013-105), heading stage (DOY2013-129), grain-filling stage (DOY2013-145), and milk-maturity stage (DOY2013-169). The corresponding dates for the NMDM maps were 8 October, 31 November, and 10 December in 2012, and 17 January, 25 January, 5 March, 12 March, 14 April, 8 May, 24 May, and 17 June in 2013. shows the spatial pattern of remotely sensed drought indices and the soil moisture patterns during the drought conditions in Shaanxi province from October 2012 to June 2013. Only slight drought occurred in central Shaanxi province in October 2012, but the drought became increasingly serious until March 2013, when almost the entire province suffered from drought. Thereafter, the drought gradually weakened until June 2013. Despite large differences in the spatial patterns, the time series of the remotely sensed drought indices clearly captured the evolution of drought intensity and extent, and the results were generally consistent.
Figure 6. Comparisons of the remotely sensed drought indices and soil moisture (SM) and National Meteorological Drought Monitoring (NMDM) values during a typical drought event in Shaanxi Province.

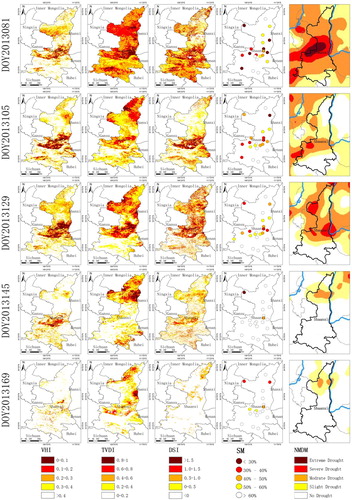
Due to limited soil moisture data over study area, there is a temporal mismatch between the soil moisture data and the remote sensing data, so the consistency between the soil moisture map and the remotely sensed drought maps is less obvious. Nonetheless, there was a consistent tendency to identify drought from DOY2013-065 to DOY2013-129 based on the spatial patterns of soil moisture and the drought indices. In addition, VHI seemed to underestimate the drought conditions compared with TVDI, DSI, and NMDM, especially on DOY2012-281, DOY2012-345, DOY2013-017, DOY2013-025, and DOY2013-081. The spatial distributions of drought based on VHI were quite different from those based on the NMDM maps on some dates. Drought status based on TVDI appeared to be more severe in some areas than that based on VHI and DSI (DOY2012-281, DOY2013-081, DOY2013-105, DOY2013-145, DOY2013-169). The spatial pattern of drought based on DSI was generally consistent with the NMDM maps (DOY2012-305, DOY2012-345, DOY2013-017, DOY2013-065, DOY2013-081, DOY2013-105, DOY2013-129, DOY2013-169). However, there were still some disagreements in the spatial distribution of DSI drought conditions on DOY2012-281, DOY2013-025, and DOY2013-145. DSI revealed a little bit more of the spatial pattern of drought in some areas. Overall, DSI showed higher consistency than TVDI and VHI with the NMDM maps during this drought event.
3.2.2. Correlation between drought indices and soil moisture data during the winter wheat growing season
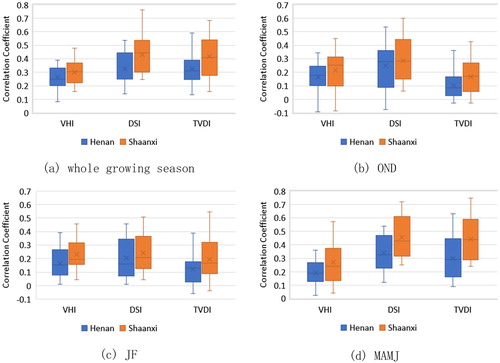
Correlations between remotely sensed drought indices and soil moisture were calculated at the meteotological station level. shows that VHI and DSI were positively correlated with soil moisture, whereas TVDI was negetively correalted with soil moisture, and the performance of the three drought indices varied among the periods of the year. All three drought indices were most strongly correlated with soil moisture from March to June, especially for TVDI. Lower correlations in the winter months resulted from the lower vegetation cover, which will have a negative impact on the calculation of drought indices. Generally, DSI had the highest median correlation with soil moisture, followed by TVDI and VHI. Moreover, shows a strong relationship between the three drought indices and soil moisture in Shaanxi province, where agricultural land is dominated by rain-fed cultivation, whereas, Henan province relies more on irrigation. One reason for the low correlations between drought indices and soil moisture in Henan province is the heavy reliance on irragation, which can alleviate soil moisture deficits.
Figure 7. Box plots of the correlations between the remotely sensed drought indices and soil moisture. Panel (a) is the boxplot of correlation coefficients at the whole growing season. Panels (b)–(d) are boxplots of correlation coefficients during OND (October, November, and December), JF (January and February) and MAMJ (March, April, May, and June). Horizontal lines represent the median value, X represents the mean, boxes represent the 25% to 75% interval, and whiskers represent the 95% confidence interval.
3.3. Correlations between the drought indices and winter wheat yields during main growing season
shows the correlations between the 8-day values of the drought indices and winter wheat yields in the five cities in each province. It should be noted that TVDI and soil moisture are negatively correlated, whereas DSI and VHI are positively correlated with soil moisture. Therefore, we have multiplied the TVDI values by –1 to facilitate comparisons among the three indices.
Figure 8. The correlations between the 8-day values of the drought indices during the growing season and winter wheat yield.

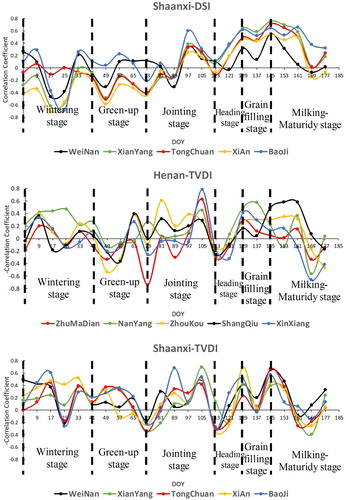
We found that there were two obvious peaks in the correlation curves during the winter wheat growth period. One peak occurred between DOY97 and DOY105, and the other around DOY145. These periods correspond to the jointing stage and the grain-filling stage, respectively. The results suggest that water stress affected winter wheat yield most strongly during these growth stages.
In other growing stages, the similarity of the correlation patterns was less obvious. During the wintering and green-up stages (DOY001 to DOY065) vegetation cover is relatively low, and drought detection is mainly driven by the temperature increase during this period, which promotes crop growth. Moreover, during the early growth of winter wheat, and especially the green-up stage, solar radiation is the dominant factor that affects the growth and development of winter wheat, and soil moisture is less important. Agricultural experiments show that slight drought benefits root growth, thereby allowing the root system to absorb moisture better during subsequent growth stages. Thus, the correlation coefficient during these stages was negative. At the end of the green-up stage and the start of the jointing stage, the correlation coefficient increased, indicating that the winter wheat had entered a stage with high water demand. During the heading stage (DOY113 to DOY121), the water demand falls, and the correlation coefficient decreases. When winter wheat reaches its milk and maturity stage (DOY153 to DOY177), the winter wheat grains are plump and becoming mature, so the water demand decreases and the impact of water stress on winter wheat yield also decreases.
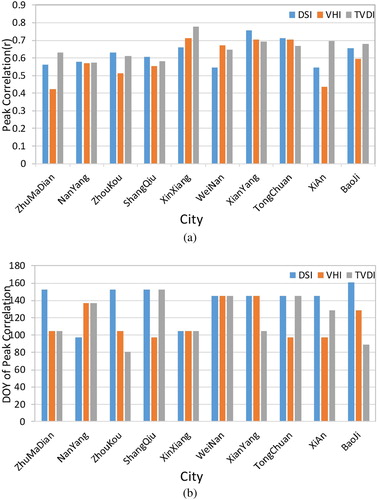
shows the date and strength of the peak correlation with winter wheat yield for the three indices in the 10 prefecture cities. The peak correlations were marginally stronger with TVDI in most cities (r = 0.66 on average), with VHI yielding the lowest correlations (r = 0.58 on average). In most cities, the peak correlation occurred during two main periods: one is around DOY100 and the other is around DOY140. These periods correspond to the jointing stage and the grain-filling stage, respectively, so these results are similar to those in . Thus, these growth periods appear to be the most important periods for effective monitoring of agricultural drought to support management of winter wheat yield.
Figure 9. (a) Strength of the peak correlation between the three drought indices and winter wheat yield and (b) date (day of year, DOY) of the peak correlation for the 10 cities. Note that the correlation between TVDI and SPI is negative, so we multiplied these values by –1 to focus on the magnitude of the correlation rather than its direction.
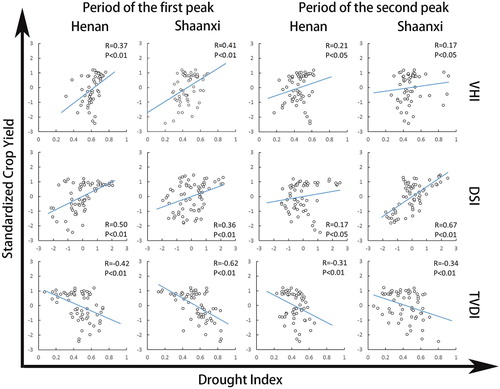
In , we used the prefecture-city level drought indices for the 10 cities in Henan and Shaanxi provinces from 2000 to 2013 to perform the relationship with winter wheat yield. In Henan province, DSI was most strongly correlated with winter wheat yield during the period of the first peak (R = 0.50, p < 0.01), and TVDI had the strongest correlation during the period of the second peak (R = −0.31, p < 0.01). In Shaanxi province, TVDI outperformed the other drought indices during the period of the first peak (R = −0.62, p < 0.01), but the strongest correlation during the period of the second peak was for DSI (R = 0.67, p < 0.01). Meanwhile, the correlation between remotely sensed drought indices and winter wheat yield was stronger in Shaanxi province in most cases, except for VHI during the period of the second peak and DSI during the period of the first peak. These results suggest that at least in Henan and Shaanxi provinces, TVDI and DSI are better predictors than VHI of the winter wheat yield response to agricultural drought, and these drought indices are more suitable for monitoring the effect of drought in a region dominated by rain-fed cultivation.
Figure 10. The correlation between the drought indices and winter wheat yield during the two periods with the peak correlation (see for details).
4. Discussion
Since the performance of drought indices varies among regions and applications, it is important to assess the suitablity and effectiveness of a given drought index for a specific region and application to support monitoring of agricultural drought conditions and their impact on crops. The objective of the present study was to test the suitability of three remotely sensed drought indices for agricultural drought monitoring in China, with the goal of improving our understanding of the potential impacts of agricultural drought on winter wheat yield and improve crop management. The results revealed that, DSI showed strongest correlations with SPI (both SPI3 and SPI6) and soil moisture. In terms of the relationship with winter wheat yield, the TVDI time series accurately captured the main responses of winter wheat yield to drought conditions during different stages of the growing season. The jointing and grain-filling stages were the most sensitive to agricultural drought, and should therefore be the focus of monitoring and water management.
4.1. Several main factors related to agricultural drought monitoring in this study
NDVI, LST, and ET are basic components of many remotely sensed drought indices. No single indicator can fully explain the complexity and diversity of drought because agricultural drought is caused by many factors (Park et al. Citation2016). This suggests that combining the information from various indices can potentially improve drought monitoring (Hayes et al. Citation2005; Mizzell Citation2008; Wardlow, Anderson, and Verdin, Citation2012). We therefore analyzed remotely sensed VHI, DSI, and TVDI, which combine information from basic factors that underlie the development of drought. DSI, which is based on ET/PET and NDVI, had the strongest correlation with SPI. The ET/PET is an important factor in drought monitoring, because it reflects energy and water exchanges among the vegetation, soil, and atmosphere, and therefore depicts the characteristics of soil moisture (Allen et al. Citation2011; Cooke et al. Citation2012; Park et al. Citation2016; Rhee, Im, and Park Citation2014).
Crop yield has often used as a surrogate variable for representing agricultural drought conditions (Handler Citation1990; Park et al. Citation2016; Quiring and Papakryiakou Citation2003). In this study, we compared the 8-day remotely sensed drought indices during winter wheat’s main growth stages with winter wheat yield at the prefecture-city level over a period of 14 years. We found that the correlations between winter wheat yield and the drought indices were strongest during the jointing and grain-filling stages, and that the correlations were strongest for TVDI during these stages. The growth rate of winter wheat reaches its maximum during the jointing stage, when water becomes a dominant factor that limits crop yield. In contrast, during the grain-filling stage, the embryonic cells of winter wheat begin to deposit starch, so this is the most important period for increasing grain weight. In regions where irrigation is available, farmers typically irrigate winter wheat 2–3 times during the growth period: once between the end of March to early April, and once in early May. These two typical irrigation time periods generally correspond to the jointing and the grain-filling stages. Compared with Zhang, Mu, and Huang (Citation2016) study, it should be noted that we conducted our analysis at a prefecture-city level which is a finer spatial scale than province level. Zhang’s study showed that the grain-filling stage was most strongly correlated with winter wheat yield at a province scale. Our study indicated that drought has the greatest impact on winter wheat yield during both jointing and grain filling stages, which means that if the crop is protected from water stress during these two periods, the maximum probability of a good harvest will be achieved.
We found that the remotely sensed drought indices performed better for agricultural drought monitoring in Shaanxi province than in Henan province, and one of the main factors seems likely to be the different dominance of irrigation. It is obvious that irrigation can relieve water stress, farmland with more irrigation can retain healthy vegetation even during drought years because farmers can mitigate soil moisture deficits with irrigation, which means that the vegetation health in heavily irrigated region is only partially controlled by precipitation (Quiring and Ganesh Citation2010). Therefore, when using the remotely sensed drought indices to assess the impact of drought on crop yield, it’s important to remember that more irrigated regions will tend to have poorer assessment results than rain-fed regions due to the confounding effects of irrigation.
4.2. Deficiency of three drought indices
Despite the many advantages of remotely sensed drought indices for agricultural drought monitoring, they also have their own limitations. VHI, which uses land surface temperature and vegetation condition to evaluate crop health, is calculated by NDVI and LST. Previous studies have shown that NDVI has a lagging response to drought (Ji and Peters Citation2003). There are also some uncertainties in LST, since the morphological characteristics of different crops at different growth stages will affect the surface emissivity used to estimate LST (Qin, Karnieli, and Berliner Citation2002). Similarly, the value of TVDI will also be influenced by the uncertainty of NDVI and LST. Furthermore, the empirical estimates of TVDI are based on the assumption that soil moisture is the main source of variation of LST, and TVDI is related to surface soil moisture due to changes in thermal inertia and evaporative control (evaporation and transpiration) on net radiation partitioning (energy balance) (Sandholt, Rasmussen, and Anderson Citation2002). Therefore, the surface soil water content of a study area must include from wilting point to filed capacity, and the surface cover should contain samples ranging from bare soil to land completely covered by vegetation. Thus, TVDI has some nondeterminacy when used to monitor drought in areas with sparse vegetation. DSI, which was recently developed from the MOD16 product, also has some limitations. On the one hand, the MOD16 ET product was generated globally and it integrated coarse resolution data in its calculations, which may limite its accuracy for regional applications, thereby reducing the accuracy of any drought indicator derived from this product. On the other hand, both vegetation condition and ET/PET are accounted for by DSI, which represent non-synchronous drought information (Zhang, Mu, and Huang Citation2016), because the response of ET/PET to water stress is nearly in real-time, whereas NDVI usually exhibits a time-lagged response to drought.
4.3. Limitation and outlook
One limitation of this study is that we used a static time frame to divide the winter wheat growth stages throughout the study area. Phenological variations in winter wheat growth stages occur from the northern to the southern parts of our study area, but were not taken into account. More detailed phenological data and remote sensing data should be used in future research to improve the accuracy of the analysis. Another limitation is the mismatch in the spatial and temporal resolutions between the remotely sensed drought indices and the locally derived SPI and agricultural impact data. The remotely sensed drought indices were based on a 1 km × 1 km grid, whereas SPI and soil moisture were retrieved were based on point data. The temporal resolution of the remote sensing data was 8-day and monthly, whereas the precipitation data was monthly and the soil moisture data was obtained at a 10-day scale. These mismatches between the spatial and temporal resolutions will lead a poor result, so an improved scaling approach may generate more statistically robust results.
Furthermore, the relative dominance of irrigation vs. rain-fed cultivation appears to be a key factor that affects the accuracy of drought monitoring by remote sensing, so integration of irrigation probability data and remotely sensed drought indices is likely to improve the perfornamce of drought monitoring. The direct impact of drought in agriculture is seen in decreasing crop yields. We used a long time series of remotely sensed drought indices to reveal the winter wheat yield responses to agricultural drought during different growth stages. Crop growth models can simulate crop growth under different environmental and management conditions, thereby dynamically accounting for various limiting factors (e.g. soil, weather, water, and nitrogen) that we could not account for in the present study; these models can also output various simulated parameters including state variables and crop yield during crop growth season (Huang, Ma, et al. Citation2015; Huang, Tian, et al. Citation2015, Citation2016; Huth et al. Citation2008). Assimilating remote sensing data into crop models has increasingly been applied to improve the ability to simulate crop growth and yield, and would let us expand our analysis from the field scale to larger spatial scales. Thus, in future research, we will examine the ability of the crop model-data assimilation to simulate the response of crop yields to drought at large spatial scales.
5. Conclusions
This study evaluated the performance of three remotely sensed drought indices for agricultural drought monitoring. We compared remotely sensed VHI, TVDI, and DSI with meteorological based SPI, soil moisture data, and winter wheat yield in Henan and Shaanxi provinces from 2000 to 2013. The following conclusions can be drawn.
DSI generally produced the strongest correlation with SPI (both SPI3 and SPI6), and was most strongly correlated with soil moisture. Moreover, TVDI and DSI during jointing and grain-filling stages had stronger correlations than VHI with winter wheat yield.
Winter wheat during the jointing stage and grain filling stages are more sensitive to water stress. Monitoring of drought during these periods to allow attempts at drought mitigation (e.g. irrigation) seems likely to have the strongest impact on winter wheat yield.
Stronger relationships were found between the remotely sensed drought indices and SPI, soil moisture, and winter wheat yield in Shaanxi province, where rain-fed cultivation was dominant. This suggests that these three remotely sensed drought indices have higher accuracy in monitoring agricultural drought in rain-fed-dominated regions.
Acknowledgements
We thank the journal’s editors and reviewers for their efforts to improve the quality of this paper.
Disclosure statement
No potential conflict of interest was reported by the authors.
Additional information
Funding
Related Research Data
References
- Allen, R., A. Irmak, R. Trezza, J. M. H. Hendrickx, W. Bastiaanssen, and J. Kjaersgaard. 2011. “Satellite-Based ET Estimation in Agriculture Using SEBAL and METRIC.” Hydrological Processes 25 (26): 4011–4027. doi: 10.1002/hyp.8408
- Anderson, M. C., C. Hain, B. Wardlow, A. Pimstein, J. R. Mecikalski, and W. P. Kustas. 2011. “Evaluation of Drought Indices Based on Thermal Remote Sensing of Evapotranspiration Over the Continental United States.” Journal of Climate 24 (8): 2025–2044. doi: 10.1175/2010JCLI3812.1
- Anderson, M. C., J. M. Norman, J. R. Mecikalski, J. A. Otkin, and W. P. Kustas. 2007. “A Climatological Study of Evapotranspiration and Moisture Stress Across the Continental United States Based on Thermal Remote Sensing: 2. Surface Moisture Climatology.” Journal of Geophysical Research 112 (D11): 1–13. doi: 10.1029/2006JD007507
- Anderson, M. C., C. A. Zolin, P. C. Sentelhas, C. R. Hain, K. Semmens, M. Tugrul Yilmaz, F. Gao, J. A. Otkin, and R. Tetrault. 2016. “The Evaporative Stress Index as an Indicator of Agricultural Drought in Brazil: An Assessment Based on Crop Yield Impacts.” Remote Sensing of Environment 174: 82–99. doi: 10.1016/j.rse.2015.11.034
- Bayarjargal, Y., A. Karnieli, M. Bayasgalan, S. Khudulmur, C. Gandush, and C. J. Tucker. 2006. “A Comparative Study of NOAA–AVHRR Derived Drought Indices Using Change Vector Analysis.” Remote Sensing of Environment 105 (1): 9–22. doi: 10.1016/j.rse.2006.06.003
- Cooke, W. H., G. V. Mostovoy, V. G. Anantharaj, and W. M. Jolly. 2012. “Wildfire Potential Mapping Over the State of Mississippi: A Land Surface Modeling Approach.” GIScience & Remote Sensing 49 (4): 492–509. doi: 10.2747/1548-1603.49.4.492
- Dai, A. 2011. “Erratum: Drought Under Global Warming: A Review.” Wiley Interdisciplinary Reviews: Climate Change 2 (1): 45–65.
- Du, L., Q. Tian, T. Yu, Q. Meng, T. Jancso, P. Udvardy, and Y. Huang. 2013. “A Comprehensive Drought Monitoring Method Integrating MODIS and TRMM Data.” International Journal of Applied Earth Observation and Geoinformation 23 (1): 245–253. doi: 10.1016/j.jag.2012.09.010
- Edwards, D. C., and T. B. McKee. 1997. “Characteristics of 20th Century Drought in the United States at Multiple Scales.” Atmospheric Science Paper No. 634, May 1–30.
- Gebrehiwot, T., A. V. D. Veen, and B. Maathuis. 2011. “Spatial and Temporal Assessment of Drought in the Northern Highlands of Ethiopia.” International Journal of Applied Earth Observation and Geoinformation 13 (3): 309–321. doi: 10.1016/j.jag.2010.12.002
- Ghulam, A., Q. Qin, T. Teyip, and Z. L. Li. 2007. “Modified Perpendicular Drought Index (MPDI): A Real-Time Drought Monitoring Method.” ISPRS Journal of Photogrammetry and Remote Sensing 62 (2): 150–164. doi: 10.1016/j.isprsjprs.2007.03.002
- Ghulam, A., Q. Qin, and Z. Zhan. 2007. “Designing of the Perpendicular Drought Index.” Environmental Geology 52 (6): 1045–1052. doi: 10.1007/s00254-006-0544-2
- Handler, A. 1990. “Usa Corn Yields, the El Niñmo and Agricultural Drought: 1867–1988.” International Journal of Climatology 10 (8): 819–828. doi: 10.1002/joc.3370100804
- Hao, P., Y. Zhan, L. Wang, Z. Niu, and M. Shakir. 2015. “Feature Selection of Time Series Modis Data for Early Crop Classification Using Random Forest: A Case Study in Kansas, USA.” Remote Sensing 7 (5): 5347–5369. doi: 10.3390/rs70505347
- Hayes, M., M. Svoboda, C. Le, D. Redmond, and P. Pasteris. 2005. “Drought Monitoring: New Tools for the 21st Century.”
- Heim, R. R. J. 2002. “A Review of Twentieth-Century Drought Indices Used in the United States.” Bulletin of the American Meteorological Society 83 (8): 1149–1166. doi: 10.1175/1520-0477-83.8.1149
- Huang, J., H. Ma, W. Su, X. Zhang, Y. Huang, J. Fan, and W. Wu. 2015. “Jointly Assimilating MODIS LAI and ET Products Into the SWAP Model for Winter Wheat Yield Estimation.” IEEE Journal of Selected Topics in Applied Earth Observations and Remote Sensing 8 (8): 4060–4071. doi: 10.1109/JSTARS.2015.2403135
- Huang, J., F. Sedano, Y. Huang, H. Ma, X. Li, S. Liang, L. Tian, X. Zhang, J. Fan, and W. Wu. 2016. “Assimilating a Synthetic Kalman Filter Leaf Area Index Series Into the WOFOST Model to Improve Regional Winter Wheat Yield Estimation.” Agricultural and Forest Meteorology 216: 188–202. doi: 10.1016/j.agrformet.2015.10.013
- Huang, J., L. Tian, S. Liang, H. Ma, I. Becker-Reshef, Y. Huang, W. Su, X. Zhang, D. Zhu, and W. Wu. 2015. “Improving Winter Wheat Yield Estimation by Assimilation of the Leaf Area Index From Landsat TM and MODIS Data Into the WOFOST Model.” Agricultural and Forest Meteorology 204: 106–121. doi: 10.1016/j.agrformet.2015.02.001
- Huth, N. I., P. S. Carberry, B. Cocks, S. Graham, H. M. McGinness, and D. A. O’Connell. 2008. “Managing Drought Risk in Eucalypt Seedling Establishment: An Analysis Using Experiment and Model.” Forest Ecology and Management 255: 3307–3317. doi: 10.1016/j.foreco.2008.02.024
- Ji, L., and A. J. Peters. 2003. “Assessing Vegetation Response to Drought in the Northern Great Plains Using Vegetation and Drought Indices.” Remote Sensing of Environment 87 (1): 85–98. doi: 10.1016/S0034-4257(03)00174-3
- Kogan, F. N. 1990. “Remote Sensing of Weather Impacts on Vegetation in Non-Homogeneous Areas.” International Journal of Remote Sensing 11: 1405–1419. doi: 10.1080/01431169008955102
- Kogan, F. N. 1995a. “Application of Vegetation Index and Brightness Temperature for Drought Detection.” Advances in Space Research 15: 91–100. doi: 10.1016/0273-1177(95)00079-T
- Kogan, F. N. 1995b. “Droughts of the Late 1980s in the United States as Derived from NOAA Polar-Orbiting Satellite Data.” Bulletin of the American Meteorological Society 76 (5): 655–668. doi: 10.1175/1520-0477(1995)076<0655:DOTLIT>2.0.CO;2
- Kogan, F. N. 1997. “Global Drought Watch from Space.” Bulletin of the American Meteorological Society 78 (4): 621–636. doi: 10.1175/1520-0477(1997)078<0621:GDWFS>2.0.CO;2
- Liu, J., Q. Feng, J. Gong, J. Zhou, J. Liang, and Y. Li. 2017. “Winter Wheat Mapping Using a Random Forest Classifier Combined With Multi-Temporal and Multi-Sensor Data.” International Journal of Digital Earth 11: 1–20.
- Lobell, D. B., S. Wolfram, and C. R. Justin. 2011. “Climate Trends and Global Crop Production Since 1980.” Science 333 (6042): 616–620. doi: 10.1126/science.1204531
- McFeeters, S. K. 1996. “The Use of the Normalized Difference Water Index (NDWI) in the Delineation of Open Water Features.” International Journal of Remote Sensing 17 (7): 1425–1432. doi: 10.1080/01431169608948714
- McKee, T. B., N. J. Doesken, and J. Kleist. 1993. “The Relationship of Drought Frequency and Duration to Time Scales.”
- Mishra, A. K., and V. P. Singh. 2010. “A Review of Drought Concepts.” Journal of Hydrology 391 (1): 202–216. doi: 10.1016/j.jhydrol.2010.07.012
- Mizzell, H. 2008. “Improving Drought Detection in the Carolinas: Evaluation of Local, State, and Federal Drought Indicators.”
- Morid, S., V. Smakhtin, and M. Moghaddasi. 2006. “Comparison of Seven Meteorological Indices for Drought Monitoring in Iran.” International Journal of Climatology 26 (7): 971–985. doi: 10.1002/joc.1264
- Mu, Q., M. Zhao, J. S. Kimball, N. G. McDowell, and S. W. Running. 2013. “A Remotely Sensed Global Terrestrial Drought Severity Index.” Bulletin of the American Meteorological Society 94: 83–98. doi: 10.1175/BAMS-D-11-00213.1
- Niemeyer, S. 2008. “New Drought Indices.” In Drought Management: Scientific and Technological Innovations, edited by A. López-Francos, 267–274. Zaragoza: CIHEAM.
- Palmer, W. C. 1965. Meteorological Drought, 30. Washington, DC: US Department of Commerce, Weather Bureau.
- Park, S., J. Im, E. Jang, and J. Rhee. 2016. “Drought Assessment and Monitoring Through Blending of Multi-Sensor Indices Using Machine Learning Approaches for Different Climate Regions.” Agricultural and Forest Meteorology 216: 157–169. doi: 10.1016/j.agrformet.2015.10.011
- Peng, C., M. Deng, and L. Di. 2015. “Relationships Between Remote-Sensing-Based Agricultural Drought Indicators and Root Zone Soil Moisture: A Comparative Study of Iowa.” IEEE Journal of Selected Topics in Applied Earth Observations and Remote Sensing 7 (11): 4572–4580. doi: 10.1109/JSTARS.2014.2344115
- Qin, Z., A. Karnieli, and P. Berliner. 2002. “Remote Sensing Analysis of the Land Surface Temperature Anomaly in the Sand-Dune Region Across the Israel-Egypt Border.” International Journal of Remote Sensing 23 (19): 3991–4018. doi: 10.1080/01431160110116310
- Quiring, S. M. 2010. “Developing Objective Operational Definitions for Monitoring Drought.” Journal of Applied Meteorology and Climatology 48 (6): 1217–1229. doi: 10.1175/2009JAMC2088.1
- Quiring, S. M., and S. Ganesh. 2010. “Evaluating the Utility of the Vegetation Condition Index (VCI) for Monitoring Meteorological Drought in Texas.” Agricultural and Forest Meteorology 150: 330–339. doi: 10.1016/j.agrformet.2009.11.015
- Quiring, S. M., and T. N. Papakryiakou. 2003. “An Evaluation of Agricultural Drought Indices for the Canadian Prairies.” Agricultural and Forest Meteorology 118: 49–62. doi: 10.1016/S0168-1923(03)00072-8
- Rhee, J., J. Im, and G. J. Carbone. 2010. “Monitoring Agricultural Drought for Arid and Humid Regions Using Multi-Sensor Remote Sensing Data.” Remote Sensing of Environment 114 (12): 2875–2887. doi: 10.1016/j.rse.2010.07.005
- Rhee, J., J. Im, and S. Park. 2014. “Regional Drought Monitoring Based on Multi-Sensor Remote Sensing.” EGU General Assembly Conference (Vol.16). EGU General Assembly Conference Abstracts.
- Sandholt, I., K. Rasmussen, and J. Anderson. 2002. “A Simple Interpretation of the Surface Temperature/Vegetation Index Space for Assessment of Surface Moisture Status.” Remote Sensing of Environment 79: 213–224. doi: 10.1016/S0034-4257(01)00274-7
- Son, N. T., C. F. Chen, C. R. Chen, L. Y. Chang, and V. Q. Minh. 2012. “Monitoring Agricultural Drought in the Lower Mekong Basin Using MODIS NDVI and Land Surface Temperature Data.” International Journal of Applied Earth Observation and Geoinformation 18 (1): 417–427. doi: 10.1016/j.jag.2012.03.014
- Sun, W., P. X. Wang, S. Y. Zhang, D. H. Zhu, J. M. Liu, J. H. Chen, and H. S. Yang. 2008. “Using the Vegetation Temperature Condition Index for Time Series Drought Occurrence Monitoring in the Guanzhong Plain, PR China.” International Journal of Remote Sensing 29: 5133–5144. doi: 10.1080/01431160802036557
- Sun, H., X. Zhao, Y. Chen, A. Gong, and J. Yang. 2013. “A New Agricultural Drought Monitoring Index Combining MODIS NDWI and Day-Night Land Surface Temperatures: A Case Study in China.” International Journal of Remote Sensing 34: 8986–9001. doi: 10.1080/01431161.2013.860659
- Tang, R., Z. L. Li, and B. Tang. 2010. “An Application of the Ts–VI Triangle Method With Enhanced Edges Determination for Evapotranspiration Estimation From MODIS Data in Arid and Semi-Arid Regions: Implementation and Validation.” Remote Sensing of Environment 114 (3): 540–551. doi: 10.1016/j.rse.2009.10.012
- Tian, L., S. Yuan, and S. M. Quiring. 2018. “Evaluation of Six Indices for Monitoring Agricultural Drought in the South-Central United States.” Agricultural and Forest Meteorology 249: 107–119. doi: 10.1016/j.agrformet.2017.11.024
- Unganai, L. S., and F. N. Kogan. 1998. “Drought Monitoring and Corn Yield Estimation in Southern Africa from AVHRR Data.” Remote Sensing of Environment 63 (63): 219–232. doi: 10.1016/S0034-4257(97)00132-6
- Wang, C., S. Qi, Z. Niu, and J. Wang. 2004. “Evaluating Soil Moisture Status in China Using the Temperature–Vegetation Dryness Index (TVDI).” Canadian Journal of Remote Sensing 30 (5): 671–679. doi: 10.5589/m04-029
- Wang, H., S. M. Vicente-serrano, F. Tao, X. Zhang, P. Wang, C. Zhang, Y. Chen, D. Zhu, and A. Kenawy. 2016. “Monitoring Winter Wheat Drought Threat in Northern China Using Multiple Climate-Based Drought Indices and Soil Moisture During 2000–2013.” Agricultural and Forest Meteorology 228–229: 1–12. doi: 10.1016/j.agrformet.2016.06.004
- Wardlow, B. D., M. C. Anderson, and J. P. Verdin. 2012. Remote Sensing of Drought: Innovative Monitoring Approaches. Boca Raton, FL: CRC Press.
- Wu, J., L. Zhou, M. Liu, J. Zhang, S. Leng, and C. Diao. 2013. “Establishing and Assessing the Integrated Surface Drought Index (ISDI) for Agricultural Drought Monitoring in Mid-Eastern China.” International Journal of Applied Earth Observation and Geoinformation 23: 397–410. doi: 10.1016/j.jag.2012.11.003
- Zargar, A., R. Sadiq, B. Naser, and F. I. Khan. 2011. “A Review of Drought Indices.” Environmental Reviews 19 (1): 333–349. doi: 10.1139/a11-013
- Zhang, L., W. Jiao, H. Zhang, C. Huang, and Q. Tong. 2017. “Studying Drought Phenomena in the Continental United States in 2011 and 2012 Using Various Drought Indices.” Remote Sensing of Environment 190: 96–106. doi: 10.1016/j.rse.2016.12.010
- Zhang, J., Q. Mu, and J. Huang. 2016. “Assessing the Remotely Sensed Drought Severity Index for Agricultural Drought Monitoring and Impact Analysis in North China.” Ecological Indicators 63: 296–309. doi: 10.1016/j.ecolind.2015.11.062
- Zhang, Q., X. Zou, and F. Xiao. 2006. Classification of Meteorological Drought. GB/T20481-2006. Beijing: Standards Press of China.
- Zhou, L., J. Wu, J. Zhang, S. Leng, M. Liu, J. Zhang, L. Zhao, F. Zhang, and Y. Shi. 2013. “The Integrated Surface Drought Index (ISDI) as an Indicator for Agricultural Drought Monitoring: Theory, Validation, and Application in Mid-Eastern China.” IEEE Journal of Selected Topics in Applied Earth Observations and Remote Sensing 6: 1254–1262. doi: 10.1109/JSTARS.2013.2248077