
 ?Mathematical formulae have been encoded as MathML and are displayed in this HTML version using MathJax in order to improve their display. Uncheck the box to turn MathJax off. This feature requires Javascript. Click on a formula to zoom.
ABSTRACT
With the increased frequency of natural hazards and disasters and consequent losses, it is imperative to develop efficient and timely strategies for emergency response and relief operations. In this paper, we propose a cyberGIS-enabled multi-criteria spatial decision support system for supporting rapid decision making during emergency management. It combines a high-performance computing environment (cyberGIS-Jupyter) and multi-criteria decision analysis models (Weighted Sum Model (WSM) and Technique for Order Preference by Similarity to Ideal Solution Model (TOPSIS)) with various types of social vulnerability indicators to solve decision problems that contain conflicting evaluation criteria in a flood emergency situation. Social media data (e.g. Twitter data) was used as an additional tool to support the decision-making process. Our case study involves two decision goals generated based on a past flood event in the city of Austin, Texas, U.S.A. As our result shows, WSM produces more diverse values and higher output category estimations than the TOPSIS model. Finally, the model was validated using an innovative questionnaire. This cyberGIS- enabled spatial decision support system allows collaborative problem solving and efficient knowledge transformation between decision makers, where different emergency responders can formulate their decision objectives, select relevant evaluation criteria, and perform interactive weighting and sensitivity analyses.
1. Introduction
A highly responsive decision-making process based on comprehensive and timely information is critical for emergency managers, planners, first responders, voluntary agency coordinators, and other professionals in the event of hazards and disasters. For example, a well-formed decision-support system can help a community better respond to and recover from a hazard event. Conversely, poor decision making may potentially result in unexpectedly severe casualties and mounting costs (FEMA Citationn.d.a). Therefore, a decision support system plays an essential role in emergency management.
Facilitating the decision-making process during an emergency response can, however, be a challenging task. Disaster responders often need to make quick decisions in complex situations that involve multiple and even conflicting objectives under time stress. The decision goal is usually achieved through an inquiry into a series of spatial questions closely tied to decision objectives and their associated evaluation criteria based on diverse socioeconomic and demographic conditions. In general, the primary goal of emergency management is to protect the health and safety of people (FEMA Citationn.d.a). If a limited amount of rescue resources is available, rescue personnel need to prioritize interventions at the most vulnerable locations ahead of other locations to save more lives and property, which raises the question: where are vulnerable groups of people in a disaster? The second goal of emergency management is to protect property and the environment, as well as to minimize the disruption of community activities (FEMA Citationn.d.a). To meet this goal, governmental organizations would be interested in knowing which area had the greatest economic loss and needs the most significant financial support after a disaster event. Here, risk is defined as the interaction between hazard and vulnerability (Blaikie et al. Citation2004), where vulnerability is the potential to suffer loss or harm (Cutter Citation1996).
Geographical Information Systems (GIS) provides the technical capability to help a decision maker in understanding interdependencies between spatial, socioeconomic, and cultural factors in decision-making processes (Sugumaran and Degroote Citation2011). However, most conventional GIS approaches lack support for taken into account domain experts’ knowledge and decision-making capabilities, which weakens their ability to enable decision processes dealing with conflicting objectives (Hendriks and Vriens Citation2000). Advances in decision-making theories and GIS capabilities have provided opportunities for the development of Multi-Criteria Spatial Decision Support Systems (MCSDSS). Additionally, GIS can provide capabilities for storing, managing, analyzing, and visualizing geospatial data. Multi-criteria analyses offer a rich collection of decision techniques for structuring problems that contain conflicting objectives and enabling the prioritization of decision alternatives and sensitivity analyses.
Various types of MCSDSS has been developed to support decision making in environmental hazard and emergency management. Malczewski (Citation2006) classified GIS-based multiple-criteria decision-making analyses (GIS-MCDM) into two categories: decisions under conditions of certainty and those under uncertainty. Brito and Evers (Citation2016) conducted a literature survey on using MCDM for flood risk management. From 1995 to 2015, there were 180 articles published on this topic, among which 22% of the articles focused on ranking alternatives for flood mitigation, 15% on vulnerability assessment, and 3% on emergency management. The rest of the articles are related to the topics of risk and hazard assessment, susceptibility assessment, coping capacity, and reservoir flood control. Wang et al. (Citation2011) proposed a spatial multi-criteria approach for flood risk assessment in the Dongting Lake region. Karnatak et al. (Citation2007) developed a web-based multicriteria spatial decision analysis application. Mitra et al. (Citation2017) proposed a multi-criteria decision support system that was based on a Bayesian network approach for analysing landslide risk assessment. Zhang et al. (Citation2014) developed a fuzzy multiple-attribute decision-making model to identify the vulnerability of an urban area based on population information. In their model, expert knowledge was collected using a questionnaire combined with a fuzzy modeling approach.
However, most of the aforementioned studies are subject to several limitations. First, decision criteria as well as their weights are often difficult to identify and quantify. Despite the uncertain nature of decision processes, some MCSDSSs do not allow a sensitivity analysis to quantify output uncertainties, and weights are often collected from engineers or system developers rather than domain experts. Second, current MCSDSSs are incapable of facilitating knowledge sharing and communication among different decision makers. In MCSDSS, decisions are often made by a group of decision makers such as domain experts, engineers, system developers, and users with diverse backgrounds, skills, and different preferred terminologies (Turban, Aronson, and Liang Citation2000). These various users contribute to a synergistic and complex decision space. Thus, how the knowledge can be collected, represented, and transferred between different decision makers promptly under time stress is extremely important to emergency management. Third, knowledge, often derived from geospatial data, comes from various data sources with different formats and scales, leading to tremendous computational challenges (Yang et al. Citation2017). Therefore, cyberGIS is needed in a MCSDSS to provide high-performance computation support during an emergency, for tasks such as fast data queries and information visualization (Lin et al. Citation2015).
In this article, we demonstrate a cyberGIS-enabled MCSDSS that can be used to model two decision goals in emergency management mentioned above (FEMA Citationn.d.a). This research considers a flooding case in Austin that happened on 31 October 2013, and combines several data sources such as census data, social media data, and a flood hazard map. In our MCSDSS, domain experts are also users, and a Simple Multi Attribute Rating Techniques (SMART) form is implemented in the user interface to help the domain experts select relevant criteria and generate weights. Weighted Sum Model (WSM) and Technique for Order Preference by Similarity to Ideal Solution (TOPSIS) models are used to combine the relevant criteria along with the criteria weights, and analysis results are interactively visualized on a map. Finally, a sensitivity analysis is performed to evaluate the sensitivity of selected criteria, and a questionnaire was developed to validate the results of the decision analysis. In order to address the above mentioned first and second challenges, our decision support system can facilitate knowledge transformation between different decision makers efficiently, since domain experts (users) can formulate their decision objectives, select relevant evaluation criteria, and perform weighting and sensitivity analysis by using an interactive user interface. The weight of the criteria can be directly generated by a group of domain experts through the user interface. Furthermore, our decision support system is implemented on a cyberGIS-Jupyter platform, which leverages a Jupyter notebook, Docker containers, cloud-based infrastructure provisioning, and high-performance computing. Furthermore, it allows diverse data sources (e.g. census data and social media data) to be integrated into the system and visualized onto an actionable vulnerability map to support spatial decision making. The current implementation of the spatial decision support system, as described in the remainder of this paper, can produce a near real-time vulnerability map depicting the highest overall vulnerability value within a study area during the flooding event.
2. Background and theory
This section provides a theoretical background of key concepts used in this research. It includes various types of vulnerability indicators, spatial decision support systems, multi-criteria decision-making techniques, and decision-making sensitivity analyses.
2.1. Social vulnerability indicators for emergency management
In the context of social sciences, vulnerability often refers to a condition of people as opposed to physical structures, economies, or regions of the earth (Wisner et al. Citation2004; Juntunen Citation2006). Inhabitants with higher social vulnerability seem to suffer more significantly from a disaster compared to those with lower vulnerability (Brouwer et al. Citation2007). In this respect, social vulnerability can be used as an important indicator/tool to evaluate the disaster preparedness of local communities, dispatch emergency responses, and allocate limited resources for disaster relief. Federal agencies, such as Centers for Disease Control and Prevention (CDC) and National Oceanic and Atmospheric Administration (NOAA), have adopted social vulnerability indices to map and identify vulnerable communities that may need support before, during, and after a hazard event. Commonly, an index system, based on a weighted linear combination of relevant variables, is used to develop social vulnerability indicators. For example, the pioneering work by Cutter, Boruff, and Shirley (Citation2003) defines the Social Vulnerability Index (SoVI) using 11 independent factors derived from 42 variables based on a factor analytic approach. Flanagan et al. (Citation2011) developed another social vulnerability index (SVI) based on the percentile ranks of 15 census variables at the census tract level with the goal of improving all 4 phases of the disaster management, including preparedness, response, recovery, and mitigation. Bjarnadottir, Li, and Stewart (Citation2011) proposed a Coastal Community Social Vulnerability Index (CCSVI) to project the social vulnerability of hurricane-prone areas under climate change scenarios by combining both intensities of climate-induced hazard factors and various social characteristics. Various types of social vulnerability indicators for disaster management have been developed in literature, such as family structures (Cutter, Boruff, and Shirley Citation2003), education (Morrow Citation1999; Cutter, Boruff, and Shirley Citation2003), socioeconomic status (Rygel, O’sullivan, and Yarnal Citation2006; Collins and Bolin Citation2009), employment (Cutter, Boruff, and Shirley Citation2003), age (Morrow Citation1999; Cutter, Boruff, and Shirley Citation2003; Rygel, O’sullivan, and Yarnal Citation2006), race and ethnicity (Cutter, Boruff, and Shirley Citation2003; Rygel, O’sullivan, and Yarnal Citation2006), and gender (Rygel, O’sullivan, and Yarnal Citation2006). In addition to the social vulnerability indicators, the availability of motor vehicles will affect the rescue route planning. People with motor vehicles can quickly drive away from the risk area during certain disasters. Social indicators can be developed based on several aspects for disaster management. Fenton and MacGregor (Citation1999) identified five classes of social indicators: informative indicators, predictive indicators, problem-oriented indicators, program evaluation indicators, and target delineation indicators. King and MacGregor (Citation2000) claimed that social vulnerability indicators could be developed based on the aspects of vulnerability and resilience of communities that affected by a disaster. For instance, low income households can be an indicator of vulnerability and high-income households can be an indicator of resilience, and rank trades occupations are more important for resilience than highly paid ones. Community vulnerability and resilience can be further divided into social, economic and demographic characteristics and attributes, behavior and values, which become a separate construct that is indicated by the set of social vulnerability indicators. A review of relevant literature indicates that the commonly used methods for constructing social vulnerability include Analytical Hierarchy Process (AHP), Principal Component Analysis (PCA), and Geographic Information Systems (GIS), which help to identify, manage, and visualize social vulnerability indices in specific geographical areas (Tate Citation2012; Frigerio et al. Citation2016; Frigerio and De Amicis Citation2016).
However, social vulnerability assessment in emergency management currently faces several challenges due to its uncertain and complex nature. First, the social vulnerability index system is difficult to construct, since it is often based on emergency responders’ subjective experiences. Emergency management can be considered as a set of collaboration processes among various types of emergency responders, such as fire and rescue departments, emergency medical crew, transportation agencies, and insurance companies, with varying decision criteria and foci. Emergency management requires effective collaboration and coordination among multiple parties and objectives, that may lead to overlapping disaster response efforts, ineffective communication, and poor coordination. The second challenge is to assign weights to the social vulnerability indices for evaluating the vulnerability of an area in a case of any disaster. Emergency responders should create their own decision objectives and assign weights to the indicators according to their professional responsibilities. However, this raises the question of how emergency responders’ knowledge can be collected and represented in geospatial modeling processes to efficiently support spatial decisions. Human knowledge exists in a compiled format while computers require information to be represented in a structured way (Turban, Aronson, and Liang Citation2000).
2.2. Use of social media in emergency management
In addition to social vulnerability indicators, social media data (e.g. Twitter) has been often used to model communication behaviors of disaster responders to improve situational awareness in emergency management. Social media channels allow for quick dissemination of information during a crisis, as well as two-way communication between members of the public and emergency management organizations (Goodchild and Alan Glennon Citation2010). Chatfield, Scholl, and Brajawidagda (Citation2013) used Twitter as a warning tool in natural disasters. Kryvasheyeu et al. (Citation2016) found that there was a correlation between the number of tweets mentioning hurricane Sandy and the time when the hurricane landed in the continental United States. Schnebele and Cervone (Citation2013) found that the magnitude of the Calgary flood had a similar pattern to the location of flood related tweets. Li et al. (Citation2018) developed a kernel-based flood mapping model to map the flooding possibility for the study area based on the water height points derived from tweets and stream gauges. Kongthon et al. (Citation2012) classified the flood-related tweets into four major categories: situation announcements and alerts, support announcements, requests for assistance, and requests for information. Most of these situational tweets were tweeted by local citizens who knew what had been happening during a disaster situation. This raises the question of how social media could help to improve communications between emergency management organizations and citizens. Therefore, there is a need to establish a disaster-related social media channel and mapping application, so citizens can provide more detailed or accurate information to assist authorized agencies during emergency incidents.
ATXfloods is an online application for collecting real-time flood information and mapping emergency road closures in Austin. Austin city has also Twitter channel, which displays the content of tweets that are related to Austin flood events (@ATXfloods)(Twitter Citation2018a). Similarly, Federal Emergency Management Agency (FEMA) also provides a Twitter channel, which supports communication between citizens and first responders before, during, and after an emergency (Twitter Citation2018b). Here, Twitter data is used as a communication tool in applications where the spatial context is ignored. For instance, it is not obvious as to where people might request assistance.
2.3. Spatial decision support systems
Decision support systems (DSSs) have many definitions. Turban, Aronson, and Liang (Citation2000) identified four key components of DSSs: a data management system (e.g. a database management system), a management subsystem (quantitative models that provide the system with analytical capabilities and software management), a knowledge-based management subsystem (an intelligent knowledge base that stores knowledge that can be used to make decision), and an interface subsystem (the user communicates with the DSS through this subsystem). According to above mentioned definitions of DSSs, a spatial decision support system (SDSS) can be defined as a framework for integrating analytical and spatial decision modeling capabilities (management subsystem), spatial and non-spatial data management (data management system), domain knowledge (knowledge acquisition and knowledge-based management system), spatial display capabilities and reporting capabilities (user interface) (Sugumaran and Degroote Citation2011). The next section introduces two types of decision-making models that were used in our MCSDSS management subsystem.
2.4. Multi-criteria decision making (MCDM)
A variety of GIS analytical methods have been developed to help decision-makers solve spatial decision-making problems with multiple criteria. The WSM is the earliest and probably the most widely used method (Fishburn Citation1967). The weighted product model (WPM) can be considered a modification of the WSM and has been proposed in order to overcome some of its weaknesses. The analytic hierarchy process (AHP), as proposed by Saaty (Saaty Citation1980, Citation2008), is a later development that has recently become increasingly popular. Belton and Gear (Citation1983) suggested a modification to the AHP (which we will call the revised AHP) that appears (as it is demonstrated in later chapters) to be more consistent than the original approach. Some other widely used methods are the ELECTRE and the TOPSIS methods (Hwang and Yoon Citation1981).
MCDM analysis is a mathematical decision-making framework where many decision criteria are combined to meet one or several objectives to give support for decision making. Given a set of m alternatives, denoted as A1, A2, A3, … , Am, and a set of n decision criteria, denoted as C1, C2, C3, … , Cn, it is assumed that the decision maker (DM) has to determine the performance value aij (for i = 1, 2, 3, … , m and j = 1, 2, 3, … , n) of each alternative in terms of each criterion. A matrix A with aij values is defined, along with the criteria weight Wj (the weight of the relative performance of the decision criteria). Usually, these weights are normalized to add up to one. Finally, the alternatives are ranked.
2.4.1. Weighted sum model
If there are m alternatives and n criteria, the best alternative is the one that satisfies (in a maximization case) the following expression:(1)
(1) Where A is the WSM score of the best alternative, n is the number of decision criteria,
is the actual value of ith alternative in terms of the jth
criterion, and
is the weight or importance of the jth
criterion.
2.4.2. Technique for order preference by similarity to ideal solution (TOPSIS)
The TOPSIS technique is based on the concept that the best alternative is the one that is closest to its ideal solution and farthest from the negative ideal solution (Behzadian et al. Citation2012). The formal TOPSIS procedure is defined as follows:
Step 1: Calculate normalized rating for each element in the decision matrix.
Step 2: Calculate weighted normalized ratings. The weighted normalized value
is calculated through this formula
Step 3: Identify the positive ideal
Step 4: Calculate separation measures. The separation between alternatives can be measured by n dimensional Euclidean distance. The separation of each alternative from the positive idea solution is given by
Step 5: Calculate similarities to ideal solution.
Step 6: Rank preference order. Choose an alternative with maximum
2.5. Sensitivity analysis
Sensitivity analysis is a critical component of MCDM, which evaluates how changes in the entire vector of a decision matrix (or changes in the current weights of the decision criteria) may change the ranking of the alternatives. One important step of sensitivity analysis is to identify critical criteria and then, if needed, to re-evaluate the weights for the criteria. For the current study, we consider critical criteria to be the criterion whose weight change may change the ranking of any alternative. In this case, the criticality degree of criteria is the smallest percent amount by which the current value of wk (weight of criteria Ck) must change, such that the existing ranking of the alternatives will change. An illustrative example of this calculation is available in Triantaphyllou (Citation2000).
3. Methods
This section introduces data collection and processing techniques and methods used in this research. Various types of data have been used in this research such as Austin city census data, a flood hazard map, and Twitter data collected using the Twitter API. MCDM WSM and TOPSIS models are used as core methodologies in the MCSDSS management subsystem to combine different criteria to produce an overall vulnerability map.
3.1. Data collection and processing
The data used in this research comes from three data sources. Austin city census data was downloaded from the TIGER Geodatabase and American Fact Finder from United States Census Bureau (United States Census Bureau Citation2017). Census data was collected at the block group level for attributes on the age, sex, educational attainment, poverty, income, housing characteristics, and health insurance status. In this study, the following criteria are used to evaluate the vulnerability of people affected by the flood hazard: total population in an area, number of people over 75 years old, number of people without health insurance, number of people in poverty, number of people in a minority group, area median house value, population education attainment, number of children, people without a vehicle, and the number of tweets that are relevant for the flooding event. While most social vulnerability research (as discussed earlier) includes more vulnerability indicators, in this study we considered a smaller set of indicators to demonstrate our MCSDSS. Our proposed system is also flexible enough to incorporate more vulnerability indicators as considered important for particular hazard or geographic context. In addition to census data, a flood hazard map layer was downloaded from FEMA’s flood map service center portal (FEMA Citationn.d.b).
We collected Twitter data through the Twitter API over five years (2012–2017) for the continental United States, and the data has been used for many research projects. The collected Twitter data contains 2 billion tweets (about 4TB), which poses significant computational intensive challenges for traditional GIS computing environments. To resolve this challenge, we used the cyberGIS-Jupyter environment that deployed on the first cyberGIS supercomputer ROGER (Wang Citation2016; Yin et al. Citation2017). Geographical and geospatial information sciences have been undergoing dramatic digital transformations, which has fueled the development of cyberGIS as a new generation of geospatial information sciences and systems (GIS) based on advanced cyberinfrastructure during the recent decade (Wang Citation2016). CyberGIS-Jupyter is a new type of cyberGIS gateway platform that provides interactive, flexible, and reproducible GIS interfaces to advanced cyberinfrastructure. It organically synthesized Jupyter notebooks, containerization, cloud computing, data-intensive computing, and high-performance computing, which grants easy access to the power of advanced cyber-infrastructure inside the user-friendly notebook interfaces. To process the Twitter data, we used the Hadoop functionality of cyberGIS-Jupyter to first filter all tweets within the bounding box of Austin (–98.230, –97.279, 29.986, 30.678) from the whole set of US tweets and retrieve 23,802,637 tweets (about 14GB) inside the Austin area. The next step is to develop a strategy in finding suitable keywords that can be used to filter the Twitter data and identify tweets that are related to flooding events, such as reporting the flooding situation of a location or asking for rescue help during flooding events.
First, we selected Tweets tweeted during flooding events that occurred between October 30th and November 6th in 2013 and 2015, and August 25th through 1 September 2017, which contain the key word ‘flood’. This query resulted in 806 tweets, a large number of tweets with a variety of relevant and non-relevant content. For instance, the filtered data contained many false flooding related tweets (e.g. ‘Can the flood warnings be any more annoying on the iPhones’, ‘I’m getting really annoyed of these flash flood warnings on my tv and phone … I get it already’), which are not useful for our case. Therefore, ‘flood’ may not be the best keyword for filtering the data. After that, we combined the keywords ‘flood’ to filter the data. For the ‘flood rescue’ keywords, this resulted in 18 filtered tweets where 6 of them are relevant. Many of other tweets that are related to flooding events were taken from a local news channel’s Twitter feed (http://www.topix.com/austin), and so are not tweets from local residents.
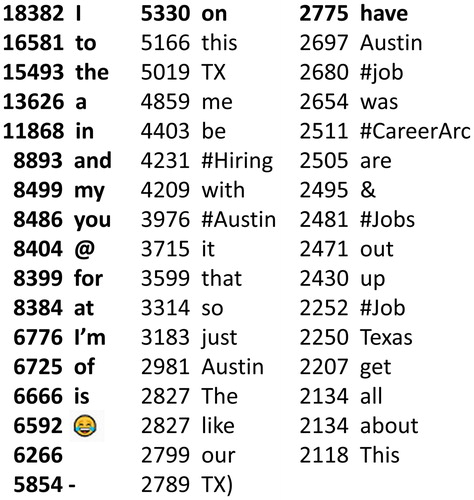
In the next step, we selected all Tweets in Austin that happened during the same flooding events and sorted words according to their frequency of appearance in the selected Tweets. By doing so, we are able to see which words are most often used during flooding events. The analysis result is illustrated in , where the numbers represent number of tweets that contain the corresponding key word. These results indicate most of the frequently appearing key words (with more than 2118 tweets) are not related to flooding. During this time period, some career channels had been actively using Twitter for advertising. Therefore, the key words ‘Hiring’, ‘#Jobs’, and ‘CareerArc’ have received high ranks.
Figure 1. Frequency of keywords in tweets during the flooding events.
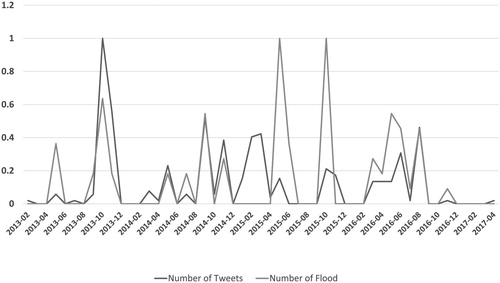
The NOAA storm events database contains comprehensive and detailed information on major climatic events from January 1950 to November 2017, as entered by NOAA's National Weather Service (NWS). This database was used to search for flood events that occurred between January 2012 and December 2017 in Travis County (NOAA Citation2018). Search results indicate 88 flood events were recorded with $122.1 million in total property damages. The City of Austin has created a Twitter channel @ATXflood to support communication before, during and after a flood emergency. Therefore, the keyword @ATXflood might be more reasonable to use for filtering the data than using the above-mentioned methods (e.g. using the keyword ‘flood’ or ‘flood rescue’). The tweets that exactly contained the ‘@ATXflood’ keyword were selected, 305 tweets in total. Each tweet contains geospatial coordinates and a timestamp, which is treated as a user’s activity at that point. After that, the normalized number of flood events data were plotted together with the normalized number of tweets to observe the spatiotemporal correlation between them (). A positive relationship occurs during 2013 except from June to August, in 2014 from April to December, in 2015 from April to May and from September to November, and most of the time in 2016. After that, we computed the correlation coefficient between number of the @ATXflood tweets and number of flood events. The overall correlation coefficient is 0.52, which indicates a moderate positive correlation, meaning people use @ATXflood channel to tweet more frequently during flooding events than other times. Therefore, it is reasonable to include @ATXflood Twitter data in the flood emergency decision process as we have implemented in our proposed MCSDSS.
Figure 2. Relationship between the number of Tweets from the @ATXflood channel and the number of flood events in Travis County.
3.2. Case study
Austin city has experienced serious flooding problems throughout its history. Since the late 1970s, the federal government has paid out $54 million for flood claims in Austin and $43 million more in the rest of Travis County (Price Citation2016). To present the MCSDSS, this research considers a flooding case in Austin that happed on 31 October 2013. The neighborhoods near Austin-Bergstrom International Airport were overwhelmed when water from the nearby Onion Creek surged past its banks and rolled into their streets, filling homes within minutes. The flood killed four people and damaged more than 1,200 homes (Jervis Citation2013). During this flooding event, there were 52 @ATXflood tweets, 178 tweets containing the ‘flood’ keyword, and 11 tweets with both the ‘flood’ and ‘rescue’ keywords captured. In the introduction section, we introduced two decision goals based on FEMA’s literature from the perspectives of emergency response and recovery (FEMA Citationn.d.a).
Decision goal 1: which area should rescue personnel go to first in order to save more lives? If the disaster occurs over a large area and the government has limited resources, rescue personnel need to prioritize interventions at the most vulnerable locations ahead of other locations in order to save more lives.
Decision goal 2: which area had the most significant economic loss and needs the greatest financial support to recover from a flooding event?
The structure of our cyberGIS-enabled MCSDSS is presented in . In this framework, knowledge for making decisions is collected through interactions between domain experts (users) and the user interface. The collected expert knowledge and geospatial data are stored in the knowledge base, which can be used as input for the model management system. The model management system includes two decision-making models that are used to combine multiple criteria values (social vulnerability indicators) for creating an overall vulnerability score for the decision goals. Each census block is considered as one alternative. For instance, the value for the variable in Equations (1) and (2) were generated using normalized social vulnerability indicator values attached to each block. A weight was simulated using the Simple Multi Attribute Rating Techniques (SMART), which assigned an importance of 100 points to the most important criterion and the next-most-important criteria is assigned a number of points reflecting the ratio of relative importance to the most important dimension (Olson Citation1996). Furthermore, our decision support system application is designed to enable group decision-making capabilities, so that a group of decision-makers (DMs) can participate in the decision-making process and assign weights to the criteria simultaneously. In this research work, six GIS experts participated in simulating the weight for each criterion based on two decision goals. A weight matrix W was generated where d refers to the number of DMs and n refers to the number of evaluation criteria (). The final weights were calculated by averaging the value from each row in matrix W. Simulated weighting results are illustrated in . The weights were normalized to represent variable
in Equations (1) and (2). The area that has the highest (or maximum) overall value is considered as the recommended place for earliest intervention.
Figure 3. An overview of cyberGIS-enabled MCSDSS.
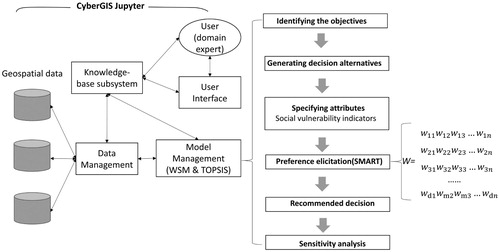
Table 1. Simulated weights for the evaluation criteria in perspectives of two decision goals.
4. Results
This section presents the results of the case study. Our cyberGIS-enabled MCSDSS user interface was implemented using the cyberGIS Jupyter computing platform. illustrates the user interface of the implemented system. It contains several layers, such as a flood hazard layer and a Twitter layer that the DM can switch on or off. In this article, the Twitter layer is used as an additional decision support tool added on the top of the decision model. The decision maker can use this tool to filter the Twitter data using different keywords. In this article we used three keywords sets: ‘@ATXflood’, ‘flood’, and ‘flood’ combined with the keyword ‘rescue’. The filtered results are illustrated in (A–C) respectively. In the future, this decision support tool can be developed further so the decision maker can enter any keyword of interest and interactively observe the filtered results on the map. In (C), the blue pinpoint on the map represents a single tweet with content mentioning ‘flood’ and ‘rescue’ during the flooding event. If multiple tweets are geographically close to each other, they are grouped and visualized as clusters on the map with the number indicating the count of tweets in that region (see (A and B)). The user can zoom in and out on the map and click on the blue pinpoint to see the tweet contents. This application is capable of visualizing flood-related tweets in real time, and thus help emergency management organizations identify areas and locations of people that are at risk.
Figure 4. The cyberGIS-enabled MCSDSS user interface.
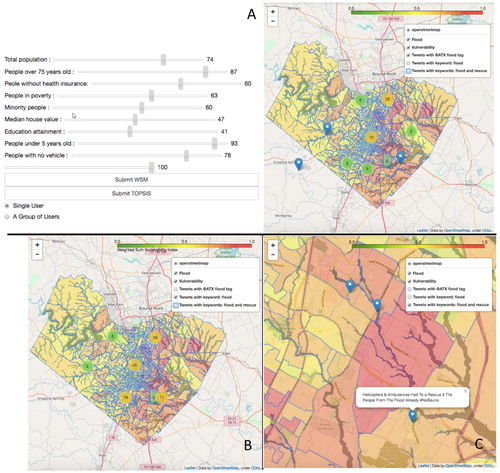
The left side of the (A) illustrates the weighting slider, which can be used to assign weights to the criteria that are relevant to the decision goals. If the DM selects the option ‘using weight from a single user’, the vulnerability map will be generated based on the single submitted list of weights. If the DM selects the option ‘using weight from a group of users’, the assigned weights will be first combined with a weight matrix stored in a common accessible file managed by the CyberGIS-Jupyter notebook. This weight matrix has the weight information previously submitted by other DMs in the same group, and it will be updated based on the latest submitted weight. After that, the weight will be averaged and normalized to generate the final weight to produce an overall vulnerability map.
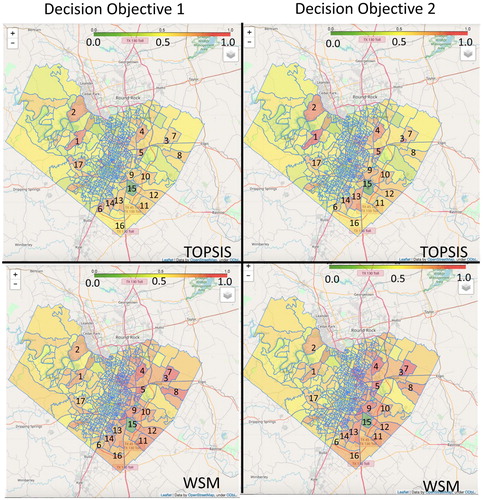
The weights illustrated in resulted in a vulnerability index map shown in . For the first decision goal, both models show block numbers 1, 4, and 5 received high vulnerability values, and rescue personnel should go there first in order to save more lives in an emergency situation. Most of the blocks that received middle-high category overall values in the TOPSIS model received the highest overall values in the WSM. Block numbers 1, 2, 17, and 6 received high overall values in the TOPSIS model but lower vulnerability values in the WSM model. In addition, block number 15 received the low category for both maps. For the second decision goal, block numbers 3, 4, 5, 13 and 14 received the highest overall values for both maps, meaning those blocks may suffer the most economic loss and need the most financial support for post event recovery. Most blocks that received middle-high overall values in the TOPSIS model had high vulnerability value in the WSM. The opposite situation applied to block numbers 1 and 2. Generally speaking, WSM produces a wider range of values and higher output category estimations than the TOPSIS model. Block number 15 represents the Austin-Bergstrom international airport, which received a low vulnerability value for all the decision models. This can be caused by fewer people living in that area compared to the other blocks. However, there are 11 tweets contain ‘flood’ keyword near block number 15, and most of them are relevant tweets. In this case, the decision maker should not ignore this block due to the low vulnerability score produced by the decision models.
Figure 5. Vulnerability maps based on two decision-making models (WSM and TOPSIS).
Sensitivity analysis is performed to observe the sensitivity of the criteria, and the results are illustrated in . The values in represent the rank of criticality degrees of the criteria that are explained in section 2.3. For the first decision goal, the number of children and people without vehicles are the most sensitive criteria and median house value is the least sensitive criterion. It means that if the weight of people without vehicles is changed, even by a small value, the census block with the highest vulnerability values will most likely also change. In other words, the weight of people without vehicles should be carefully determined by experts in a real-world decision- making scenario. On the other hand, median house value is the least sensitive criterion so that the census block with the highest vulnerability index is not likely to be changed even if the weight of median house value is significantly increased or decreased. However, a big ranking difference between the two decision models appears for some of the criteria, such as the criteria of people without health insurance and the number of children. For the second decision goal, people without vehicles and insurance are the most sensitive criteria, and population education attainment and the area median house value are the least sensitive criteria. The number of children and people without health insurance criteria received the greatest and the second greatest ranking difference between the two decision models.
Table 2. Sensitivity analysis results.
Model validation has been challenging task for multicriteria decision analysis (Qureshi, Harrison, and Wegener Citation1999; Meyer et al. Citation2014). In this article, we used sensitivity analysis to check the stability of the decision model. Additionally, we developed a questionnaire to evaluate the decision model’s results. The questionnaire contains all the attribute information for 10 blocks, such as total population, number of children, people without a vehicle. The participants who have participated in the first questionnaire was asked to fill in the second questionnaire. The decision maker has to give a rank from 1 to 10, based on the given attribute information, where rank number 1 represents the most vulnerable block. This is similar to a real-life emergency situation, in that rescue personnel have to make the decision based on how well they know the area. All the participants said it was hard to rank the 10 blocks based on many given attributes, and there is a need to develop a multicriteria decision support tool to make the ranking easier. After that, these blocks were ranked based on the decision model’s vulnerability results and compared with the questionnaire results. By doing so, we can see how well the decision model’s results match decision makers’ rapid thinking in real life.
The model validation result is illustrated in . The error rate for each block was calculated using the absolute value of the difference between the decision model’s ranking results and the questionnaire’s ranking result and divided by the number of 10 (maximum value of the rank). After that the average error rate was calculated. According to the results, both WSM and TOPSIS models produced a over 40% error rate for the decision objective 1, and a smaller error rate (over 20%) for the decision objective 2.
Table 3. Model validation results.
5. Discussion
In this study, MCDM was used to combine different social vulnerability indicators to reach decision goals that are related to emergency management. While we used a limited set of indicators in this case study, more indicators, such as family income status, family structures, housing characteristics, and flood severity (e.g. rainfall intensity), can be included in our proposed MCSDSS in order to make this framework applicable for different kinds of disaster scenarios. The flexible structure and portability of this technology also make it quickly adaptable for any geographic context.
In this article, weights for different evaluation criteria were simulated by six GIS experts. However, the experts who participated in simulating the weights were not emergency management domain experts, therefore the results of the study cannot be used to answer the decision goals correctly in a real-world situation. In the future, real domain experts such as rescue operation officers or public agency professionals should use the application to generate weights in order to make the analysis results more accurate and realistic for an actual disaster scenario.
One objective of this work is to develop a software application that enhances the communication between citizens and emergency management organizations. Our application provides fine-grained location (or exact location) information for rescue personnel to evacuate people who need help during the disaster event using a Twitter data layer. For instance, rescue personnel can identify the areas and people at risk by observing the content of a tweet and its corresponding location on the map. Currently, we used three keyword sets to filter the tweets. In the future, text mining techniques can be embedded in the tool to categorize tweets (e.g. according to Kongthon et al. (Citation2012)’s work) in order to support different types of decision problems. For instance, this tool can be developed further so the decision maker can enter any keywords that they think are useful and interactively observe the filtered results on the map. Besides Twitter, this framework can be further expanded by incorporating other social media postings (e.g. Facebook, Instagram, Snapchat/Snap Map, etc.) to make it more useful for emergency responders and more accessible to wider audience.
In this application, our analysis is at the block group level, which is the finest-grained geographic level in U.S. Census where socio-economic data is reported. It would have been better if we could use the parcel level but enumerating data at that granular level will be a separate research project by itself. In this article, we are proposing a computational framework, and it can be implemented later by rescue organizations using more detailed data (e.g. parcel level data or their own rescue data, which might not be publicly available) to provide fine-grained location information.
Other important aspects of this application are ensuring consistent results or facilitating different actors in quickly reaching an agreement. WSM produces more diverse values and a higher output category estimation than the TOPSIS model. Simanaviciene and Ustinovichius (Citation2010) found that if the values of criteria differ by 10% from the average criterion value, the TOPSIS method is more sensitive than the WSM. In our case, for both decision objectives, both models produced consistent answer for some places that have high vulnerability. Both models provide interfaces (through weights) for trials and errors from decision makers. We used sensitivity analysis to check the stability of the decision model. Additionally, we developed a questionnaire to validate decision model’s results. As a result, both WSM and TOPSIS produced similar validation results for each decision objective. However, clear error differences appear between the two objectives. For instance, both models produced a higher error rate for the first decision objective, and a lower error rate for the second decision objective. Finally, the parameterization and evaluation of the models should depend on a panel of experts and decision makers following Delphi style approaches. For instance, if there are extremely limited rescue resources available, a decision maker might want to consider using the results that are produced by the TOPSIS model first since it produces fewer hot spots than WSM results.
6. Conclusion
In this article, we described a cyberGIS enabled decision support framework, which combines a high-performance geospatial computing environment (cyberGIS Jupyter), advanced multi-criteria decision analysis models, various types of social vulnerability indicators, and Twitter data to efficiently support spatial decision-making processes in emergency management. The advantages of this MCSDSS come from several perspectives. First, cyberGIS Jupyter enables collaborative big data analytics so various types of data sources can be integrated into the decision-making processes. Second, multiple and conflicting objectives are common decision problems in emergency management. In this study, two types of MCDM models (WSM and TOPSIS) were constructed, where many different criteria can be combined to meet one or several objectives and give support in decision making. Third, this framework supports group decision making and collaborative problem solving, which is important since emergency management requires effective collaboration and coordination among emergency responders. In this framework, emergency responders can work together to formulate decision objectives, select relevant evaluation criteria, and perform interactive weighting and sensitivity analysis. In addition, we developed an innovative way to use Twitter data to enhance communications between citizen and emergency management organizations, and therefore to improve the awareness of various spatial situations. For instance, this framework can support geo-visualization of near real-time Twitter data and help emergency organizations identify the areas and people that are at risk. Finally, the interactive user interface enables the expert knowledge of decision makers to be collected and incorporated to efficiently support spatial decision making for emergency management.
Acknowledgement
Any opinions, findings, and conclusions or recommendations expressed in this material are those of the authors and do not necessarily reflect the views of the National Science Foundation. We would like to acknowledge Mr Johnathan Rush and other members of the CyberGIS Center for Advanced Digital and Spatial Studies at the University of Illinois at Urbana-Champaign for their kind support and helpful inputs.
Disclosure statement
No potential conflict of interest was reported by the authors.
Additional information
Funding
References
- Behzadian, Majid, S. Khanmohammadi Otaghsara, Morteza Yazdani, and Joshua Ignatius. 2012. “A State-of the-Art Survey of TOPSIS Applications.” Expert Systems with Applications 39 (17): 13051–13069. doi:10.1016/j.eswa.2012.05.056.
- Belton, Valerie, and Tony Gear. 1983. “On a Short-Coming of Saaty’s Method of Analytic Hierarchies.” Omega 11 (3): 228–230. doi:10.1016/0305-0483(83)90047-6.
- Bjarnadottir, Sigridur, Yue Li, and Mark G. Stewart. 2011. “Social Vulnerability Index for Coastal Communities at Risk to Hurricane Hazard and a Changing Climate.” Natural Hazards 59 (2): 1055–1075. doi:10.1007/s11069-011-9817-5.
- Blaikie, Piers, Terry Cannon, Ian Davis, and Ben Wisner. 2004. At Risk: Natural Hazards, People’s Vulnerability and Disasters. Oxford: Routledge.
- Brito, M. M., and M. Evers. 2016. “Multi-Criteria Decision-Making for Flood Risk Management: A Survey of the Current State of the Art.” Natural Hazards and Earth System Sciences 16 (4): 1019–1033. doi:10.5194/nhess-16-1019-2016.
- Brouwer, R., S. Akter, L. Brander, and E. Haque. 2007. “Socioeconomic Vulnerability and Adaptation to Environmental Risk: a Case Study of Climate Change and Flooding in Bangladesh.” Risk Analysis 27: 313–326. doi: 10.1111/j.1539-6924.2007.00884.x
- Chatfield, Akemi Takeoka, Hans J. (Jochen) Scholl, and Uuf Brajawidagda. 2013. “Tsunami Early Warnings via Twitter in Government: Net-Savvy Citizens’ Co-Production of Time-Critical Public Information Services.” Government Information Quarterly 30 (4): 377–386. doi:10.1016/j.giq.2013.05.021.
- Collins, Timothy W., and Bob Bolin. 2009. “Situating Hazard Vulnerability: People’s Negotiations with Wildfire Environments in the U.S. Southwest.” Environmental Management 44 (3): 441–455. doi:10.1007/s00267-009-9333-5.
- Cutter, Susan L. 1996. “Vulnerability to Environmental Hazards.” Progress in Human Geography 20 (4): 529–539. doi:10.1177/030913259602000407.
- Cutter, Susan L., B. J. Boruff, and W. L. Shirley. 2003. “Social Vulnerability to Environmental Hazards.” Social Science Quarterly-Wiley Online Library 84: 242–261. https://onlinelibrary.wiley.com/doi/full/10.1111/1540-6237.8402002.
- FEMA. n.d.a. “Preparedness for emergency response, FEMA training.” https://training.fema.gov/hiedu/docs/fem/chapter 9 - preparedness for emergency response.doc.
- FEMA. n.d.b. “Flood Map Service Center: Welcome!” https://msc.fema.gov/portal.
- Fenton, D. M., and C. MacGregor. 1999. Framework and Review of Capacity and Motivation for Change to Sustainable Management Practices: Theme 6: Project 6.2.1., Social Science Centre. Canberra: Bureau of Rural Sciences.
- Fishburn, Peter C. 1967. “Methods of Estimating Additive Utilities.” Management Science 13 (7): 435–453. doi:10.1287/mnsc.13.7.435.
- Flanagan, Barry E., Edward W. Gregory, Elaine J Hallisey, Janet L. Heitgerd, and Brian Lewis. 2011. “A Social Vulnerability Index for Disaster Management.” Journal of Homeland Security and Emergency Management 8 (1). doi:10.2202/1547-7355.1792.
- Frigerio, Ivan, and Mattia De Amicis. 2016. “Mapping Social Vulnerability to Natural Hazards in Italy: A Suitable Tool for Risk Mitigation Strategies.” Environmental Science & Policy 63 (September): 187–196. doi:10.1016/j.envsci.2016.06.001.
- Frigerio, Ivan, Stefania Ventura, Daniele Strigaro, Matteo Mattavelli, Mattia De Amicis, Silvia Mugnano, and Mario Boffi. 2016. “A GIS-Based Approach to Identify the Spatial Variability of Social Vulnerability to Seismic Hazard in Italy.” Applied Geography 74 (September): 12–22. doi:10.1016/j.apgeog.2016.06.014.
- Goodchild, Michael F., and J. Alan Glennon. 2010. “Crowdsourcing Geographic Information for Disaster Response: A Research Frontier.” International Journal of Digital Earth 3 (3): 231–241. doi:10.1080/17538941003759255.
- Hendriks, Paul, and Dirk Vriens. 2000. “From Geographical Information Systems to Spatial Group Decision Support Systems: A Complex Itinerary.” Geographical and Environmental Modelling 4 (1): 83–104. doi:10.1080/136159300111388.
- Hwang, C. L., and K. Yoon. 1981. Multiple Attribute Decision Making: Methods and Applications. New York: Springer-Verlag.
- Jervis, Rick. 2013. “Historic flash flood leaves devastation in Austin.” USA Today. November 7. Accessed March 8 2018. https://www.usatoday.com/story/news/nation/2013/11/07/flash-flood-austin-residents-killed-displaced/3459181/.
- Juntunen, Lorelei. 2006. “Addressing Social Vulnerability to Hazards.” Disaster Saftey Review, TsuInfo Alert 4 (2): 3–10.
- Karnatak, Harish Chandra, Sameer Saran, Karamjit Bhatia, and P. S. Roy. 2007. “Multicriteria Spatial Decision Analysis in Web GIS Environment.” GeoInformatica 11 (4): 407–429. doi:10.1007/s10707-006-0014-8.
- King, David, and Colin MacGregor. 2000. “Using Social Indicators to Measure Community Vulnerability to Natural Hazards.” Australian Journal of Emergency Management 15 (3): 52–57.
- Kongthon, A., C. Haruechaiyasak, J. Pailai, and S. Kongyoung. 2012. “The Role of Twitter during a Natural Disaster: Case Study of 2011 Thai Flood.” In 2012 proceedings of PICMET ‘12: Technology Management for Emerging Technologies, 2227–2232.
- Kryvasheyeu, Yury, Haohui Chen, Nick Obradovich, Esteban Moro, Pascal Van Hentenryck, James Fowler, and Manuel Cebrian. 2016. “Rapid Assessment of Disaster Damage Using Social Media Activity.” Science Advances 2 (3): e1500779. doi:10.1126/sciadv.1500779.
- Li, Zhenlong, Cuizhen Wang, Christopher T. Emrich, and Diansheng Guo. 2018. “A Novel Approach to Leveraging Social Media for Rapid Flood Mapping: A Case Study of the 2015 South Carolina Floods.” Cartography and Geographic Information Science 45 (2): 97–110. doi:10.1080/15230406.2016.1271356.
- Lin, Tao, Shaowen Wang, Luis F. Rodríguez, Hao Hu, and Yan Liu. 2015. “CyberGIS-Enabled Decision Support Platform for Biomass Supply Chain Optimization.” Environmental Modelling & Software 70 (August): 138–148. doi:10.1016/j.envsoft.2015.03.018.
- Malczewski, Jacek. 2006. “GIS-Based Multicriteria Decision Analysis: A Survey of the Literature.” International Journal of Geographical Information Science 20 (7): 703–726. doi:10.1080/13658810600661508.
- Meyer, Spencer, Michelle Johnson, Robert Lilieholm, and Christopher Cronan. 2014. “Development of a Stakeholder-Driven Spatial Modeling Framework for Strategic Landscape Planning Using Bayesian Networks Across Two Urban-Rural Gradients in Maine, U.S.A.” Ecological Modelling 291 (10): 42–57. doi: 10.1016/j.ecolmodel.2014.06.023
- Mitra, Debashis, Chandrani Bhandery, Anirban Mukhopadhyay, Abhra Chanda, and Sugata Hazra. 2017. “Landslide Risk Assessment in Darjeeling Hills Using Multi-Criteria Decision Support System: A Bayesian Network Approach.” In Disaster Risk Governance in India and Cross Cutting Issues, Disaster Risk Reduction, 361–386. Singapore: Springer. doi:10.1007/978-981-10-3310-0_18.
- Morrow, Betty Hearn. 1999. “Identifying and Mapping Community Vulnerability.” Disasters 23 (1): 1–18. doi:10.1111/1467-7717.00102.
- NOAA. 2018. “Storm Events Database.” https://www.ncdc.noaa.gov/stormevents/details.jsp.
- Olson, David L. 1996. Decision Aids for Selection Problems. Springer Science & Business Media.
- Price, Asher. 2016. “In Texas Flash Flood Alley, problems extend beyond terrain.” MyStatesman, May 28 . Accessed Feb 13 2018. https://www.mystatesman.com/news/local/texas-flash-flood-alley-problems-extend-beyond-terrain/qTACYqmPbxCURBhCHUJ0JM/.
- Qureshi, M. E., S. R. Harrison, and M. K. Wegener. 1999. “Validation of Multicriteria Analysis Models.” Agricultural Systems 62 (2): 105–116. doi: 10.1016/S0308-521X(99)00059-1
- Rygel, Lisa, David O’sullivan, and Brent Yarnal. 2006. “A Method for Constructing a Social Vulnerability Index: An Application to Hurricane Storm Surges in a Developed Country.” Mitigation and Adaptation Strategies for Global Change 11 (3): 741–764. doi:10.1007/s11027-006-0265-6.
- Saaty, Thomas L. 1980. The Analytic Hierarchy Process. Vol. VI. The AHP Series. New York, NY: McGraw-Hill.
- Saaty, Thomas L. 2008. “Decision Making with the Analytic Hierarchy Process.” International Journal of Services Sciences 1 (1): 83–98. doi:10.1504/IJSSci.2008.01759 doi: 10.1504/IJSSCI.2008.017590
- Schnebele, E., and G. Cervone. 2013. “Improving Remote Sensing Flood Assessment Using Volunteered Geographical Data.” Natural Hazards and Earth System Sciences; Katlenburg-Lindau 13 (3): 669–677. doi:10.5194/nhess-13-669-2013.
- Simanaviciene, Ruta, and Leonas Ustinovichius. 2010. “Sensitivity Analysis for Multiple Criteria Decision Making Methods: TOPSIS and SAW.” Procedia Social and Behavioral Sciences 2: 7743–7744. doi: 10.1016/j.sbspro.2010.05.207
- Sugumaran, R., and J. Degroote. 2011. Spatial Decision Support Systems, Principles and Practices. UK: Taylor & Francis Group.
- Tate, Eric. 2012. “Social Vulnerability Indices: A Comparative Assessment Using Uncertainty and Sensitivity Analysis.” Natural Hazards 63 (2): 325–347. doi:10.1007/s11069-012-0152-2.
- Triantaphyllou, Evangelos. 2000. “Multi-Criteria Decision Making Methods.” In Multi-Criteria Decision Making Methods: A Comparative Study, Applied Optimization, 5–21. Boston, MA: Springer. doi:10.1007/978-1-4757-3157-6_2.
- Turban, Efraim, Jay Aronson, and Ting-Peng Liang. 2000. Decision Support Systems and Intelligent Systems. Seventh. New Jersey: Prentice Hall.
- Twitter. 2018a. “ATXfloods@ATXfloods.” https://twitter.com/atxfloods?lang=en.
- Twitter. 2018b. “FEMA @ fema.” https://Twitter.com/fema.
- United States Census Bureau. 2017. “Tiger Geodatabases.” https://www.census.gov/geo/maps-data/data/tiger-geodatabases.html.
- Wang, Shaowen. 2016. CyberGIS. In International Encyclopedia of Geography: People, the Earth, Environment and Technology. Hoboken, NJ: John Wiley & Sons.
- Wang, Yamei, Zhongwu Li, Zhenghong Tang, and Guangming Zeng. 2011. “A GIS Based Spatial Multi-Criteria Approach for Flood Risk Assessment in the Dongting Lake Region, Hunan, Central China.” Water Resources Management 25 (13): 3465–3484. doi: 10.1007/s11269-011-9866-2
- Wisner, Ben, Piers Blaikie, Terry Cannon, and Ian Davis. 2004. At Risk: Natural Hazards. People’s Vulnerability and Disasters. London: Routledge.
- Yang, Chaowei, Qunying Huang, Zhenlong Li, Kai Liu, and Fei Hu. 2017. “Big Data and Cloud Computing: Innovation Opportunities and Challenges.” International Journal of Digital Earth 10 (1): 13–53. doi: 10.1080/17538947.2016.1239771
- Yin, Dandong, Yan Liu, Anand Padmanabhan, Jeff Terstriep, Johnathan Rush, and Shaowen Wang. 2017. “A CyberGIS-Jupyter Framework for Geospatial Analytics at Scale.” In Proceedings of the Practice and Experience in Advanced Research Computing 2017 on Sustainability, Success and Impact, 18:1–18:8. PEARC17. New York, NY: ACM. doi:10.1145/3093338.3093378.
- Zhang, Zhe, Urška Demšar, Jaakko Rantala, and Kirsi Virrantaus. 2014. “A Fuzzy Multiple-Attribute Decision Making Modelling for Vulnerability Analysis on the Basis of Population Information for Disaster Management.” International Journal of Geographic Information Science 28 (9): 1922–1939. doi:10.1080/13658816.2014.908472.