
 ?Mathematical formulae have been encoded as MathML and are displayed in this HTML version using MathJax in order to improve their display. Uncheck the box to turn MathJax off. This feature requires Javascript. Click on a formula to zoom.
ABSTRACT
Population distribution modelling can benefit many different domains, for example, transportation, urban planning, ecology or emergency management. Information about the location and number of people in an affected area is crucial for decision-makers during emergencies and crises. Mobile phone data represents relatively reliable and time accurate information on real-time population distribution, movement and behaviour. In this study, we evaluate the spatio-temporal distribution of population derived from phone data of the selected pilot area (City of Brno, Czech Republic). Analysis is based on the dataset describing the estimated human presence (EHP) with two values – visitors and transiting persons. The temporal change of data is first analysed and further processed using two methodological approaches. First, the dasymetric method is used where the building geometry and technical attributes served as a target layer. Second, the results of building level analysis are transformed into a regular grid zone of both visitors and the general EHP. Resulting spatio-temporal patterns are compared to the census data. Results demonstrate how the proposed building level dasymetric approach can improve the spatial granularity of EHP. Potential use of proposed methodology within selected emergency situations is further discussed.
1. Introduction
Information about the location and number of people in an affected area is crucial for decision-makers in different fields such as transportation, urban planning, ecology or emergency management. Mobile phone data is relatively reliable and time accurate information about real-time and routine population distribution, movement and behaviour and can provide updated demographic data for risk assessments. This kind of information can also be of benefit in areas previously observed only infrequently and indirectly (Data-Pop Alliance Citation2017). Emergency management is generally understood as comprising several phases that roughly correspond to ‘before’ (preparedness), ‘during’ (response), and ‘after’ (recovery) phases of any event. The use of geographic knowledge and cartographic visualization during all these emergency phases requires high flexibility and depends on the dynamic nature of the situation, scope of decision-making and other user involvement (Kubíček et al. Citation2011).
Use of accurate data and information is crucial for minimizing loss of property and life during a crisis (Konečný and Reinhardt Citation2010). This study evaluates the population information derived from the phone data of the selected pilot area (city centre Brno, Czech Republic). The data are analysed and visualised using different methodological approaches. Results are compared to traditional demographic data sources and discussed.
Several research questions arise:
- What are the differences between the number of inhabitants declared by the official census and the number provided by the mobile phone data?
- What are the daily rhythms of mobile phone users in different administrative units?
- What is the spatio-temporal pattern of mobile phone users in these administrative units?
These research questions will be examined and discussed in relation to the mobile phone data available for the pilot area.
To maintain consistency with existing studies, the term Estimated Human Presence (EHP, Järv, Tenkanen, and Toivonen Citation2017) or population present (PP, Martin, Cockings, and Leung Citation2015) is used, which is a general term that can be defined as the sum of three categories:
- resident population (PR)
- non-resident population (PNR)
- transiting population (PT)
The term Building Estimated Human Presence (BEHP) is used in our paper for the sum of two categories that stay more than 30 minutes at the observed administrative unit:
- resident population (PR)
- non-resident population (PNR)
The word ‘building’ used in term symbolizes exclusion of PT category. These people are unlikely to be staying inside buildings but moving through the administrative unit on streets.
2. Related work
A review of existing research is presented in two separate discussions – one dealing with the technological background of mobile phone localization studies and the other analysing the potential of mobile phone data localization under emergency management.
2.1. Mobile phone data localization methods
Three elementary sets of mobile phone localization methods have been identified:
- Network -driven, non-intrusive. This method requires administration rights for the mobile network to localize a mobile phone. The operator of the mobile network then uses/sells aggregated data on user location, or even more typically, sells information and/or services based on user location and additional attributes rather than the obtained data.
- Device-driven, non-intrusive. In this method, a user agrees to the location of their mobile phone being tracked. It is typical when a user installs an application and agrees to the proposed permissions, such as localization. The application's administrator then receives information about the localization of a mobile phone. The business model is very similar to the first method and according to Verkasalo and Hämmäinen (Citation2007) is based on the hardware of individual phones (GNSS, WiFi, Bluetooth, or similar technologies).
- Third-party driven, intrusive. This method is based on tracking a mobile phone without the network administrator's or the mobile phone owner/user's permission. A false BTS (Base Transceiver Station) approach is used under this method. The third-party driven method is illegal in many countries around the world and should only be used with the permission of the relevant national authority.
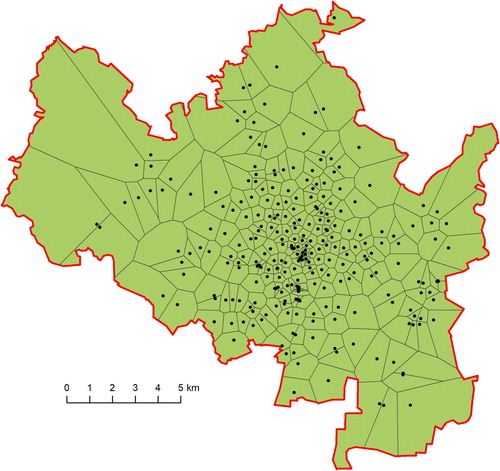
Starting with the network-based solutions, we can distinguish two categories – passive and active localization. The first category is based on georeferencing and aggregation of mobile network operational data (Pucci, Manfredini, and Tagliolato Citation2015). These are basically logs of communications between phones and mobile networks connected by calls, SMS, or data connection. Each activity is then recorded and can be further listed for users or base stations (BTS) as so-called Call Detail Records (CDR). Because of Cell ID (CI) parameters, each communication is positioned to a certain BTS (Dufková et al. Citation2008; Jonge, Pelt, and Roos Citation2012). GSM cells vary in spatial extent, being smaller and more detailed in urbanized areas and bigger in rural areas (Steenbruggen, Tranos, and Nijkamp Citation2015; Lískovec Citation2016, ).
Figure 1. GSM cells in the Brno city area. The spatial resolution of cells is highly variable, the most detailed being in the city centre (GSMWEB Citation2018).
Passive localization methods have recently opened new horizons for mobility studies or travel behaviour (Ahas et al. Citation2010; Gao Citation2015; Kang et al. Citation2012). Silm and Ahas (Citation2010) used this localization method to study seasonal variability of population in Estonian municipalities. Pucci, Manfredini, and Tagliolato (Citation2015) analysed everyday mobility (rhythmicity) of citizens in Lombardy (Italy). Similarly, Novák and Temelová (Citation2012) studied the everyday mobility of young people in Prague (Czech Republic). Čtyroký (Citation2017), also in Prague, attempted to optimize opening hours of public institutions, and Ouředníček et al. (Citation2018) delimited Prague's metropolitan area.
Extensive research based on mobile phone call detail records (CDR) was conducted in China. Mobile phone data is mostly used to analyse the patterns of the user distribution and behaviour. Through the ratio of users in the crowd, Kang et al. (Citation2012) use mobile phone data to estimate urban population. The mobile phone location data in Shenzhen has been used to reveal the diversity and heterogeneity of spatio-temporal distribution of human aggregated activities in urban space (Cao et al. Citation2017; Xu et al. Citation2015). Li and Zhou (Citation2015) explored how to obtain that data in the indoor situation.
Liu, Kang, and Wang (Citation2014) presents a generic workflow for big-data-driven (including mobile phone data) human mobility analyses and summaries major movement measures. Kang et al. (Citation2010) compute statistical characteristic of mobile phone usage, derive aggregated mobility patterns for millions of mobile phone users and individual mobility patterns for different groups which are divided by some selected social factors, such as gender and age. Ahas et al. (Citation2015) compare the time and space differences in daily activities in different cities, Yuan, Raubal, and Liu (Citation2012) try to use this pattern to analyse travel behaviour. Zhou et al. (Citation2015) use the understanding of user's behaviour to reverse the user's location. Gao (Citation2015) presented an analytical framework to explore human mobility patterns focusing on quantitative analytics to identify spatio-temporal patterns (hotspots). Also emphasizing the limitations of CDR data, he suggested the integration of phone calls with other more holistic data sources on human activity. In addition, based on mobile phone data and user behaviour patterns, conducted traffic flow analysis (Kang, Liu, and Wu Citation2017; Wu et al. Citation2012) and urban land use function recognition (Peng et al. Citation2018; Zhou et al. Citation2014).
These studies varied in space (municipalities, counties), time (day, week, and season) and resolution. Passive and active approaches have also been used to study different social granularity, ranging from personal sensing (following a personal SIM card), social/group sensing (Dufková et al. Citation2008; Novák and Temelová Citation2012), public/community sensing (Lane et al. Citation2010). Yuan and Raubal (Citation2016) used mobile phone data to analyse individual human behaviour, such as the dimensions of human activity space. They also focused on age group and gender data (of nine big cities in China) and attempted to correlate them with the urban environment and individual urban context.
2.2. Analysis of demands for mobile phone localization in emergency management
The potential use of mobile phone data for emergency management could be divided into three successive phases: emergency preparedness, emergency response, and disaster recovery. Emergency preparedness and disaster recovery units use passive techniques to detect mobile phones, for example, analysing patterns based on regular data measurements from mobile service providers, while emergency response requires ad-hoc data that are efficiently obtained through so-called active localization methods. Active methods are considered a ‘man-in-the-middle-attack’ and therefore cannot be generally used in most countries around the world without special permission. However, through this type of connection, emergency messages (e.g. SMS) may be sent to any or all mobile phone(s) in an affected area during an emergency. Řezník, Horáková, and Szturc (Citation2015) described an active method example for mobile phone localization using an International Mobile Subscriber Identity (IMSI) catcher and verified the methods in a field test.
Several case studies have already been published referencing the use of mobile phone data during the recovery phase of the recent earthquake in Haiti (Bengtsson et al. Citation2011; Řezník, Horáková, and Szturc Citation2015), flooding (Pastor-Escuredo et al. Citation2014), or dynamic population mapping (Deville et al. Citation2014). Oxendine et al. (Citation2014) discussed the use of non-authoritative data (including mobile phones and social media) for evacuation purposes and stressed the importance of such data for increasing situational awareness and the common operational picture. For instance, the example from Haiti demonstrated that an active method through an IMSI catcher may be installed and used within two hours of its delivery to the desired place (Řezník, Horáková, and Janiurek Citation2011; Řezník, Horáková, and Szturc Citation2015). Rescue work was coordinated according to the information on mobile phone positions; the ruins of buildings with mobile phones discovered within were explored for survivors first.
Emergency managers want population data at a finer spatial resolution than the level of administrative units. Fine resolution can be produced by various means using dasymetric modelling (Wright Citation1936; Martin Citation1996; Slocum Citation1999; Nagle et al. Citation2014). Dasymetric models increase the spatial resolution of population data by using the relationships between population distribution and ancillary geographic layers. Traditionally, this method further divides a homogenous administrative unit into separate units weighted by the probability of occurrence of citizens. Ancillary data commonly used for spatial pattern refinement include land cover (Mennis Citation2003), road density (Reibel and Bufalino Citation2005), LiDAR-based building heights (Xie Citation2006; Kressler and Steinnocher Citation2008), Corine Land Cover and Urban Atlas (Gallego Citation2010). A commonly mentioned study is the modelling and integration of population and ancillary data sources. However, these do not consider the temporal and other societal contexts of human presence in space.
Mobile phone data and its temporality can further address population modelling in this direction. Recently, Järv, Tenkanen, and Toivonen (Citation2017) presented a generic conceptual framework of a multi-temporal function-based dasymetric (MFD) interpolation method for mobile phone data. These authors introduced a raster-based stepwise methodology combining land use data for spatial disaggregation of target zones, time-dependant human activities for estimating human presence, and the integration of passive mobile phone data for final spatio-temporal reallocation by target zones.
Recently, a group of emergency management experts studied the emergency threats and vulnerabilities of the Czech Republic (Paulus et al. Citation2016) and identified and categorized the most topical emergency situations. From this analysis, 22 typological emergency situations were pinpointed. A detailed and typified plan for each emergency was defined, including the responsible public administrative organization and the spatial level on which the plans are used (central, regional, local). Challenges for mobile phone data were further discussed from both academic and practical perspectives.
The possibilities and limitations of using mobile phone data will be presented in examples from the Czech Republic. The number of mobile phones per household member aged 6+ in the Czech Republic in 2015 was 0.99 (CZSO Citation2017, 28). This means that mobile phone data could provide extremely fine and dynamic sources about large populations. The information available could be useful for designing evacuation routes, providing exposure maps sensitive to regular population movements such as daily or seasonal migrations, evaluating the effectiveness of early warning systems, or assessing the risk of disease outbreak following a disaster.
The demand for mobile phone data use in crisis management was initiated during ZONA Integrated Rescue System training (in 2015) when an emergency situation's context dealt with evacuating inhabitants from municipalities affected by a simulated nuclear power plant failure. Both paper and digital versions of the evacuation maps were prepared in advance (Stachoň et al. Citation2016). However, in planning the number of evacuation vehicles to be sent to various locations, a problem arose concerning the actual number of inhabitants in need of evacuation as some of these municipalities were traditional sleep-over areas with minimum population during working hours, while others were collocations of industrial zones, shopping centres, and educational facilities with a high concentration of inhabitants during working hours (Russnák and Herman Citation2017). Thus, census data used to roughly estimate numbers of inhabitants to be evacuated is inadequate and can underestimate or overestimate the actual spatial distribution of inhabitants.
3. Research design
3.1. Pilot area, data and methods
The central part of the City of Brno, with a high population density and distinct rhythmicity, was selected for the pilot study. The pilot area embraces several transportation hubs and includes all the main railway and coach stations as well as the most important city public transport stations. Most of the city's historical monuments are also concentrated here. It is a transit zone for many daily commuters and other visitors. The big retail centres are in the southern and western parts of the pilot area (Binek et al. Citation2017, 6).
Brno is dealing with the problem of an underestimated population size in the official statistical data sources. An available research report (Seidenglanz, Toušek, and Chvátal Citation2013) shows the differences between official census data and the estimated current population at the city level (). The non-registered population in Brno comprises Czech citizens and foreigners living in Brno without registration, university students and homeless persons (Seidenglanz, Toušek, and Chvátal Citation2013, 3). Indicators from the Ministry of Education, Youth and Sports of the Czech Republic show that nearly 65,000 students were attending universities in Brno in 2018 (https://data.brno.cz/graf/pocet-studentu-vs/). Most of them were part of the non-registered population of Brno. A large percentage of the current population comprises daily commuters (to work, school, services etc.) and visitors.
Table 1. Differences of the population between census data and current estimated population. The numbers for 2020 were estimated in a demographic analysis. Adapted from Seidenglanz, Toušek, and Chvátal (Citation2013, 26).
For a more detailed spatial and demographic granularity, one source of mobile phone data is freely available in the Czech Republic. Mobile operator O2 has recently published two alternative mobile phone datasets through the Liberty API (Application Programming Interface). While MAPI (‘the mobility API’) gives information about the number of people moving between two locations (basic settlement units), SDAPI (‘the socio-demographic API’) shows the gender and age structure of people who were present at the basic settlement unit. The source of this data is the O2 mobile network, but data is further extrapolated to the entire population of the Czech Republic considering O2's market share. SDAPI aggregates the number of mobile phone users into specific gender groups, provides gender differentiation, and defines two basic types of mobile phone user:
- visitors (PR+PNR) – those who stay more than 30 minutes at the observed administrative unit). This type is equal to BEHP value in this paper.
- transiting persons (PT) – those staying less than 30 minutes
The availability of SDAPI mobile phone data is limited to just one day (24 hours) a week (Sunday 21:00–Monday 21:00) in segments of one hour. Values falling under 100 mobile phone users in an age group are omitted to maintain the differential privacy of users.
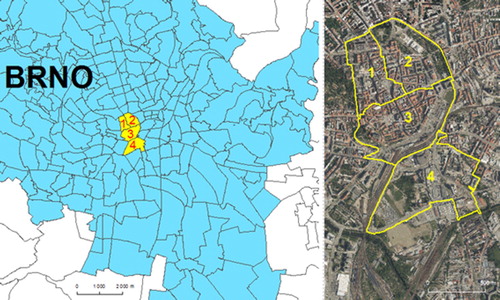
We used the SDAPI to harvest the data of four basic administrative units in the centre of Brno (), which was selected as the pilot area. The pilot area comprised four spatial units designated as 1 – ‘Náměstí Svobody’, 2 – ‘Janáčkovo divadlo’, 3 – ‘Zelný trh’, and 4 – ‘Přízová’. Selection was based on the fact that each day has a strict limitation on database queries. The units in the city centre are characteristic for a high temporal variability of citizens, as they contain a lot of commerce and connection hubs for public transport, and a high concentration of BTS assuring a relatively higher data spatial accuracy (e.g. Mulíček, Osman, and Seidenglanz Citation2015).
Figure 2. Localization of the pilot area (yellow) within the Brno. Selected spatial units: 1 – Náměstí Svobody’, 2 – ‘Janáčkovo divadlo’, 3 – ‘Zelný trh’, and 4 – ‘Přízová’.
Additionally, dasymetric spatial interpolation was applied to divide the administrative units (source zone) into target zones (buildings). Building footprints were used as the limiting variable. We presumed that visitors (PR+PNR) stay inside buildings (indoor personal activity). The footprint geometry of buildings originating from the INSPIRE Building theme (European Commission Joint Research Centre Citation2013) was combined with statistical attributes from the Czech Statistical Office (CZSO). For grid statistics, we modified the GEOSTAT grid dataset. The original GEOSTAT grid is produced with a cell dimension of 1 × 1 km using ETRS89 / LAEA coordinate reference system (Eurostat Citation2011). To improve spatial granularity, the original cell size was reduced to 100 × 100 m (each GEOSTAT cell was divided into 100 cells).
The target layer was further modelled using the following ancillary data sources:
- Temporal distribution of visitors based on the SDAPI analysis with a two-hour step – time dependant human activity ().
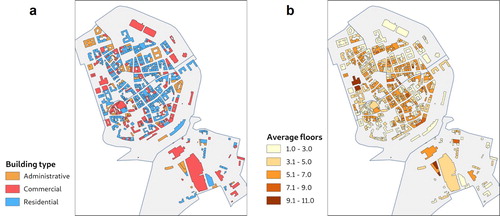
- Aggregation of functional attributes of buildings into three categories – administrative, commercial, and residential. Categories were used for the time weighting of individual buildings ().
- The vertical extent of buildings based on the number of floors attributed in CZSO data – volumetric extent ().
Figure 3. Temporal variability of estimated human presence (spatial unit no. 1 – ‘Náměstí Svobody’).
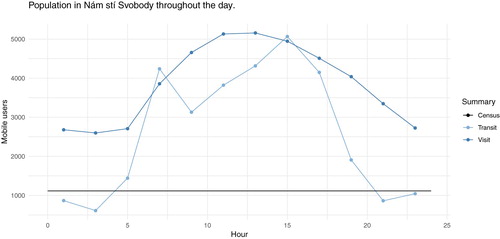
Figure 4. Functional delimitation of buildings in Brno centre (a – building type; and b – number of floors).
3.2. Data processing and analysis
At the beginning, a temporal profile for mobile phone SDAPI data was created with a two-hour step based on the data of twelve consecutive Mondays (November 2017–January 2018). Both PR+PNR and PT were analysed and compared with the latest available census data (CZSO Citation2011) of selected spatial units (). The data were processed in R software and simple arithmetic averages were used to show the temporal changes of both variables.
All buildings were aggregated into the three groups:
- residential buildings (individual housing, block of flats, dormitories)
- administrative buildings (public administration, schools and universities, post offices)
- commercial buildings (restaurants, cafes, libraries, markets, industry and services, banks, and others) using the functional delimitation of the of the construction classification CZ-CC (CZSO Citation2009, ).
Each database record (address point) is calculated separately and then aggregated for the whole building. This approach enabled buildings even with mixed functional categories to be handled.
Different weights were used to differentiate the probability of human presence in individual building categories. Values and timing were consulted with social scientists and used a very simplified approach based on expert judgement and knowledge of existing working hours. This is particularly valid for administrative and commercial buildings. The values for administrative buildings took into account the specificity of the day of the week, weight being set to 1 for business hours (8:00–17:00) and 0 for the rest of the day. Commercial buildings have higher variability of opening hours, so the weight was set to 1 for the hours between 7:00 and 21:00. Even more detailed segmentation of commercial buildings is possible based on the opening hours of individual commercial premises, but for the beginning, only one period was used. The weight for residential buildings is lowered to 0.5 between 7:00 and 21:00, when a lower presence of permanent inhabitants at home is assumed.
The authors are aware of the potential consequences of this simplified approach. The weights have only been given as very rough approximations to verify the concept, not to strictly determine reliable information about the population. An important part of using the method will be surveying spatio-temporal human activity for the available age categories of mobile phone data. Valuable insight may be also gained also when more mobile phone data is acquired by analysing zones with homogenous building types (e.g. residential areas, campuses, science parks or groups of office buildings). The former or latter method of deriving human activity data can be taken as the primary source and its accuracy confirmed using other method (e.g. sociological surveys, detailed field measurements in a limited area, etc.). If an accurate enough method of deriving human activity data from mobile phone data can be established and confirmed with a survey, the proposed method would also become useful for areas where human activity surveys are not available or impractical to conduct.
The BEHP (PR+PNR, excluding PT) for certain times is then calculated in the following way. The BEHP for each building is calculated using mobile phone data, the functional category of the building, relative functional weights (changes in time, see ), and footprint. The weighted footprint (R_p) is then calculated using the following formula:(2)
(2)
Table 2. Weights per functional delimitation and day/night.
where A_p is the total floor space (see Formula (1)), W_k is the weight for the functional building category (), and sum(W) is the sum of all weights for a particular hour.
Based on this formula and the results, the BEHP (P_o) is calculated as:(3)
(3) where P_m is the mobile phone data sum for the whole administrative unit and particular hour, R_p is the weighted footprint (formula (2)), and sum(R_p) – sum of the weighted footprints
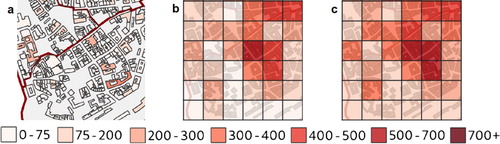
Employing the aforementioned steps and formulas, all records for a particular building and time sessions are aggregated and the BEHP is calculated for each building (, part a). This process is then repeated for available temporal slices.
Figure 5. Details of analytical maps (a – PR+PNR; b – PR+PNR; and c – PR+PNR+PT).
To be consistent with the grid statistics used by other authors (e.g. Järv, Tenkanen, and Toivonen Citation2017) an alternative visualization method of BEHP using a grid with 100 m spatial resolution has been prepared. The grid is spatially compliant with the population grid dataset (GEOSTAT, see above). The BEHP is then estimated for grid cells as follows.
All buildings in a cell are identified using the ‘Union’ function; those with multiple membership are divided between more cells. The potential building footprint fragment areas (R_a) are calculated with the formula:(4)
(4) where A is the fragment area and A_b – building area.
The BEHP per particular building fragment and hour (P_fh) is then recalculated for particular fragments and multiplied by the relative area of the fragment:(5)
(5) where R_a is the relative footprint of the building and P_bh – BEHP in the whole building and time period.
All the buildings and building fragments with the same cell ID are aggregated into the BEHP per cell using the ‘Spatial Join’ function (, part b).
So far, the PT has not been considered. These mobile phone users are unlikely to be staying inside buildings but moving through the administrative unit on streets by walking, driving cars, or using municipal public transport. However, even their short presence influences the total number of EHP within an administrative unit. The second grid output, therefore, calculates the general EHP taking into account PR+PNR and PT. The calculation is based on the aforementioned grid results, namely, the data set of buildings and building fragments assigned to particular grid cells. The area of built-up zones for each cell is already known, and the rest of the cell is called a non-built zone, where PT are expected. The relative area of built-up zones is then multiplied by P_fh (Formula 5) for a particular cell and the remaining fragments of non-built zones is multiplied by relative number of PT for particular time span. Both values are further aggregated (summed) using the cell ID, and the resulting value is the general EHP per cell (, part c).
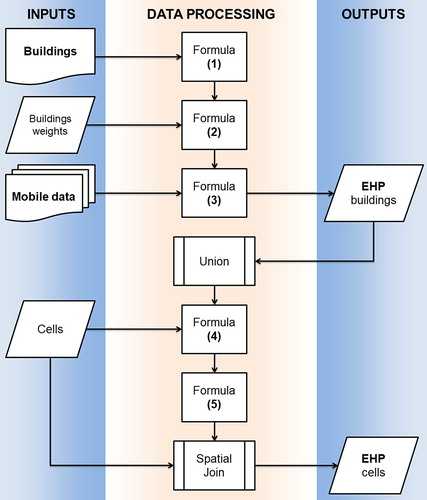
The entire procedure of building level dasymetric population modelling using mobile phone data is documented in .
Figure 6. Schematic description of the procedure used for building level dasymetric population.
4. Results
4.1. Analysis of estimated human presence in the centre of Brno
The resulting spatio-temporal patterns of BEHP were compared to the 2011 census data (CZSO Citation2011). The results of temporal analysis based on mobile phone data () clearly show a higher number of inhabitants in most buildings during both day and night compared to the census data.
Figure 7. Census population compared to night and day averages of BEHP population (mobile phone data, PR+PNR) in individual buildings. Buildings are ordered by the value of BEHP population. Building order n denotes n-th building with the largest population in a given series.
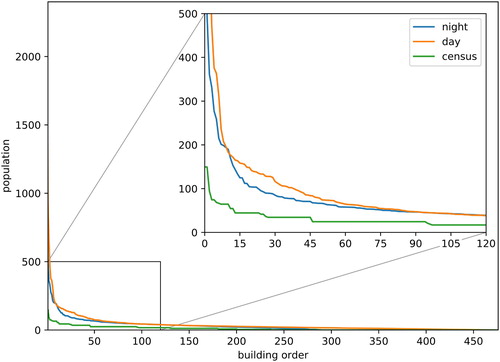
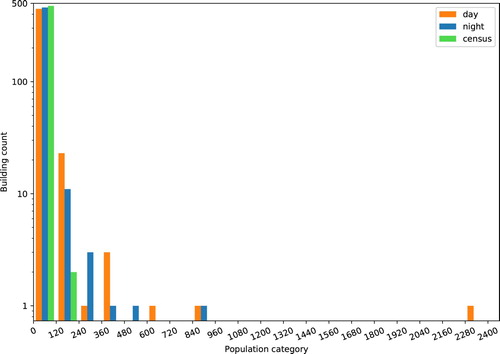
compares the day and night BEHP populations to census data. Census data are relatively accurate for buildings with smaller populations (less than 100 inhabitants). However, the values from census data are much lower than the values from mobile phone data in categories of buildings with the highest populations. The accurate estimation of buildings occupied by greater numbers of people is even more important in emergency situations.
Figure 8. Frequency distribution of buildings from census data compared to day and night averages of BEHP population (mobile phone data). Axis X = category of buildings by population.
Transiting inhabitants (PT, less than 30 minutes in an administrative unit) actively moved through the pilot area starting at 5:00 and ending at 21:00 with two visible peaks, one at 7:00 and the other at 15:00. The number of visiting people (PR+PNR) starts increasing at 5:00, culminates between 13:00 and 15:00, and stabilizes at 20:00. The maximum average EHP was reached at Přízová district at 15:00, peaking at twenty thousand mobile phone users.
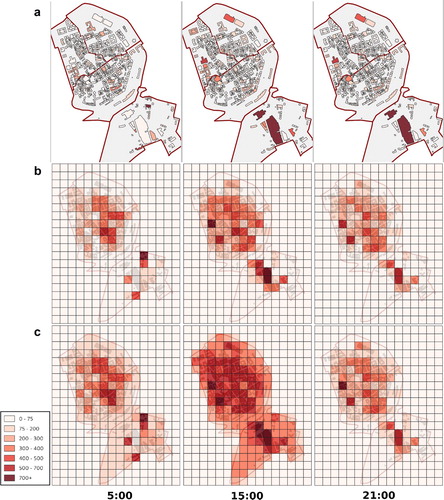
Analytical maps for all three methods and selected times (5:00, 15:00, and 21:00) are presented below ().
Figure 9. Analytical maps for three methods (a – PR+PNR on building level; b – PR+PNR on grid level; and c – PR+PNR+PT on grid level) and selected hours.
A visual comparison was made between all three methods and the census level of inhabitants. The population distribution and its spatial patterns were separately analysed for night time (measurements 23:00–5:00) and day time (7:00–21:00).
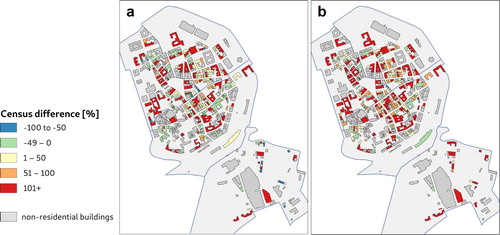
Taking into account only residential buildings, the average BEHP for both night and day was compared to the census data per building (). A visual comparison of both day and night data confirmed the general trend of higher BEHP values than in the census data for a substantial number of buildings (87% for the night and 70% for the day). This trend is visible despite the lowered weight for residential buildings during the day. The only exceptions are buildings with a very small footprint with 20–50 regular inhabitants. Their BEHP values are lower than the census data values. The resulting patterns are strongly influenced by the methodology and weights used.
Figure 10. The difference for residential buildings between building level average BEHP (PR+PNR) and census data for day (a) and night (b).
The building level data results are also available as an interactive 3D visualization (http://olli.wz.cz/ehp/) which enables selected time periods to be explored and documents the overall spatial context of analysed data, including the background topographic map.
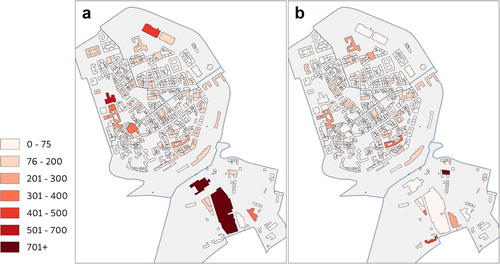
The average BEHP per night or day () clearly distinguishes the centres of high human presence at different times of the day. While the large residential buildings (night) and commercial centres such as ‘Tesco’ and ‘Vaňkovka’ stores (day) are ‘expected champions’, other buildings would be indistinguishable without BEHP evaluation attributes. The analysis refines the spatial pattern and enables not only the primary BEHP concentration to be identified but also the order of relevance of buildings.
Figure 11. Building level BEHP (PR+PNR) average for day (a) and night (b).
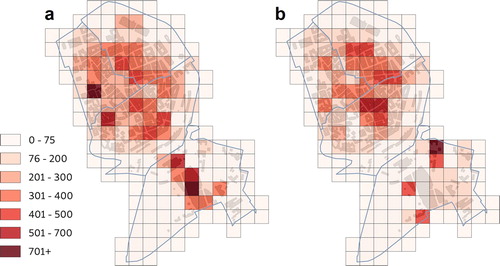
The biggest difference in spatial patterns is visible between the general EHP (PR+PNR+PT) averages per day and night ().
Figure 12. Average number of PR+PNR+PT for day (a) and night (b) for a grid data.
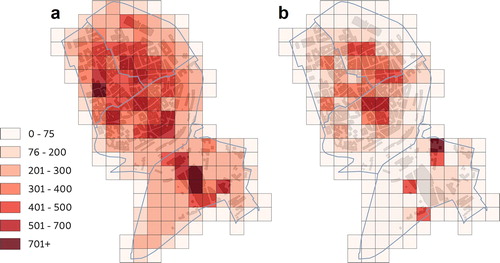
The average spatial distribution of visiting humans (PR+PNR) is shown in . While night time visits are more concentrated in the city centre, daytime peak visits are more distributed with a higher concentration of inhabitants in the Přízová spatial unit in the south-eastern part of the study area where large retail shops are situated.
Figure 13. Average number of visitors (PR+PNR) for day (a) and night (b) for a grid data.
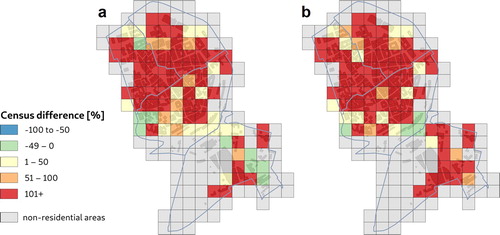
The patterns of grid data for residential zones which only take into account visitors were also compared (). The comparison clearly shows a significantly higher number of visitors over residents in the pilot area. This situation is consistent with existing social and demographic research (Seidenglanz, Toušek, and Chvátal Citation2013), as described in Section 3.1.
Figure 14. Comparison of PR (residents) and PN+PNR (visitors) data for day (a) and night (b) for a grid data.
4.2. Using the method for the purposes of emergency management
The necessity of identifying a detailed distribution of inhabitants in space and time was also established during the Integrated Rescue System (IRS) training ‘Drinking Water’ held in 2017, which focused on solving a crisis involving contamination of the drinking water supply with a chemical substance. This training was held in the city of Brno where the pilot area of our analysis is also situated.
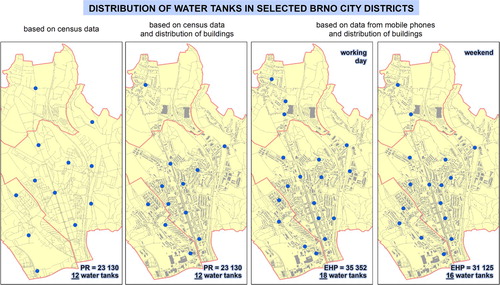
The use of the EHP dasymetric approach for this emergency situation is demonstrated in . The location-allocation analysis on the leftmost side only takes into account census data and evenly distributed population throughout the administrative unit. Each water tank can supply approximately 2000 people. The second analysis adjusts the water tank locations according to the real locations of buildings and population in administrative units. The third and fourth analysis quantifies the EHP for working days and weekends. Our methodology proposes a greater number of necessary water tanks in administrative units, and their optimal locations change according to population fluctuations. In such cases, an approach considering time as a variable plays a crucial role in the location-allocation analysis of drinking water sources in particular administrative units, and a more detailed description of human presence influences the success of emergency measures.
Figure 15. The role of spatio-temporal distribution of population in the case of water shortage (see the text for a detailed description).
5. Discussion and conclusion
The availability of spatial data from various sources, including mobile phone data and social media, for example, is rising. The variety of data sources also allows data from numerous sources to be used and combined. This study has used available mobile phone data to provide information about the population and its distribution. The authors compared the obtained data to recent and available traditional demographic data sources (CZSO Citation2011) and also developed the general framework for estimating a more realistic spatio-temporal distribution of inhabitants using a dasymetric and regular grid method.
Järv, Tenkanen, and Toivonen (Citation2017) broadly introduced the dasymetric interpolation method and the refinement of the population between target zones (buildings) for risk assessment at the micro level. Our approach can be considered as an alternative when CDR data are available for administrative/spatial units but not for GSM cells. Specifically, we differ in the following points:
We further developed the use of building level administrative data. Järv, Tenkanen, and Toivonen (Citation2017) used the building footprints and associated 3D space/volume to better represent the potential human distribution within the regular grid. We used the associated census technical data on individual buildings (building footprints) to achieve a more detailed spatial granularity and connected this data with the functional use of particular buildings. By contrast, we did not use numbers of inhabitants for individual buildings in our calculation of BEHP. These numbers were only used to compare census data with our results (calculated BEHP) at the level of buildings.
The analysis was performed with more detailed mobile phone data. While the original authors used normalized mobile phone data to represent the relative population distribution, we were able to distinguish visitors, transiting persons, gender and age groups to achieve a better spatio-temporal differentiation of demographic/gender attributes and specifics of activity (PR+PNR/PT).
Both studies differ also in the overall period and sampling method. Discontinuous data (day and night samples from a working day) for a one-month period were used in the original study (Järv, Tenkanen, and Toivonen Citation2017). We used longer period (12 weeks) and continuous data for 24 hours representing both weekends and the working days. The pilot study revealed high spatio-temporal differences in human population distribution with implications for crisis management and decision-making processes.
The analysed data confirmed the general assumption of overestimated mobile phone data measurements within city centres (Järv, Tenkanen, and Toivonen Citation2017). However, temporal analysis also the revealed differing rhythmicity between visitors and transiting people and fluctuations during day and night times. Spatial patterns at the level of individual buildings detailed the granularity of analysis and allowed other administrative and economic data to be linked.
The results showed that census data significantly underestimates both the number of visitors and transiting persons for day and night EHP. However, this situation is consistent with existing social and demographic research (Seidenglanz, Toušek, and Chvátal Citation2013), as described in Section 3.1.
The data from mobile operator O2 used for the study provide similar values which can be corroborated by using the alternative data from mobile operator T-Mobile currently available from the Brno city administration. T-Mobile statistics of human presence variability for basic administrative units can be checked at http://operator.brno.ml. The average numbers of EHP for selected spatial units in our pilot area () provide a similar underestimation of census data.
in Section 3.1 shows the difference between census data and estimated presence of population for the city of Brno. However, the differences in the city centre can be expected to be even greater because of the concentration of transportation hubs, retail centres and historical monuments as mentioned above. The other reason for greater differences in the pilot area is a population increase in the suburbs and increase of job opportunities in the centre of Brno (Sýkora and Mulíček Citation2014). All these reasons caused that census data to significantly underestimate the real population in the pilot area. The comparison with the census data emphasized the necessity of further developing the methodology for EHP calculation.
The important part of the suggested method is its easy repeatability and adjustment. The EHP calculation and entire analytical process have been automated using Python code. Individual input (building footprints, mobile phone user values per hour, administrative units), as well as coefficients (weights) or formulas, can be adjusted, and the general model further calibrated. An interactive example of the workflow for one of the pilot areas can be found at https://nbviewer.jupyter.org/github/gis4dis/MFD-Brno/blob/master/MFD%20example.ipynb or on GitHub at https://github.com/gis4dis/MFD-Brno. The code is described in a step-by-step fashion with map plots, table examples and graphs.
These developments in the analytical and visualization rules are also closely linked to validation and the real use of results. One potential validation process is consultation with social scientists focusing on human behaviour and daily rhythms. EHP can be partially validated for commercial buildings and large malls via Google popular times graphs. More detailed discussion was performed by Martin, Cockings, and Leung (Citation2015).
The disaggregation of the GEOSTAT population grid to a target resolution of 100 m opens new possibilities of combining EHP with other statistical data and also possible cross validation of results (Batista e Silva, Gallego, and Lavalle Citation2013; Scholz, Andorfer, and Mittlboeck Citation2013). A detailed grid also enables integration with other spatial data such as crime and traffic offence data (Russnák et al. Citation2016; Herman et al. Citation2018), city climate data (Dobrovolný and Krahula Citation2015; Geletič, Lehnert, and Dobrovolný Citation2016), retail economic data (Mulíček, Osman, and Seidenglanz Citation2015), or public transportation analysis (Mesarec and Lep Citation2009).
The proposed approach can provide more accurate dynamic population distribution mapping to assess object-oriented risks e.g. for purposes of Integrated Rescue System (IRS). Although the pilot area is relatively small, several emergencies have occurred directly in the pilot area, including fires (most recently in 2016), in some cases also with casualties (in 2002), and demonstrations (in 2007, 2015, 2017). The approach can be applied to a larger spatial extent, such as during a flood, if the data are available. For example, Smith, Martin, and Cockings (Citation2016) mention that the estimated population exposure to hazards discovered by adopting an innovative integrated modelling approach that explicitly includes both space and time can improve flood risk management.
The challenges and opportunities for more extensive use of mobile phone data exist not only for demographic and social sciences, but also for a range of other application domains in crisis management. This study presents an extensible methodology of dasymetric mapping and encourages further development in big spatial data application.
Challenges and limitations to this study still exist. Firstly, the city centre was selected as the pilot area to reveal the highest differences, but even a small area can influence the results in general (city centres are generally considered to be overestimated – Järv, Tenkanen, and Toivonen Citation2017). Secondly, only a relatively small amount of mobile phone data were available for the study. More detailed and long-term mobile phone data (not only for daily rhythms, but for weekly, monthly, and seasonal changes) enable buildings to be differentiated in more detail and their functional specifications described (opening hours for commercial and administrative buildings, refinement of functional classification of buildings) in combination with other ancillary data (traffic data, spatial planning data). Thirdly, the population grids need to be discussed and validated in terms of suitable grid size and potential combination with other statistical data from population grids.
The presented study and methods can be expanded in several directions. The authors are working on extending the spatial and temporal parameters and target populations (different age and gender groups) and better representation of other administrative units outside the city centre which potentially serve other functions (see Mulíček, Osman, and Seidenglanz Citation2015 for comparison). Extension of the analysed time frame will improve the data validity and can also help identify peculiarities and irregularities (e.g. Easter Monday), when the behaviour of inhabitants differs from usual patterns.
Disclosure statement
No potential conflict of interest was reported by the authors.
ORCID
Petr Kubíček http://orcid.org/0000-0003-4613-1068
Zdeněk Stachoň http://orcid.org/0000-0003-1807-1459
Radim Štampach http://orcid.org/0000-0002-0480-8862
Additional information
Funding
References
- Ahas, R., A. Aasa, Y. Yuan, M. Raubal, Z. Smoreda, Y. Liu, C. Ziemlicki, M. Tiru, and M. Zook. 2015. “Everyday Space–Time Geographies: Using Mobile Phone-based Sensor Data to Monitor Urban Activity in Harbin, Paris, and Tallinn.” International Journal of Geographical Information Science 29 (11): 2017–2039. doi:10.1080/13658816.2015.1063151.
- Ahas, R., S. Silm, O. Järv, E. Saluveer, and M. Tiru. 2010. “Using Mobile Positioning Data to Model Locations Meaningful to Users of Mobile Phones.” Journal of Urban Technology 17 (1): 3–27. doi:10.1080/10630731003597306.
- Batista e Silva, F., J. Gallego, and C. Lavalle. 2013. “A High-resolution Population Grid Map for Europe.” Journal of Maps 9 (1): 16–28. doi:10.1080/17445647.2013.764830.
- Bengtsson, L., X. Lu, A. Thorson, R. Garfield, and J. von Schreeb. 2011. “Improved Response to Disasters and Outbreaks by Tracking Population Movements with Mobile Phone Network Data: A Post-Earthquake Geospatial Study in Haiti.” Plos Medicine 8 (8): 1–9. doi:10.1371/journal.pmed.1001083.
- Binek, J., O. Šerý, H. Svobodová, and Z. Šilhan. 2017. Strategický plán rozvoje městské části Brno-střed na období 2018–2025 [Strategic plan for the development of the Brno-střed for the period 2018–2025]. http://www.brno-stred.cz/uploads/Strategicky_plan/SP_MC_Brno_stred_pro_tisk_9.6.17_.pdf.
- Cao, J., W. Tu, Q. Li, and R. Cao. 2017. “Spatio-temporal Analysis of Aggregated Human Activities Based on Massive Mobile Phone Tracking Data.” Journal of Geo-Information Science 19 (4): 467–474. doi:10.3724/SP.J.1047.2017.00467.
- CZSO. 2009. Klasifikace stavebních děl [Construction Classification]. Accessed February 14, 2018. https://www.czso.cz/csu/czso/klasifikace_stavebnich_del_-cz_cc-_platna_od_1_10_2009.
- CZSO. 2011. Census 2011 Results. Accessed February 24, 2018. https://www.czso.cz/csu/sldb/home; https://www.czso.cz/csu/rso/-registr-scitacich-obvodu-a-budov.
- CZSO. 2017. Information Society in Figures 2017. Accessed February 17, 2018. https://www.czso.cz/csu/czso/information-society-in-figures-2014-2016.
- Data-Pop Alliance. 2017. “Data-Pop Alliance.” Accessed February 14, 2018. http://datapopalliance.org/.
- Deville, P., C. Linard, S. Martine, M. Gilbert, F. R. Stevens, A. E. Gaughan, V. D. Blondel, and A. J. Tatem. 2014. “Dynamic Population Mapping Using Mobile Phone Data.” PNAS 111 (45): 1–6. doi:10.1073/pnas.1408439111.
- Dobrovolný, P., and L. Krahula. 2015. “The Spatial Variability of air Temperature and Nocturnal Urban Heat Island Intensity in the City of Brno, Czech Republic.” Moravian Geographical Reports 23 (3): 8–16. doi:10.1515/mgr-2015-0013.
- Dufková, K., M. Ficek, L. Kencl, J. Novák, J. Kouba, I. Gregor, and J. Danihelka. 2008. “Active GSM Cell-ID Tracking: ‘Where Did You Disappear?’” In Proceedings of the first ACM international workshop on Mobile entity localization and tracking in GPS-less environments, 7–12. doi:10.1145/1410012.1410015.
- European Commission Joint Research Centre. 2013. “INSPIRE Data Specification on Buildings – Technical Guidelines.” 323 p. Accessed February 19, 2018. https://inspire.ec.europa.eu/file/1533/download?token=ouzQkBuP.
- Eurostat. 2011. Reference Data. Accessed February 12, 2018. http://ec.europa.eu/eurostat/web/gisco/geodata/reference-data.
- Gallego, F. J. 2010. “A Population Density Grid of the European Union.” Population and Environment 31 (6): 460–473. doi:10.1007/s11111-010-0108-y.
- Gao, S. 2015. “Spatio-temporal Analytics for Exploring Human Mobility Patterns and Urban Dynamics in the Mobile Age.” Spatial Cognition & Computation: An Interdisciplinary Journal 15 (2): 86–114. doi:10.1080/13875868.2014.984300.
- Geletič, J., M. Lehnert, and P. Dobrovolný. 2016. “Modelled Spatio-temporal Variability of air Temperature in an Urban Climate and its Validation: A Case Study of Brno, Czech Republic.” Hungarian Geographical Bulletin 65 (2): 169–180. doi:10.15201/hungeobull.65.2.7.
- GSMWEB. 2018. Non-commercial Server about BTSs and Mobile Operators. Accessed March 25, 2018. http://www.gsmweb.cz/.
- Herman, L., J. Russnák, R. Stuchlík, and J. Hladík. 2018. “Visualization of Traffic Offences in the City of Brno (Czech Republic): Achieving 3D Thematic Cartography Through Open Source and Open Data.” In Proceedings of 25th Central European Conference, edited by H. Svobodová, 270–280. Brno: Masaryk University. doi:10.5817/CZ.MUNI.P210-8908-2018.
- Järv, O., H. Tenkanen, and T. Toivonen. 2017. “Enhancing Spatial Accuracy of Mobile Phone Data Using Multi-temporal Dasymetric Interpolation.” International Journal of Geographical Information Science 31 (8): 1630–1651. doi:10.1080/13658816.2017.1287369.
- Jonge, E., M. Pelt, and M. Roos. 2012. Time Patterns, Geospatial Clustering and Mobility Statistics Based on Mobile Phone Network Data. Hague: Statistics Netherlands. 26 p. Accessed February 21, 2018. https://www.cbs.nl/NR/rdonlyres/4EDB51ED-927A-4A69-B8F3-4DC57A44DDE4/0/Timepatternsgeospatialclusteringandmobilitystatistics.pdf.
- Kang, C., S. Gao, X. Lin, Y. Xiao, Y. Yuan, Y. Liu, and X. Ma. 2010. “Analyzing and Geo-visualizing Individual Human Mobility Patterns Using Mobile Call Records.” In 2010 18th International Conference on Geoinformatics, 1–7. doi:10.1109/GEOINFORMATICS.2010.5567857.
- Kang, C., Y. Liu, X. Ma, and L. Wu. 2012. “Towards Estimating Urban Population Distributions from Mobile Call Data.” Journal of Urban Technology 19 (4): 3–21. doi:10.1080/10630732.2012.715479.
- Kang, C., Y. Liu, and L. Wu. 2017. “An Analysis of Entropy of Human Mobility from Mobile Phone Data.” Wuhan Daxue Xuebao (Xinxi Kexue Ban)/Geomatics and Information Science of Wuhan University 42 (1): 63–69. doi:10.1320.
- Konečný, M., and W. Reinhardt. 2010. “Early Warning and Disaster Management: The Importance of Geographic Information (Part A).” International Journal of Digital Earth 3 (3): 217–220. doi:10.1080/17538947.2010.508884.
- Kressler, F., and K. Steinnocher. 2008. “Object-oriented Analysis of Image and LiDAR Data and Its Potential for a Dasymetric Mapping Application.” In Object-Based Image Analysis, edited by T. Blaschke, S. Lang, and G. J. Hay, 611–624. Berlin, Heidelberg: Springer.
- Kubíček, P., E. Mulíčková, M. Konečný, and J. Kučerová. 2011. “Flood Management and Geoinformation Support Within the Emergency Cycle (EU Example).” In Environmental Software Systems. Frameworks of Environment, edited by J. Hřebíček, G. Schimak, and R. Denzer, 77–86. Berlin: Springer. doi:10.1007/978-3-642-22285-6_9.
- Lane, N. D., E. Miluzzo, H. Lu, D. Peebles, T. Choudhury, and A. T. Campbell. 2010. “A Survey of Mobile Phone Sensing.” IEEE Communications Magazine 48 (9): 140–150. doi:10.1109/MCOM.2010.5560598.
- Li, Q., and B. Zhou. 2015. “Smartphone-based Individual Indoor Spatiotemporal Behavior Analysis.” Progress in Geography 34 (4): 457–465. doi:10.11820/dlkxjz.2015.04.007.
- Lískovec, R. 2016. “Výzkum časoprostorových rytmů prostřednictvím geolokalizačních technologií [Exploration of Timespace Rhythms Using Geolocalization Technologies].” Bachelor thesis. Brno: Masaryk University. 51 p.
- Liu, Y., C. Kang, and F. Wang. 2014. “Towards Big Data-driven Human Mobility Patterns and Models.” Wuhan Daxue Xuebao (Xinxi Kexue Ban)/Geomatics and Information Science of Wuhan University 39 (6): 660–666. doi:10.13203/j.whugis20140149.
- Martin, D. 1996. “An Assessment of Surface and Zonal Models of Population.” International Journal of Geographic Information Systems 10 (8): 973–989. doi:10.1080/02693799608902120.
- Martin, D., S. Cockings, and S. Leung. 2015. “Developing a Flexible Framework for Spatiotemporal Population Modeling.” Annals of the Association of American Geographers 105 (4): 754–772. doi:10.1080/00045608.2015.1022089.
- Mennis, J. 2003. “Generating Surface Models of Population Using Dasymetric Mapping.” The Professional Geographer 55 (1): 31–42. doi:10.1111/0033–0124.10042.
- Mesarec, B., and M. Lep. 2009. “Combining the Grid-based Spatial Planning and Network-based Transport Planning.” Technological and Economic Development of Economy 15 (1): 60–77. doi:10.3846/1392-8619.2009.15.60-77.
- Mulíček, O., R. Osman, and D. Seidenglanz. 2015. “Urban Rhythms: A Chronotopic Approach to Urban Timespace.” Time & Society 24 (3): 304–325. doi:10.1177/0961463X14535905.
- Nagle, N. N., B. P. Buttenfield, S. Leyk, and S. Spielman. 2014. “Dasymetric Modeling and Uncertainty.” Annals of the Association of American Geographers 104 (1): 80–95. doi:10.1080/00045608.2013.843439.
- Novák, J., and J. Temelová. 2012. “Každodenní život a Prostorová Mobilita Mladých Pražanů: Pilotní Studie Využití Lokalizačních dat Mobilních Telefonů [Everyday Life and Spatial Mobility of Young People in Prague: A Pilot Study Using Mobile Phone Location Data].” Sociologický Časopis / Czech Sociological Review 48 (5): 911–938.
- Ouředníček, M., J. Nemeškal, P. Špačková, M. Hampl, and J. Novák. 2018. “A Synthetic Approach to the Delimitation of the Prague Metropolitan Area.” Journal of Maps 14 (1): 26–33. doi:10.1080/17445647.2017.1422446.
- Oxendine, C. E., E. Schnebele, G. Cervone, and N. Waters. 2014. “Fusing Non-authoritative Data to Improve Situational Awareness in Emergencies.” In Proceedings of the 11th International ISCRAM Conference, edited by S. R. Hiltz, et al., 760–764. University Park: ISCRAM. doi:10.13140/2.1.4980.5443.
- Pastor-Escuredo, D., A. Morales-Guzmán, et al. 2014. “Flooding Through the Lens of Mobile Phone Activity.” In IEEE Global Humanitarian Technology Conference, 1–8. San Jose: IEEE. doi:10.1109/GHTC.2014.6970293.
- Paulus, F., A. Krömer, J. Petr, and J. Černý. 2016. Analýza hrozeb pro Českou republiku [Threats Analysis for the Czech Republic]. Lázně Bohdaneč: IOOL. 9 p. Accessed February 20, 2018. www.hzscr.cz/soubor/analyza-hrozeb-zprava-pdf.aspx.
- Peng, Z., Z. Sun, Q. Cheng, H. Jiao, and W. Chen. 2018. “Urban Land Use Function Recognition Method Using Sequential Mobile Phone Data.” Wuhan Daxue Xuebao (Xinxi Kexue Ban)/Geomatics and Information Science of Wuhan University 43 (9): 1399–1407. 1437. doi:10.13203/j.whugis20170329.
- Pucci, P., F. Manfredini, and P. Tagliolato. 2015. Mapping Urban Practices Through Mobile Phone Data. 1st ed. New York: Springer International Publishing. 90 p. doi:10.1007/978-3-319-14833-5.
- Reibel, M., and M. E. Bufalino. 2005. “Street-weighted Interpolation Techniques for Demographic Count Estimation in Incompatible Zone Systems.” Environment and Planning A 37 (1): 127–139. doi:10.1068/a36202.
- Řezník, T., B. Horáková, and D. Janiurek. 2011. “Emergency Support System: Actionable Real-time Intelligence with Fusion Capabilities and Cartographic Displays.” Advances in Military Technology 6 (2): 83–97.
- Řezník, T., B. Horáková, and R. Szturc. 2015. “Advanced Methods of Cell Phone Localization for Crisis and Emergency Management Applications.” International Journal of Digital Earth 8 (4): 259–272. doi:10.1080/17538947.2013.860197.
- Russnák, J., and L. Herman. 2017. “Visualization and Spatial Analysis of Open Data for Evacuation Planning – Pilot Study of the Dukovany Nuclear Power Plant (Czech Republic).” In 17th International Multidisciplinary Scientific GeoConference SGEM 2017, Informatics, Geoinformatics and Remote Sensing (Vol. 17, Is. 23), 853–860. doi:10.5593/sgem2017/23/S11.107.
- Russnák, J., P. Ondrejka, L. Herman, P. Kubíček, and A. Mertel. 2016. “Visualization and Spatial Analysis of Police Open Data as a Part of Community Policing in the City of Pardubice (Czech Republic).” Annals of GIS 22 (3): 187–201. doi:10.1080/19475683.2016.1200670.
- Scholz, J., M. Andorfer, and M. Mittlboeck. 2013. “Spatial Accuracy Evaluation of Population Density Grid Disaggregations with Corine Landcover.” In Geographic Information Science at the Heart of Europe, edited by D. Vandenbroucke, B. Bucher, and J. Crompvoets, 267–283. Cham: Springer. doi:10.1007/978-3-319-00615-4_15.
- Seidenglanz, D., V. Toušek, and F. Chvátal. 2013. Odborná analýza vývoje počtu osob oficiálně neregistrovaných ve městě Brně [Analysis of the Number of Persons Officially Unregistered in the City of Brno]. https://www.brno.cz/fileadmin/user_upload/sprava_mesta/Strategie_pro_Brno/dokumenty/Odhad_13.pdf.
- Silm, S., and R. Ahas. 2010. “The Seasonal Variability of Population in Estonian Municipalities.” Environment and Planning A 42 (10): 2527–2546. doi:10.1068/a43139.
- Slocum, T. 1999. Thematic Cartography and Visualization. 1st ed, 293. Upper Saddle River, NJ: Prentice Hall.
- Smith, A., D. Martin, and S. Cockings. 2016. “Spatio-Temporal Population Modelling for Enhanced Assessment of Urban Exposure to Flood Risk.” Applied Spatial Analysis and Policy 9 (2): 145–163. doi:10.1007/s12061-014-9110-6.
- Stachoň, Z., P. Kubíček, R. Štampach, L. Herman, J. Russnák, and M. Konečný. 2016. “Cartographic Principles for Standardized Cartographic Visualization for Crisis Management Community.” In Proceedings, 6th International Conference on Cartography and GIS (Vol. 1 and Vol. 2), edited by T. Bandrova and M. Konečný, 781–788. Sofia: Bulgarian Cartographic Association.
- Steenbruggen, J., E. Tranos, and P. Nijkamp. 2015. “Data from Mobile Phone Operators: A Tool for Smarter Cities?” Telecommunications Policy 39 (3–4): 335–346. doi:10.1016/j.telpol.2014.04.001.
- Sýkora, L., and O. Mulíček. 2014. “Prague: Urban Growth and Regional Sprawl.” In Confronting Suburbanization: Urban Decentralization in Postsocialist Central and Eastern Europe, edited by Kiril Stanilov and Luděk Sýkora, 133–162. Chichester: Wiley Blackwell.
- Čtyroký, J. 2017. “Kde má Praha centrum? [Where is Prague Center?].” Sborník příspěvků - Konference GIS Esri v ČR. p. 4. Accessed February 21, 2018. http://download.arcdata.cz/konf/2017/sbornik_konference_2017.pdf.
- Verkasalo, H., and H. Hämmäinen. 2007. “A Handset-based Platform for Measuring Mobile Service Usage.” Info 9 (1): 80–96. doi:10.1108/14636690710725085.
- Wright, J. K. 1936. “A Method of Mapping Densities of Population: With Cape Cod as an Example.” Geographical Review 26 (1): 103–110. doi: 10.2307/209467
- Wu, J., L. Huang, Y. Liu, J. Peng, W. Li, S. Gao, and C. Kang. 2012. “Traffic Flow Simulation Based on Call Detail Records.” Dili Xuebao/Acta Geographica Sinica 67 (12): 1657–1665.
- Xie, Z. 2006. “A Framework for Interpolating the Population Surface at Residential-housing-unit Level.” GIScience and Remote Sensing 43 (3): 1–19. doi:10.2747/1548-1603.43.3.233.
- Xu, J., Z. Fang, S. Xiao, and L. Yin. 2015. “The Spatio-temporal Heterogeneity Analysis of Massive Urban Mobile Phone Users’ Stay Behavior: A Case Study of Shenzhen City.” Journal of Geo-Information Science 17 (2): 197–205. doi:10.3724/SP.J.1047.2015.00197.
- Yuan, Y., and M. Raubal. 2016. “Analyzing the Distribution of Human Activity Space from Mobile Phone Usage: an Individual and Urban-Oriented Study.” International Journal of Geographical Information Science 30 (8): 1594–1621. doi:10.1080/13658816.2016.1143555.
- Yuan, Y., M. Raubal, and Y. Liu. 2012. “Correlating Mobile Phone Usage and Travel Behavior – A Case Study of Harbin, China.” Computers, Environment and Urban Systems 36 (2): 118–130. doi:10.1016/j.compenvurbsys.2011.07.003.
- Zhou, B., Q. Li, Q. Mao, W. Tu, and X. Zhang. 2015. “Activity Sequence-Based Indoor Pedestrian Localization Using Smartphones.” IEEE Transactions on Human-Machine Systems 45 (5): 562–574. doi:10.1109/THMS.2014.2368092.
- Zhou, X., Y. Yue, A. G. O. Yeh, H. Wang, and T. Zhong. 2014. “Uncertainty in Spatial Analysis of Dynamic Data – Identifying City Center.” Wuhan Daxue Xuebao (Xinxi Kexue Ban)/Geomatics and Information Science of Wuhan University 39 (6): 701–705. doi:10.13203/j.whugis20140074.