
ABSTRACT
The digital transformation taking place in all areas of life has led to a massive increase in digital data – in particular, related to the places where and the ways how we live. To facilitate an exploration of the new opportunities arising from this development the Urban Thematic Exploitation Platform (U-TEP) has been set-up. This enabling instrument represents a virtual environment that combines open access to multi-source data repositories with dedicated data processing, analysis and visualisation functionalities. Moreover, it includes mechanisms for the development and sharing of technology and knowledge. After an introduction of the underlying methodical concept, this paper introduces four selected use cases that were carried out on the basis of U-TEP: two technology-driven applications implemented by users from the remote sensing and software engineering community (generation of cloud-free mosaics, processing of drone data) and two examples related to concrete use scenarios defined by planners and decision makers (data analytics related to global urbanization, monitoring of regional land-use dynamics). The experiences from U-TEP’s pre-operations phase show that the system can effectively support the derivation of new data, facts and empirical evidence that helps scientists and decision-makers to implement improved strategies for sustainable urban development.
1. Introduction
The ‘human habitat’ represents one of the most dynamically evolving systems on Earth, where, a few years ago, a large-scale change has occurred: the number of people living in urban areas has exceeded those living in rural regions for the first time in human history (United Nations Citation2015a). And this trend of urbanization shows no sign of abating (United Nations Citation2017). In particular, cities in Asia and Africa are expanding at a staggering pace and even megacities arise in a matter of years. Challenging effects coming along with this development are the uncontrolled expansion of cities, the shrinking of green and agricultural areas, increasing pollution, rising poverty, or overburdened public infrastructures and services related to housing, energy and water (Moore, Gould, and Keary Citation2003; Zhou et al. Citation2004; Kaufmann et al. Citation2007; Grimm et al. Citation2008; Tilman et al. Citation2011). At the same time, urbanization provides many opportunities related to employment, education, protection, innovation and economy of scale, trade, well-being, prosperity, living standards and societal values in general (Dye Citation2008; UN-Habitat Citation2016).
Scientists, planners and policymakers are aware that cities and the ongoing process of urbanization are key factors with respect to strategies aiming at global sustainability (Bakar and Cheen Citation2013; IPCC Citation2014; United Nations Citation2015b; Grafakos, Gianoli, and Tsatsou Citation2016; Lützkendorf and Balouktsi Citation2017). However, Solecki, Seto, and Marcotullio (Citation2013) stress that the community still lacks essential facts, empirical evidence, and theories on how to effectively design and implement future mechanisms and strategies for sustainable urban development and management. Key questions arising in this context are: How can the opportunities that urbanization presents be put to good use? To what extent does urban sprawl damage the environment by consuming land and resources, polluting the air and water, or by reducing biodiversity, and – in turn – to what extent are cities threatened by natural hazards and climate change? How have human settlements developed in the past, and how should they do in the future?
It is here where new and promising opportunities can arise from the ‘digital revolution’ that has started to fundamentally change our life: the constantly progressing digital transformation of our society comes along with a massively increasing collection of data related to almost every aspect of our live and environment, respectively. As a result, data has become one of the world’s most valuable resources and the ability to efficiently access and analyse data is a current key driver of innovation and scientific, societal and economic progress (Manyika et al. Citation2011; John Walker Citation2014; Economist Citation2017). Some of the most tremendous advances in this context are related to the joint exploitation of mass data, modern information and communication technology (in particular artificial intelligence combined with high-performance computing infrastructures) and concepts of open and shared knowledge (Gewin Citation2016; Goodchild Citation2016).
To facilitate the systematic exploration of these new opportunities and to help bridging the gap between the growing virtual (data) environments and the real world demands for actionable and ‘smart’ information, a consortium funded by the European Space Agency (ESA) and led by the German Aerospace Center (DLR) has set-up the Urban Thematic Exploitation Platform (U-TEP). This web-based platform represents an open and collaborative virtual environment that enables clients to make use of dedicated functionalities and services for urban data access, processing, analysis and visualisation as well as for the development and sharing of technical solutions, thematic data and knowledge in general. Elements of this scope are addressed by related activities and platforms such as the Google Earth Engine (Gorelick et al. Citation2017), the Copernicus Data and Information Access Services – DIAS (Copernicus Citation2017), the Copernicus Data and Exploitation Platform Germany – CODE-DE (Storch et al. Citation2018) or Amazon Web Services – AWS – where all Sentinel – 2 scenes are made available in a high-level processing environment (Amazon Web Services Citation2017). At this point is important to note that the scope of platforms such as U-TEP and the examples listed afore goes far beyond the comparably basic functionality of typical online portals or repositories where the users can find, share and finally download data, algorithms, tools, or information and knowledge. In fact, U-TEP rather follows a wider – and in the era of ‘Big Earth Data’ supposedly more sustained – principle: it aims at directly bringing the users to an online platform where key data collections and effective tools to process and analyse them are already available at one place in a ready-to-use format. Hence, there is no need for the users anymore to first identify and then download and implement datasets and tools from a variety of sources to their – often limited – local computing environments for further analyses – an approach that quickly rises to a severe barrier when considering the frequently still limited internet access in many less developed countries or in view of the demanding requirements related to ‘big data’ analyses. Instead, the users can flexibly choose between more capable service models which fit best to their particular applications and needs (e.g. Platform as a Service – PaaS, Infrastructure as a Service – IaaS, Information as a Service – InaaS, or Software as a Service – SaaS).
This paper first introduces the objectives and concept of U-TEP along with a summary of the technical design. Next, four exemplary research studies are presented that were executed on the basis of the U-TEP by different user communities. This includes, on the one hand, two use cases aiming at the implementation of new technical functionalities to generate additional baseline data products for urban monitoring from earth observation (EO) imagery. Two other use cases utilise existing U-TEP products and services for joint data analytics to derive metrics and indicators related to global urbanization and regional land use dynamics.
2. Urban thematic exploitation platform
The expanding operational capabilities of global monitoring from space arising from the European fleet of Sentinel EO satellites led ESA to the launching of the Thematic Exploitation Platform (TEP) initiative in 2014. In a first phase of three years, the overall goal of the TEP program was to develop and implemented a number of thematically oriented platforms providing (non-expert) user communities not only with access to the mass data of EO mission archives, but also with the information and communication technology (ICT) needed to effectively process, analyse and visualise them in combination with ancillary data repositories related to ‘big earth data’. The resulting thematic products, technical solutions and expertise should then be made accessible for a broad spectrum of users. Currently, the TEP program includes a Coastal, Forestry, Geohazards, Hydrology, Polar, Urban and Food Security platform (European Space Agency Citation2018a).
2.1. Concept and objectives
Instead of following the established concept of distributing data from various distributed repositories and archives to the local environments of single users, the general TEP idea follows a principle that aims at bringing the users to the data and analytics tools. Hence, the fundamental objective of the U-TEP is to provide (i) an open virtual workspace where any interested user (expert or non-expert) can find (ii) technical functionalities and solutions (data and tools) to retrieve or generate innovative information on the built environment, (iii) at one single place. With these overarching goals U-TEP aims at supporting three main use scenarios:
2.1.1. Explore existing or generate new data and thematic content
The user is enabled to discover a broad spectrum of existing thematic content related to the built environment and originating from a diversity of sources and providers, respectively. This includes EO imagery, statistics, topographic data, volunteered geographic information or social media content. Due to the open access character of the platform, the offered contents and services preferably, but not exclusively, include sources, providers and datasets that follow an open data policy. Thereby U-TEP supports several data access mechanisms, for instance remote access via a Web Mapping/Coverage Services (WMS/WCS), data caching (e.g. automated on-demand download and temporary storage of data at U-TEP infrastructure for dedicated processing/analysis tasks), or data mirroring (permanent storage of datasets at the U-TEP infrastructure). If needed, users can also upload their individual data and content to the U-TEP in order to jointly analyse and visualise it with the already available open thematic layers and tools, respectively. Regarding the data upload the users can define whether their data will be visible – and accessible – for all other U-TEP users as well or if it is placed at a private work space with visibility and access restricted to defined users or user communities. The same options apply for any new service or product that is generated by a user on the platform.
Finally, U-TEP offers dedicated services for an on-demand processing and production of new data and thematic content – e.g. based on satellite imagery recorded by the Sentinel and Landsat missions. For the actual processing and data analysis, U-TEP provides specific processing solutions, algorithms and IT-infrastructures that support the joint and targeted exploitation of the data. The related functionalities available at the platform are – and will be – open and predominantly free. The use of certain services requires a prior registration of the user to the system. This is, for instance, the case for processing – and/or cost-intensive operations, but also for functionalities that require particular security standards (e.g. the use of the development environment). In addition, dedicated cost-intensive services might just be provided on a pay-per-use basis in order to allow for a cost-covering and thus sustainable operation of the platform. However, the underlying cost calculations still follow non-profit models. All details related to the actual portfolio of U-TEP data and services are provided in the section ‘New Data and Tools for Analysing the Built Environment – Example Applications’.
2.1.2. Develop and offer content
To foster active participation and to support comprehensive large-scale and in-time processing by individual users, U-TEP provides a dedicated development environment. This environment offers interfaces to design, upload and run user-defined algorithms and applications directly on one of U-TEP’s high-performance processing centres. Successful applications or products might then finally be published and shared at U-TEP’s application and product store. Therewith the users can actively contribute to the extension of the current U-TEP portfolio with their individual expertise. More information regarding the development environment is given in section ‘Systems design – Development environment’.
2.1.3. Connect with users and communities
U-TEP covers different functionalities to help users in getting connected with other communities and to share data, technology or knowledge. This includes a user forum to discuss, comment or provide feedback, automatic notification mechanisms for news and maintenance messages, and a community subsystem which enables the users to establish new or join existing communities where they are able to exchange data, tools and results or even jointly work on specific applications.
2.2. Systems design
The U-TEP systems design is based on a generic, modular, multi-purpose concept supporting service models such as Platform as a Service (PaaS), Infrastructure as a Service (IaaS), Information as a Service (InaaS), and Software as a Service (SaaS). Thereby U-TEP follows an open source strategy with an online presentation of all major system components and modules at the world’s leading software development platform GitHub (https://github.com/urban-tep). Moreover, the application programming interfaces (APIs) of U-TEP’s integrated software components are based on open standard specifications such as Open Cloud Computing Interface (OCCI) and Open Geospatial Consortium (OGC).
Generally, the U-TEP is a complex system composed of several subsystems. The three major technical components include (i) a web portal, interacting with an (ii) EO data catalogue (and associated data storage) and various internal and external Web Processing Services (WPS), (iii) a Visualisation and Analytics Toolbox (VISAT) for the joint analysis and visualisation of all data collections available at U-TEP, and (iv) different high performance processing infrastructures.
2.2.1. Portal
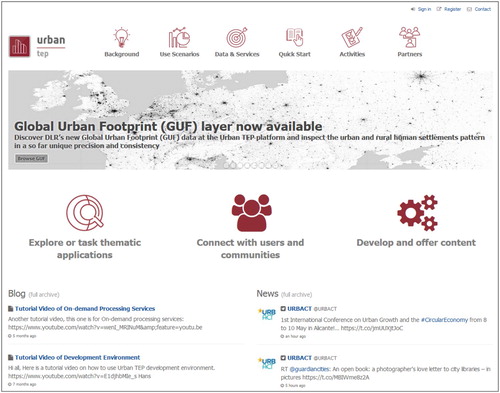
The U-TEP web-portal (www.urban-tep.eu) – illustrated in – represents the entry point of the system and is mainly designed as a community portal, focusing on the sharing of products and services, the provision of social media functions and the management of the user communities.
Figure 1. Web-portal representing the entry point to the U-TEP.
Considering the community workspace the users can interact and exchange with each other – including, in case, even the provision of direct access to individual processing jobs, datasets, products or services shared by specific communities. Moreover, the portal covers a completely integrated geobrowser, allowing providers to make available their data and services via a map-based application in which users can discover existing collections of data and thematic products. At the same time, the geobrowser provides a functionality to run new processing jobs using remote processing services made available by the U-TEP consortium or its users. The geobrowser also includes an automatic data gateway pulling processing and analysis results from the remotely hosted processing centres to the products and application store in order to ensure persistent and quick accessibility to new data and processing results.
2.2.2. Catalogue service
U-TEP uses an EO catalogue to quickly access metadata related to the major EO satellite missions such as the European Sentinel fleet or the US Landsat program. Metadata are continuously harvested and ingested into the catalogue in order to follow-up the ongoing missions and provide up-to-date data to the users. The catalogue is powered by a state-of-the-art computer science technology based on Apache Lucene (Lucene Citation2018) and providing a distributed, multitenant-capable full-text search engine. The catalogue, associated to the data storage, is also used to publish the user’s data products – e.g. in form of a direct upload by the user or an automatic retrieval from a remotely executed job. An important aspect of the catalogue is the authorization scheme applied to users and catalogue elements in order to define the access to and visibility of datasets, products and applications. Here the user/provider can chose between the three different indexes private (only visible to the individual user), shared (only visible to a defined community of users) and public (visible to all users and communities).
So far the U-TEP catalogue publishes a number of data collections which are partially held within the U-TEP infrastructure and partially provided by external sources. The ones provided by the U-TEP consortium include thematic datasets such as Global Urban Footprint (e.g. GUF2012-12 m, GUF2012-84 m, GUF-DenS2012-30 m), Global Urban Footprint + (e.g. GUF+ Evolution-30 m regional), TimeScan (TimeScan Landsat 2015/2010/2000 global, TimeScan Sentinel-1 2015 regional, TimeScan Sentinel-2 2015 regional), regional data on land use dynamics (LULC-Dev 2015/2010/2000 regional), demo data related to innovative datasets and techniques (High Altitude Pseudo Satellites products, geotagged Tweets), and data on ground surface movement. The data from external sources includes WorldPop, Gridded Population World, Global Administrative Areas, VIIRS Nighttime Lights, ESA CCI Land Cover, World Bank Statistics, United Nations Statistics and Google Traffic data. Finally, satellite data collections are also available in the U-TEP catalogue (although currently not exposed to the end users) for Sentinel-1/-2/-3 from the Copernicus Open Access Hub, for ERS and ENVISAT from the ESA Virtual Archive, and for Landsat-8 from the USGS EarthExplorer.
2.2.3. Processing centres
U-TEP currently operates three high-performance processing centres that host data and provide on-demand processing services. At the same time, users can upload and deploy their own individual data and tools at these processing centres, e.g. in order to execute bulk processing/analyses based on massive data collections. Technically, U-TEP’s distributed computing infrastructures include a Calvalus cluster (Fomferra et al. Citation2012) based on Apache Hadoop (Apache Citation2018), a High Performance Cluster (IT4I Citation2018), and an Apache Mesos-orchestrated cloud of virtual machines. The common interface of the U-TEP processing centres includes OGC WPS, online (result) data access, OGC WMS, and scientific data processor package upload and deployment based on Docker (Hykes Citation2013) and a descriptor XML format for parameterisation. In addition to the U-TEP internal processing facilities, alternative options of using external infrastructures have been tested in form of an online integration based on interfaces such as Web Processing Services (WPS) and Web Mapping Services (WMS), or an offline use of the Google Earth Engine (Gorelick et al. Citation2017).
2.2.4. Visualisation and analytics toolbox
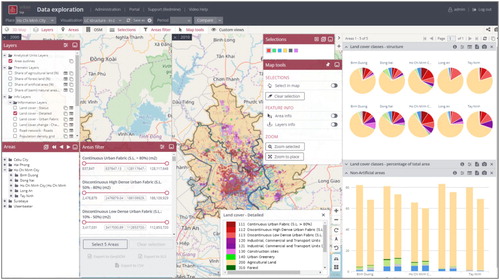
The visualisation and analytics toolbox (VISAT) is one of the most important components since it provides a large scope of functionalities for the visualisation and joint analysis of various data types (e.g. shapefiles, GeoJSON, CSV, GeoTIFF) from global to local scale and for different analytical units (e.g. administrative boundaries such as provided by the Database of Global Administrative Areas – GADM). The visualisation options include interactive charts, tables and (choropleth) maps that can again interactively be used to combine various types of data and layers or normalize the underlying attributes. The system also supports a multi-temporal mode to compare and analyse phenomena at different points in time – for instance in order to document changes or identify trends.
A key analytical functionality is the possibility to select, compare and filter analytical units based on the values of various attributes from different source of information – for instance coming from raster maps, socio-economic statistics and social media data. The results of any analysis or visualisation can be exported in tabular, graphical or GIS-compatible format or even saved and shared between users via URL link. shows the graphical user interface (GUI) of the VISAT.
Figure 2. Graphical user interface of U-TEP’s visualisation and analytics toolbox.
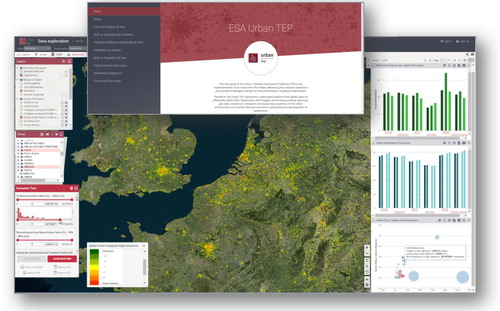
Technically, the VISAT includes three main internal components: the Backend, the BackOffice, and the FrontOffice. The FrontOffice is the part that most users see since it provides the visualisation and analysis functions for all available data in the form of charts and map displays. The BackOffice is the administration application which allows users to link and integrate data layers to/in the FrontOffice (e.g. in case of new data that a user wants to make accessible for analysis and visualisation). The Backend is the part of the application which is generally just visible to and accessible by the system administrator. It manages and handles all requests on the server.
Finally, there are three important external system components as well: the GeoServer which handles and exposes the geographical data used throughout the whole application, the GeoWebCache, which stores already processed WMS requests to speed up map retrievals, and the GeoNetwork which facilitates the exposure of metadata in a standardized way.
2.2.5. Development environment
A central element to foster innovation and provide the user with enabling techniques is the offering of a dedicated (virtual) environment. This environment already includes a collection of widely used open and free software frameworks (e.g. ESA’s Sentinel toolboxes, GDAL) that can be supplemented by the user with any other software without license restraints. It can be used for developing data processors and running tests with them. Moreover, it offers functionalities for packaging the processors with its dependencies into containers via Docker and automatically upload and deploy them to one of U-TEP’s high-performance processing centres. Such a data processor can, for instance, represent a software element that transforms raw satellite images into value-added higher level data products. In the related use scenarios a user develops a data processor, tests and optimises it on limited input data in the development environment, and then uploads the final processor to one of U-TEP’s processing centres for full-scale processing based on comprehensive data collections (e.g. time series or continental/global data coverages). The VM can be downloaded by the users and then either be operated in their local environment or as a single instance on any private or public cloud. Processors (and products generated with them) uploaded to the U-TEP can be published and shared as services with any other user or community on the platform.
3. New data and tools for analysing the built environment – example applications from U-TEP’s pre-operations
Currently, U-TEP already provides a comprehensive portfolio of data and thematic products and services which are accessible free and open and without registration for any interested user. Here it is important to note that U-TEP primarily represents a system for direct ‘on-site’ analytics and processing (user-to-the-data), in contrast to conventional online portals and repositories for basic data access and distribution. Consequently, U-TEP facilitates access to multiple open data access archives in form of the capability to integrate them into arbitrary processing and analytics procedures on the platform, whereas a direct download and dissemination of the original datasets via U-TEP go against this philosophy. However, this technical design decision is not to be confused with a restrictive data policy: any result (product, technique, service) generated with or on U-TEP can always be downloaded by the user if required and shared with any other community.
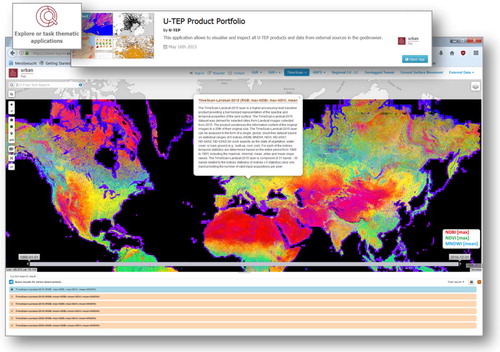
The actual portfolio of available U-TEP products and services can be checked via the ‘Explore or task thematic applications’ at the web-portal (see also ). One of the offered thematic applications, the ‘U-TEP Product Portfolio’, allows the user to also interactively browse and inspect all data layers in the geobrowser (). In addition to the layers originating from the U-TEP consortium (e.g. GUF, TimeScan, High Altitude Pseudo Satellites demo data, regional land use/land cover collections, geotagged Tweets, etc.), this application also includes open data from external partners, such as WorldPop (Tatem Citation2017), Gridded Population World (Doxsey-Whitfield et al. Citation2015), VIIRS Nighttime Lights (Román et al. Citation2018), or ESA CCI Land Cover (European Space Agency Citation2018b).
Figure 3. Thematic application ‘U-TEP Product Portfolio’ allowing the user to interactively browse and inspect all available data layers.
In order to test and demonstrate the usability and capabilities of the U-TEP with respect to the major goal of supporting scientists and decision makers in deriving new facts and empirical evidence on the status and dynamics of the built environment, a couple of concrete use cases was implemented in an 8-months pre-operations phase in cooperation with selected partners. These partners included, besides others, the World Bank Group, United Nations, World Food Programme, Organisation for Economic Co-operation and Development (OECD), Bill and Melinda Gates Foundation, WorldPop, Columbia University, Sultan Qaboos University and the Lawrence Berkeley National Lab. Out of the various studies conducted with these partners, four exemplary applications are further detailed in the following sub-sections: the generation of cloud-free mosaics to provide a consistent view on the built environment and the surrounding landscape (technical study), the deployment of new processing functionalities for the derivation of orthomosaics and digital surface models from drone data (technical study), the tracing of global urbanization by means of multi-source data analytics (application study), and the quantification of regional land use dynamics in Asian city regions (application study).
3.1. Providing a clear view of the built environment and its hinterland – the timescan mosaics
EO missions such as the European Sentinels or the US Landsat program provide data for global environmental monitoring with a spatial resolution between 10 and 60 m and revisit times – and thus the potential for an updated observation – of 5–16 days. This capability is particularly interesting for an observation of the highly dynamic urban areas. However, at least the frequently used multispectral EO satellites commonly suffer from the existence of clouds, cloud shadow and haze that lead to data gaps and radiometric inconsistencies within a single scene, but also between different adjacent collections. These effects can significantly hinder a spatially and temporally consistent data analysis, in particular when using automated machine-learning approaches.
To compensate for this effect the U-TEP team implemented a new ‘processing on-demand’ service at the platform that enables users to generate so-called TimeScan image products from multispectral Landsat or Sentinel-2 imagery for any desired time interval and region of interest. The TimeScan technical approach is described in detail by Esch et al. (Citation2018). Basically, the TimeScan method aggregates a collection of individual images into a higher-processing level baseline product that provides a harmonised representation of the spectral and temporal characteristics of the observed surfaces (e.g. minimised effect of clouds, cloud shadows and haze). To do so the TimeScan approach makes use of the ‘mass data perspective’ arising from EO programs such as Sentinel or Landsat: first, for each single scene available for a user-defined area and time interval, the TimeScan processor performs a pre-processing (e.g. cloud and shadow masking, top-of-atmosphere correction), before then deriving a set of features that characterise the land cover type per pixel (e.g. in form of normalised build-up index, vegetation index, water index, etc.). Considering the multitemporal stack of all scenes available for the initially defined region and time interval, a set of statistic operators is then applied to finally calculate the temporal mean, standard deviation, minimum, maximum, and slope of the different indexes calculated before. With that information, it is possible to also describe seasonal and temporal characteristics of surfaces in addition to their spectral behaviour. At the same time, the TimeScan products show a significantly reduced data volume compared to the collection of the original input data. This data compression aspect is a clear advantage, in particular considering large-scale or long-term monitoring activities that frequently require the processing of hundreds of TB of data – a task that significantly challenges the established concepts of distributing the required imagery (usually via internet) to the local environments of individual users for their specific analyses. With these properties, the TimeScan products show great promise for the effective mapping of human settlements and the monitoring of their spatiotemporal development based on mass EO data collections.
In a dedicated case study for the city of Muscat in the Sultanate of Oman, a time series of vegetation index maps were derived using U-TEP’s Sentinel-2 TimeScan on-demand service. Thereby, a Normalized Difference Vegetation Index (NDVI) time series was computed from a coregistered stack of the 55 cloud-free Sentinel-2 images collected between 2015 and 2018. An Empirical Orthogonal Function (EOF) analysis was then used to characterize seasonal and interannual changes in Visible-Near Infrared (VNIR) reflectance using the approach described by Small (Citation2012). The EOF analysis provides a statistical basis for a separation of deterministic (e.g. seasonal) and stochastic spatiotemporal variance (Storch and Zwiers Citation1999) while identifying uncorrelated modes of spatial and temporal variation in VNIR reflectance. Whereas NDVI time series are most commonly used to map seasonal vegetation phenology, they also resolve other processes that result in changes in VNIR spectral slope.
The structure of the temporal feature space formed by scatterplots of the three low order principal components allows for the identification of temporal endmembers corresponding to the most distinct temporal patterns present in the image time series (Small Citation2012). In the case of the Muscat NDVI time series, the temporal feature space clearly distinguishes irrigated from non-irrigated vegetation while giving at least three distinct temporal patterns associated with changes in coastal ocean reflectance () – including the presence of an algal bloom in December 2017 (Prabhu Citation2017). In addition, the PC composite in identifies other examples of distinct temporal patterns in the NDVI time series. The retaining area south of Al Khoud dam shows two distinct reflectance changes associated abrupt greening following extreme precipitation events in May 2016 and January 2018.
Figure 4. Spatiotemporal analysis of Sentinel 2 NDVI time series for Muscat Oman. The temporal feature space clearly shows at least eight temporal endmembers in the first three dimensions with clear distinction between terrestrial vegetation and marine algal blooms. Seasonal illumination effects are also seen in areas with terrain shadow. The PC composite shows most vegetation as yellow but the feature space clearly distinguishes irrigated (1) from indigenous (2) vegetation by senescence duration. The PC 3/2 projection identifies two distinct endmembers (7 & 8) corresponding to interannual increases and decreases in NDVI – although the areas of inter annual change are generally rather small (< ∼100 × 100 m) so difficult to see on the PC composite at the regional scale.
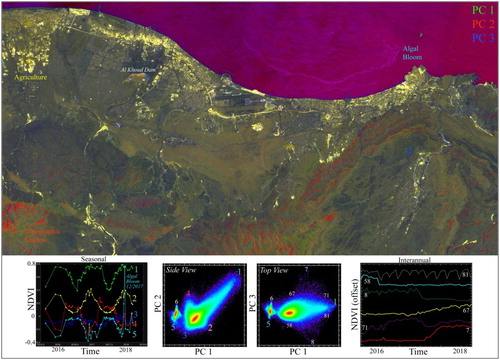
Combining the TimeScan Sentinel-2 product with EOF analysis of image time series and characterization of the temporal feature space provides a relatively straightforward approach to identify spatial and temporal patterns without the need for a priori assumptions as traditional function fitting analytical approaches do. The EOF analysis of the NDVI time series for Muscat clearly distinguish irrigated agriculture and ornamental vegetation from non-irrigated indigenous vegetation on the basis of the duration of summer senescence. It also identifies an algal bloom in the coastal ocean and seasonal illumination effects in areas of steep terrain shadow.
Apart from the study described afore, the TimeScan on-demand service has already been used by the U-TEP team to successfully generate three global TimeScan layers for 2015, 2010 and 2000 from a total of more than one million Landsat images (see also Esch et al. Citation2018). The production was solely based on an implementation of the TimeScan on-demand service at the HPC cluster of U-TEP’s IT4I processing center. The resulting TimeScan-Landsat layers are available at U-TEP’s data and products showroom (www.urban-tep.eu).
3.2. Surveying local urban morphology – new perspectives arising from drones
Many applications in urban monitoring, planning and management require observations of the built environment in a very high spatial resolution, often combined with a low-cost scenario or the capability of ad-hoc acquisitions. Considering satellite-based EO, such requirements can often not be met on the basis of the actual satellite missions or airborne systems. For example, rapid urbanization in developing countries is leading to the proliferation of informal settlements, where even sub-meter satellite imagery may not be enough to distinguish individual buildings (Kuffer, Barros, and Sliuzas Citation2014).
Here small drones or Unmanned Arial Vehicles (UAV) and future High Altitude Pseudo Satellites (HAPS) present a promising alternative (Esch et al. Citation2017b). The platforms themselves are becoming increasingly cheap and automated, making it easier to acquire very detailed imagery and point clouds in a versatile manner. Gevaert et al. (Citation2017), for instance, demonstrate how UAVs can be used successfully to support the generation of maps and to support settlements upgrading projects. However, the time- and cost-efficient processing and analysis of UAV data acquisitions covering an entire city frequently accumulate to several thousands of single images. Such a collection still poses a major challenge for many users since the processing can be computationally and technically quite demanding, especially when detailed ground control data is not available. These data processing challenges must be overcome in order to unlock the full potential of UAVs as well as enabling users with limited access to advanced hardware (e.g. in developing countries) to be able to benefit from this emerging technique and the related data, respectively.
Hence, the U-TEP expertise and processing capabilities have been employed for a study that aimed at the implementation and demonstration of a prototypic processing service for the generation of very high resolution orthomosaics (5 cm) and digital surface models (20 cm) from UAV imagery of a ∼100 km² study area in Dar es Salaam, Tanzania. With an expected population of more than 6 million people in 2025, Dar es Salaam is one of the fastest-growing cities in the world (ADB Citation2014). More than 70% of the population currently lives in informal areas. The combination of this large and vulnerable population with the frequent flood events stresses the need to mitigate the damage caused by flooding in the city. The imagery from UAV can be used to obtain data regarding the exposure and vulnerability of the population and infrastructure, and the derived elevation information is of extreme importance to identify areas prone to flooding.
The study region was flown off gapless with an eBee UAV equipped with a 20 megapixel Sensefly S.O.D.A. camera system. Altogether 11,832 pictures were taken in 28 single flights, which were combined in 12 blocks. Each flight covers a rectangular area with up to 10 parallel flight strips acquired with 70% overlap in latitude and 80% in longitude. The focal length of the camera was fixed to 10 mm (28 mm full format), which leads – in combination with the flight altitude of ∼350 m – to a ground sampling distance in the single-digit cm range. Higher radial distortions and strong vignetting effects can be observed at the image edges. Additionally, the measurements of a global navigation satellite systems (GNSS) and inertial navigation system (INS) were registered for each image so that the position of the acquisition point and an approximate viewing direction were available.
For the processing of the UAV images a processor was deployed at U-TEP’s DLR processing centre, with the processor itself being based on DLR’s in-house software Catena/XDIBIAS (Krauß et al. Citation2013) that was adapted to the properties of the UAV data at hand by a pre-filtering and an improved pre-orientation and absolute georeferencing. Regarding the pre-filtering, all images and their GNSS/inertial data had to undergo this procedure due to gross outliers in the inertial data, strong vignetting effects, and many water areas in the target area. Outliers in inertial data could be easily identified due to the regular flight pattern and vertical looking direction. Global water masks could be used to pre-filter images with water surfaces. The laborious relative orientation of each block was skipped and replaced by a robust least-squares pre-orientation of all images using SIFT matched tie-points together with all other available data. Finally, a globally available SRTM terrain model (USGS Citation2006) was used to stabilize the image blocks due to missing pass information on the ground. Together with the measured GNSS positions for each image and fine-matched tie-points, all selected images were then absolutely georeferenced, calibrated and orientated in a block-wise least-squares bundle adjustment.
Using the precisely orientated images, a high-resolution 3D terrain model with a ground pixel size of 20 cm and a radiometric adjusted orthophoto mosaic with a ground pixel size of 5 cm were finally generated ().
Figure 5. Digital surface model (A) and orthophoto mosaic (B) of Dar es Salam (TZ) derived from a total of 11,832 UAV images. The orange dots overlaid on the DSM in (a) show the centre point of each single image, whereas figures c-f represent zoom-ins at different scales.
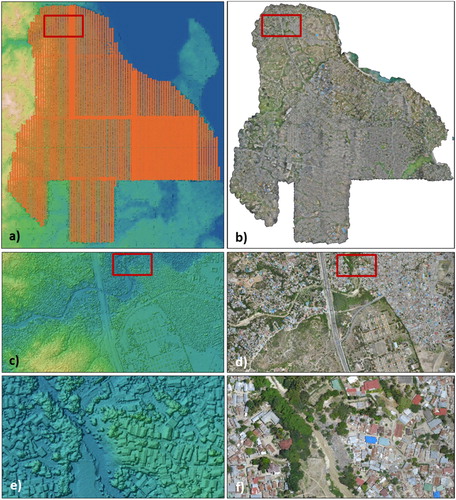
The accuracy analysis of the bundle block adjustment results in theoretical RMSE values for the GPS position measurements of ∼5.6 cm and for the image orientations up to 12.4°. The theoretical object point accuracy is estimated with ∼5.6 cm. However, the actual accuracy cannot be determined due to missing check points. The absolute height level is closely tied to the global SRTM DEM level.
In addition to the study related to the processing of UAV data, the U-TEP project also covered a demonstration study related to the integration of HAPS-simulated data for rapid mapping, 3D mapping, traffic monitoring, and pedestrian monitoring (Esch et al. Citation2017b). A collection of corresponding demo products was prepared and integrated into U-TEP via WMS services which are available for the interested users at www.urban-tep.eu.
Generally, the U-TEP exercises described afore are considered as a successful proof-of-concept for the realization of a ‘processing on-demand’ service for UAV/HAPS data and therefore corresponding works to finally transfer the related prototypic functionalities into an operational service on the U-TEP are already taking place.
3.3. Tracing global urbanization – large-scale multi-source data analytics
Global urban settlement patterns and the associated socio-economic, ecological, as well as technical developments, are rapidly changing the human environment. In this context, the integration of multi-source data brings powerful analysis applications to the user. It enables the analyst and decision maker to combine existing datasets on the U-TEP with external datasets and thereby generate added value. The following four exemplary VISAT applications (I–IV) are snapshots of global multi-source and multi-temporal analyses – and their related results – that were defined by planners and decision makers.
Nightlights, electric power consumption and social media: The VISAT analysis presented in focuses on the intersections of data related to population, settlements and energy. The globe image (A) illustrates the accumulated nightlights intensity 2015 product of the cloud-free average radiance values of the Visible Infrared Imaging Radiometer Suite (VIIRS) (Elvidge et al. Citation2017) in relation to the total/country-based population in 2015 derived from the World Bank Open Data Catalogue (The World Bank Citation2018b). A higher intensity of blue in indicates higher nightlights intensity per capita.
Figure 6. U-TEP analysis snapshot illustrates: (A) the accumulated nightlights intensity of 2015 in relation to the total population of a country 2015; selected countries are indicated with red dots; (B) the number of geotagged tweets per capita 2016; (C) a scatterplot with the accumulated nightlights intensity of 2015 (y-axis) in relation to the electric power consumption per capita in kWh (x-axis).
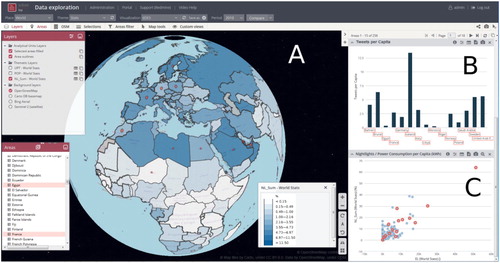
The bar chart (B) shows the number of geotagged tweets published within a 10-month time period in 2016 for selected countries. The scatterplot (C) compares the accumulated nightlights intensity of 2015 in relation to the electric power consumption per capita in kWh based on OECD/IEA data (International Energy Agency Citation2018). This additional data shows that for example Iceland and countries in the Near East like Saudi Arabia, Bahrein, Kuwait and the United Arab Emirates have high electric power consumption per capita, partly resulting in high nightlights intensity, as well as a high number of geotagged tweets per capita. A detailed analysis of the interrelations and dependencies behind these observations is currently investigated in separate studies.
(II) GUF and urban population: The availability of GUF settlement information enables additional analyses. Studies like the estimation of occupancy rate and population density for various dwelling types by Talent (Citation2017) can profit of the multisource data and analysis capabilities. The globe image (A) of shows the urban population density in inhabitants per km² of the GUF settlement area (Esch et al. Citation2017a).
Figure 7. U-TEP analysis snapshot illustrates: (A) the population density in inhabitants per km² of GUF settlement area; (B) a scatterplot with the population density in inhabitants per km² (y-axis) and the share of GUF area in km² (x-axis); the size indicates the number of tweets per capita; and (C) the share of GUF area in relation to the total area of the country in percent for selected countries.
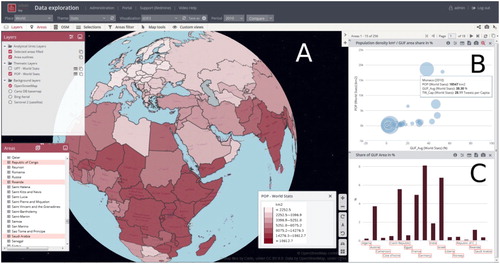
It becomes apparent that most countries of the Global North reach densities below 3000 inhabitants per km². With some exceptions, the countries of the Global South show densities between 3000 and 18,000 urban dwellers per km². This can be explained by higher occupancy densities per living area, but also partly with a potential underestimation of settlement area in the rural region due to the fact that a certain proportion of very small settlements and single houses might not be properly represented in the GUF. The scatterplot (B) compares the population density in km² of the total country area with the share of GUF settlement area in percent. The distribution of the variables indicates a relationship: the extreme values show large areal countries like Saudi Arabia with low population densities and a low share of settlement area and on the other hand city states like Monaco with a high population density and a low share of settlement area. The share of GUF are in percent (C) indicates higher values for the selected European countries than for the countries in Africa or the Near East.
(III) Social media data: The integration of user-generated content like geolocated social media information and volunteered geographic information enables analysts to engage in new research questions (Goodchild Citation2007; Goodchild et al. Citation2012; Sloan and Morgan Citation2015). The globe image (A) and the bar chart (B) of illustrate the number of geotagged tweets per capita published within a 10-month time period.
Figure 8. U-TEP analysis snapshot illustrates: (A) the number of Tweets per Capita and selected countries with red dots; (B) a bar chart with the tweets per capita for selected countries (C) a scatterplot with the number of tweets per GUF area (in km²; x-axis) to the gross national income (GNI) per capita in USD (y-axis).
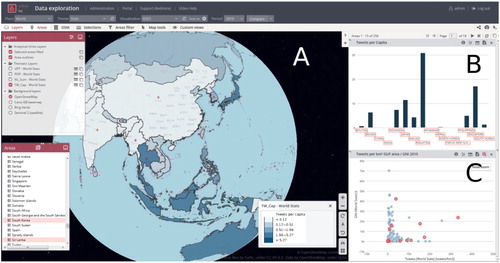
Here, a specific contrast can be identified between a very low number of tweets in China and North-Korea and high numbers in Japan and South-Korea. The scatterplot (C) compares the number of tweets per GUF area (in km²) to the gross national income (GNI) per capita in USD. No pattern can be identified visually for the selected parameters. The differences in the usage of Twitter might, therefore, be influenced more by societal or political decisions.
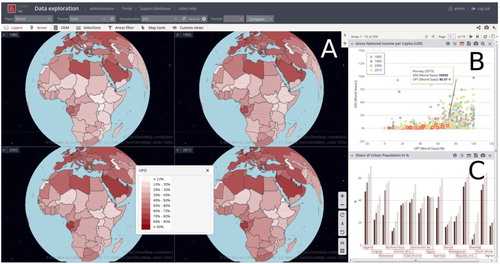
(IV) Development of urban population and economy: Multi-temporal analyses of urban trends are one of the potential strengths of U-TEP. The globe image (A) of displays the share of urban population in relation to the total population of a country in percent for the years 1985, 1995, 2005 and 2015 (The World Bank Citation2018c). The urbanization process was more emphasised in Africa than in Europe for the respective time periods. The scatterplot (B) relates the share of urban population to the gross national income (GNI) per capita in current USD (The World Bank Citation2018a) for each country and four time periods. Norway is selected and shows a strong increase in GNI and about 9% increase in the share of urban population. The bar chart (C) illustrates the share of urban population for selected countries.
Figure 9. U-TEP analysis snapshot illustrates: (A) the share of urban population in relation to the total population of a country in percent for the years 1985 (ul), 1995 (ur), 2005 (ll) and 2015 (lr); (B) a scatterplot with gross national income (GNI) per capita in USD (y-axis) and the percentage of urban population (x-axis) for the years 1985, 1995, 2005 and 2015; (C) urban population in relation to the total population of a country in percent for the years 1985, 1995, 2005 and 2015 for selected countries.
3.4. Tracking regional land use transformations in Asian city regions
In particular, the international development banks performed in recent years a number of studies to better understand the extensive urban growth in the metropolitan areas in South Asia. In general, urbanization in South Asia is expanding rapidly as people increasingly migrate to towns and cities in search of economic opportunities (Gisat Citation2018, Citation2016). As one consequence, slums currently account for one quarter of all urban housing – with many informal settlements being located near employment centres in the heart of the towns (Gisat Citation2018, Citation2016). Hence, the extension of housing and urban infrastructure in general and the improvement living conditions in slums a key strategic priorities in urban policy and management in South Asia. However, effective strategic concepts require up-to-date and spatially explicit information – in this case about the current status, dynamics and trends of land use and land cover (LULC) development in the urban context. It is here where U-TEP’s data and functionalities can be used to deliver the required data and indicators for a broad scope of stakeholders such as scientists, urban planners and policy makers.
For the study described here a first input were LULC maps derived from satellite data (Spot 6, Ikonos, Pleiades) for the Asian cities Cebu City (Philippines), Hai Phong (Vietnam), Ho Chi Minh City (Vietnam), Surabaya (Indonesia), Ulaanbaatar (Mongolia), Chittagong (Bangladesh), Colombo (Sri Lanka), Jalalabad (Afghanistan) and Karachi (Pakistan). In general, the use of EO data allows monitoring the small-scale urban built-up structures and LULC almost in real time and at acceptable costs. The LULC maps used in this study were generated outside the U-TEP on the basis of semi-automatic object-based image analysis (OBIA) with post classification enhancement and finally included a total of 11–13 different categories depending on some local specifics (see ). The class nomenclature focused on a variety of specific intra-urban structures and few general categories describing the LULC patterns outside the built environment (e.g. agriculture, natural or forested land, water). At the same time more than one hierarchical level is applied, ranging from aggregated categories (e.g. total of built-up area) to very detailed classes (e.g. different densities of urban fabric). This conceptual approach allowed assessing not only the spatial distribution but also the internal structure of the urban environment in terms of amount and distribution of specific urban surface or structural types such as residential, commercial, industrial units or green and open spaces. At the same time, this categorization is highly correlated with the distribution of population.
Figure 10. Visualisation and analysis of land use pattern and dynamics in Ho Chi Minh City.
Following the scheme described afore the LULC maps were finally prepared for the time period 2000–2002 and 2009–2013. These two periods were then used as the baseline to describe the dynamics of the land transformation processes in the Asian city areas. First, all change areas were mapped – based on the post-classification approach explained already – in order to then characterise the total amount of class transformations for each region. Next, a land and ecosystem accounting (LEAC) approach were applied to identify specific LULC change patters such as urban sprawl or urban densification. A final analysis step then detailed the quantitative and qualitative consumption and transformation flows in form of a net change for each LULC class. The second and third analysis steps provide a very detailed picture of the LULC development, identifying not only where for instance urban expansion takes place, but also which type of urban structure emerged (e.g. dense or sparse residential, commercial, industrial, etc.) and which type of land had been transformed (e.g. agricultural pasture or arable or natural forest, grasslands or bare land).
The scope of U-TEP’s VISAT for this use case was designed in a way that the LULC data and the derived change maps can be further combined with socio-economic statistics, in particular, those from population census. This adds additional options and value to the analysis – for example, to identify drivers of urban growth. The functionality enables the user, for instance, to model population densities by normalizing the population accounts with the detailed data of the urban fabric area. The tool works with concepts of analytical units such as GADM. These analytical units then have certain attributes such as population in the area and it is possible to calculate new attributes on the fly by normalising one of the attributes over others (e.g. population per urban area for given administrative units).
In case that no accurate census data was available for a certain city, disaggregation methods were applied in order to map comparably coarse population counts (e.g. available for GADM2 units) into much higher geographical detail. This analysis delivers additional valuable information related to the spatial distribution of population within the urban area – data that can finally help to assess aspects such as risks related to natural hazards.
From the functional point of view, the design of the related scope in the VISAT was focused on the support of a user-driven interactive analysis of the LULC status and dynamics in the city areas and their hinterland, but also to facilitate a comparison and benchmarking of different cities in general. One of the main added values of the tool and its implementation is that the LULC layers are not only displayed in the map, but they are also used as a source for aggregation of values for statistical categories. These categories are by default represented by administrative units such as GADM or local delineations at the sub-city districts level. Hence, for each analytical unit, zonal statistics are calculated for each attribute (e.g. total area per land cover class) or indicator (e.g. percentage of urban sprawl) at hand. These are then displayed in interactive charts which are synchronized with an interactive map for analytical units selection. The aggregated attributes can then, for instance, be displayed as a thematic choropleth map that highlights the spatial pattern of the corresponding feature.
For the purpose of interactive user-driven analysis, few specific types of analytical charts are prepared as well – tables enabling to check numerical values, column charts showing volumes of the land cover types and transformations, pie charts showing structures and scatter plots or polar charts serving the simultaneous display of several different attributes or indicators to highlight their correlations (e.g. built-up land development and population development). The attribute values can again be interactively normalized by the user (e.g. urban green per urban fabric, per total urban area or per population) and displayed in different spatial units such as ha or km2.
The user is also enabled to select multiple units and compare them or even to define up to six different multi-selections of units. Units can be filtered based on a combination of values of various attributes and sorted in descending or ascending way. This all serves the comparison between and benchmarking of individual units or entities – e.g. in relation to the average or mean values. In addition, a multi-temporal mode is supported which allows to compare situations in different years and to follow time-series and development trends. Finally, all content of the scope can be exported in tabular, GIS or graphical formats and user-defined thematic visualisations can be shared online via URL links.
The described instrument and implementation, respectively, can help improving the understanding of the drivers, effects, and trends of LULC transformations in South Asian countries in order to contribute to the realisation of sustainable spatial and urban planning and development and therewith – finally – more informed decisions. This application, for instance, helped the World Bank Group to analyse the environmental impact and efficiency of their programs focused on the corresponding areas.
4. Conclusions and outlook
U-TEP aims at providing an enabling instrument that supports a broad community of users in deriving new empirical evidence and actionable information from comprehensive and multi-source collections of (geo-)data to better address key challenges related to the phenomenon of urbanization. Thereby U-TEP can basically be considered as an evolving framework which brings users and functionalities closer to existing data inventories, supports large-scale, complex and timely data analytics – from local to global scale-, and facilitates the sharing of data, methods, and know-how.
By the end of U-TEP’s pre-operations phase (May 2018) more than 330 institutions from over 40 countries had already requested products, services and access to the platform. At the same time, U-TEP’s processing centres had successfully processed more than three petabyte of data in order to support the generation of several new global thematic datasets such as the Global Urban Footprint (Esch et al. Citation2017a), the TimeScan-Landsat 2015 (Esch et al. Citation2018), or the experimental GUF-2012 Density. The GUF-2012 Density product shows the urban imperviousness/greenness and results from a combination of the GUF mask and information modelled from the Normalized Difference Vegetation Index (NDVI) provided by the TimeScan-Landsat 2015 layer (following an approach introduced by Esch et al. Citation2009).
With a share of about 40%, the scientific users represent U-TEP’s the largest community. It is followed by 30% of users related to public institutions, 20% falling upon non-profit/non-governmental organizations, and around 10% having a commercial background. 83% of all requests from the user community aimed at accessing U-TEP’s thematic layers and related VISAT scopes for their analytics, whereas 15% requested on-demand processing services (primarily TimeScan), and only 2% were interested in making use of the virtual development environment. These numbers illustrate that U-TEP’s current user community can primarily derive advantage from the application – and knowledge-oriented opportunities offered by the platform. This is yet also true for the dominating group of scientific expert users: so far most of the researchers working with the platform aim at advanced data analytics to better address environmental, social or geoscientific problems (e.g. global urbanization, population growth, disease modelling, loss of biodiversity, global and climate change, risk mitigation). Even the technology-driven use scenarios (such as the two use cases from the remote sensing and software engineering community detailed in the previous section) often finally strived for the provision of new baseline data which then serves a concrete practical application and community, respectively.
In particular, based on U-TEP’s 8-months pre-operations phase and the related feedback from the user community, a set of significant advancements and benefits could be identified with respect to an enabling platform such as U-TEP:
All-in-one solutions: all data, tools and resources required for comprehensive analyses (e.g. large areas, extensive time series, heterogeneous data sources and types) are available in one place.
End-to-end capability: the platform allows accessing or uploading a diverse spectrum of raw data that can then be transformed into ready-to-use and actionable information by means of efficient data processing, analysis, and visualisation functionalities.
Flexibility and adaptability: the platform design provides a high degree of flexibility and adaptability in order to optimally serve the often diverging – or even contrary – needs of various user communities; this relates to the spectrum and complexity level of data, services, and interfaces as well as to effective mechanisms for the systematic and constant collection of new user requirements and their integration in the system (e.g. in form of options for a user-driven customisation of modules and functionalities).
Innovative portfolio: the platform provides open (and ideally free) access to validated and benchmarked data, products and services in unprecedented thematic and spatial detail, scope, and coverage; the on-demand and multi-source data capability offers an interesting perspective for event-driven and long-term monitoring as well as for interdisciplinary analyses and studies.
Effective enabling technologies: the system provides a set of state-of-the-art functionalities for multi-source data access, high-performance processing, customizable data visualisation and analytics, benchmarking, sharing of data, methods, and knowledge, and for participation and collaboration; an important component is also the provision of webinars, tutorials, and demo-videos that support the on-boarding and qualification of new users.
Robust, user-optimized operating and handling: intuitive design and ‘look-and-feel’ of the interfaces and services (e.g. specifically tailored to certain applications or user groups) to ensure easy and effective handling, even by non-experts; comprehensive user support services, mature operations and debugged functionalities in order to avoid frustration effects.
With the characteristics and functionalities listed afore, instruments such as U-TEP can help to better cope with the complexity that evidence-based urban studies and strategies usually possess with respect to the underlying phenomena and processes, the required data and methodologies, and the actors and stakeholders involved. The joint exploitation of ‘big earth data’, modern ICT and shared knowledge actually allows effectively harmonising, analysing and visualising heterogeneous data and the interdependencies of the phenomena and processes they describe. At the same time, the spatial domain can effectively be used as a common language between various disciplines. Moreover, facts and empirical evidence derived from spatial data and transported via visual messages have stronger impacts than figures and statistics presented in form of fact sheets and tables and thus they also increase the ability of non-experts to understand complex patterns and interrelations. Therewith U-TEP is supposed to help implementing effective future concepts and strategies towards sustainable urban development by unlocking the understanding of the complex processes and effects related to the grand challenge of global urbanization.
Nevertheless, so far U-TEP is still in a pre-operational stage. In order to transfer the system to a fully operational status, the next U-TEP activities will systematically focus on the enhancement and streamlining of the platform. This includes a thorough review of the general ‘look-and-feel’ of all interfaces and tools in order to support a rather intuitive use of all functionalities even by non-experts, a complementation of U-TEP’s ICT resources to increase dynamic scalability under maximum workload and optimise cost-efficiency, a constant extension of the products and service portfolio according to new or additional user requirements, and the development of business models for pay-per-use scenarios related to commercial applications. The extension of the products and service portfolio will be realised in form of a comprehensive campaign of case studies which will be conducted in close cooperation with key user communities from a broad spectrum of sectors (science, planning, and politics). With this roadmap, U-TEP is expected to achieve self-sustaining and cost-covering operational sustainability within the next 2–4 years.
Acknowledgements
The authors would like to thank the European Space Agency (ESA) for funding the project Urban Thematic Exploitation Platform TEP Urban (ESRIN/Contract No. 4000113707/15/I-NB) as well as all pilot project partners and interested users for their dedication to actively support implementation and optimization of the platform. ESA also provided the CCI Land Cover data. This work was also supported by the Czech Ministry of Education, Youth and Sports via the Large Infrastructures for Research, Experimental Development and Innovations project ‘IT4Innovations National Supercomputing Center (LM2015070)’. We acknowledge as well the data access of the Earth Observation Group – NOAA National Geophysical Data Center to their VIIRS nightlights product, SEDAC, CIESIN at Columbia University for providing the GPWv4 product and Andy Tatem and the WorldPop group for providing their population distribution product.
Disclosure statement
No potential conflict of interest was reported by the authors.
ORCID
Felix Bachofer http://orcid.org/0000-0001-6181-0187
Pablo d'Angelo http://orcid.org/0000-0001-8541-3856
Additional information
Funding
References
- ADB. 2014. Tracking Africa’s Progress in Figures. Edited by African Development Bank Group - Statistics Department. Tunis: ADB.
- Amazon Web Services. 2017. “Complete Sentinel-2 Archives Freely Available to Users.” Amazon Web Services (AWS). Accessed September 4, 2018. https://aws.amazon.com/de/blogs/publicsector/complete-sentinel-2-archives-freely-available-to-users/.
- Apache. 2018. “Apache Hadoop.” Accessed May 25, 2018. http://hadoop.apache.org.
- Bakar, Abu Hassan Abu, and Khor Soo Cheen. 2013. “A Framework for Assessing the Sustainable Urban Development.” Procedia – Social and Behavioral Sciences 85: 484–492. doi: 10.1016/j.sbspro.2013.08.377
- Copernicus. 2017. “The Upcoming Copernicus Data and Information Access Services (DIAS).” FDC. Accessed September 4, 2018. http://copernicus.eu/news/upcoming-copernicus-data-and-information-access-services-dias.
- Doxsey-Whitfield, Erin, Kytt MacManus, Susana B. Adamo, Linda Pistolesi, John Squires, Olena Borkovska, and Sandra R. Baptista. 2015. “Taking Advantage of the Improved Availability of Census Data: A First Look at the Gridded Population of the World, Version 4.” Papers in Applied Geography 1 (3): 226–234. doi: 10.1080/23754931.2015.1014272
- Dye, Christopher. 2008. “Health and Urban Living.” Science 319 (5864): 766–769. doi:10.1126/science.1150198. doi: 10.1126/science.1150198
- The Economist. 2017. “The World’s Most Valuable Resource Is No Longer Oil, But Data.” The Economist. Accessed May 25, 2018. https://www.economist.com/leaders/2017/05/06/the-worlds-most-valuable-resource-is-no-longer-oil-but-data.
- Elvidge, Christopher D., Kimberly Baugh, Mikhail Zhizhin, Feng Chi Hsu, and Tilottama Ghosh. 2017. “VIIRS Night-time Lights.” International Journal of Remote Sensing 38 (21): 5860–5879. doi: 10.1080/01431161.2017.1342050
- Esch, Thomas, Wieke Heldens, Andreas Hirner, Manfred Keil, Mattia Marconcini, Achim Roth, Julian Zeidler, Stefan Dech, and Emanuele Strano. 2017a. “Breaking New Ground in Mapping Human Settlements from Space – The Global Urban Footprint.” ISPRS Journal of Photogrammetry and Remote Sensing 134: 30–42. doi: 10.1016/j.isprsjprs.2017.10.012
- Esch, Thomas, F. Kurz, F. Pacini, G. Ottavianelli, and D. Vojtek. 2017b. “Capitalising High Altitude Pseudo Satellites for Urban Applications – First Results from the TEP Urban Project.” HAPS4ESA workshop, Noordwijkerhout, The Netherlands, 9–10 October.
- Esch, Thomas, Vitus Himmler, Gunther Schorcht, M. Thiel, Thilo Wehrmann, Felix Bachofer, C. Conrad, M. Schmidt, and Stefan Dech. 2009. “Large-area Assessment of Impervious Surface Based on Integrated Analysis of Single-date Landsat-7 Images and Geospatial Vector Data.” Remote Sensing of Environment 113 (8): 1678–1690. doi: 10.1016/j.rse.2009.03.012
- Esch, T., S. Üreyen, J. Zeidler, A. Metz-Marconcini, A. Hirner, H. Asamer, M. Tum, et al. 2018. “Exploiting Big Earth Data from Space – First Experiences with the Timescan Processing Chain.” Big Earth Data 2 (1): 36–55. doi: 10.1080/20964471.2018.1433790
- European Space Agency. 2018a. “Thematic Exploitation Platform.” Accessed May 25, 2018. https://tep.eo.esa.int/.
- European Space Agency. 2018b. “CCI Land Cover.” Accessed May 25, 2018. https://www.esa-landcover-cci.org/.
- Fomferra, N., M. Böttcher, M. Zühlke, C. Brockmann, and E. Kwiatkowska. 2012. “Calvalus: Full-mission EO cal/val, Processing and Exploitation Services.” 2012 IEEE International Geoscience and Remote Sensing Symposium, Munich, Germany, 22–27 July 2012.
- Gevaert, C. M., C. Persello, R. Sliuzas, and G. Vosselman. 2017. “Informal Settlement Classification Using Point-Cloud and Image-Based Features From UAV Data.” ISPRS Journal of Photogrammetry and Remote Sensing 125: 225–236. doi: 10.1016/j.isprsjprs.2017.01.017
- Gewin, Virginia. 2016. “Data Sharing: An Open Mind on Open Data.” Nature 529: 117–119. doi: 10.1038/nj7584-117a
- Gisat. 2016. “Urban Land Growth Mapping of South-East Asia Cities.” Living planet symposium 2016, Prague, Czech Republic, 9-13 May 2016.
- Gisat. 2018. “Mapping of South Asian Cities.” Accessed May 25, 2018. http://project.gisat.cz/eow2/.
- Goodchild, Michael F. 2007. “Citizens as Voluntary Sensors: Spatial Data Infrastructure in the World of Web 2.0.” International Journal of Spatial Data Infrastructures Research 2: 24–32.
- Goodchild, Michael F. 2016. “GIS in the Era of Big Data.” European Journal of Geography [En Ligne], Les 20 ans de Cybergeo. https://journals.openedition.org/cybergeo/27647#quotation.
- Goodchild, M. F., H. Guo, A. Annoni, L. Bian, K. de Bie, F. Campbell, M. Craglia, et al. 2012. “Next-generation Digital Earth.” Proceedings of the National Academy of Sciences 109 (28): 11088–11094. doi: 10.1073/pnas.1202383109
- Gorelick, Noel, Matt Hancher, Mike Dixon, Simon Ilyushchenko, David Thau, and Rebecca Moore. 2017. “Google Earth Engine: Planetary-Scale Geospatial Analysis for Everyone.” Remote Sensing of Environment 202: 18–27. doi: 10.1016/j.rse.2017.06.031
- Grafakos, Stelios, Alberto Gianoli, and Alexandra Tsatsou. 2016. “Towards the Development of an Integrated Sustainability and Resilience Benefits Assessment Framework of Urban Green Growth Interventions.” Sustainability 8 (12): 461. doi: 10.3390/su8050461
- Grimm, Nancy B., Stanley H. Faeth, Nancy E. Golubiewski, Charles L. Redman, Jianguo Wu, Xuemei Bai, and John M. Briggs. 2008. “Global Change and the Ecology of Cities.” Science 319 (5864): 756–760. doi: 10.1126/science.1150195
- Hykes, Solomon. 2013. “Lightning Talk – The future of Linux Containers.” Accessed May 25, 2018. http://pyvideo.org/pycon-us-2013/the-future-of-linux-containers.html.
- International Energy Agency. 2018. “Electric Power Consumption (kWh per capita) “. International Energy Agency (OECD/IEA). Last Modified 01.03.2018. Accessed May 25, 2018. www.iea.org/.
- IPCC. 2014. Climate Change 2014: Synthesis Report. Geneva, Switzerland: Contribution of Working Groups I, II and III to the Fifth Assessment Report of the Intergovernmental Panel on Climate Change.
- IT4I. 2018. “HEAppE Middleware.” Accessed May 25, 2018. https://code.it4i.cz/ADAS/HEAppE/Middleware/wikis/home.
- John Walker, Saint. 2014. “Big Data: A Revolution That Will Transform How We Live, Work, and Think.” International Journal of Advertising 33 (1): 181–183. doi: 10.2501/IJA-33-1-181-183
- Kaufmann, Robert K., Karen C. Seto, Annemarie Schneider, Zouting Liu, Liming Zhou, and Weile Wang. 2007. “Climate Response to Rapid Urban Growth: Evidence of a Human-Induced Precipitation Deficit.” Journal of Climate 20 (10): 2299–2306. doi: 10.1175/JCLI4109.1
- Krauß, T., P. d'Angelo, M. Schneider, and V. Gstaiger. 2013. “The Fully Automatic Optical Processing System Catena at DLR.” ISPRS - International Archives of the Photogrammetry, Remote Sensing and Spatial Information Sciences XL-1/W1 (W1): 177–183. doi: 10.5194/isprsarchives-XL-1-W1-177-2013
- Kuffer, Monika, Joana Barros, and Richard V. Sliuzas. 2014. “The Development of a Morphological Unplanned Settlement Index Using Very-High-Resolution (VHR) Imagery.” Computers, Environment and Urban Systems 48: 138–152. doi: 10.1016/j.compenvurbsys.2014.07.012
- Lucene. 2018. “Apache Lucene.” Accessed May 25, 2018. https://lucene.apache.org/.
- Lützkendorf, Thomas, and Maria Balouktsi. 2017. “Assessing a Sustainable Urban Development: Typology of Indicators and Sources of Information.” Procedia Environmental Sciences 38: 546–553. doi: 10.1016/j.proenv.2017.03.122
- Manyika, James, Michael Chui, Brad Brown, Jacques Bughin, Richard Dobbs, Charles Roxburgh, and Angela Byers. 2011. Big data: The next frontier for innovation, competition, and productivity.
- Moore, Melinda, Philip Gould, and Barbara S. Keary. 2003. “Global Urbanization and Impact on Health.” International Journal of Hygiene and Environmental Health 206 (4): 269–278. doi: 10.1078/1438-4639-00223
- Prabhu, Conrad. 2017. “Non-toxic Algal Bloom Responsible for ‘Green Tide’ Phenomenon.” Oman Daily Observer. Accessed May 25, 2018. http://www.omanobserver.om/non-toxic-algal-bloom-responsible-green-tide-phenomenon/.
- Román, Miguel O., Zhuosen Wang, Qingsong Sun, Virginia Kalb, Steven D. Miller, Andrew Molthan, Lori Schultz, et al. 2018. “NASA’s Black Marble Nighttime Lights Product Suite.” Remote Sensing of Environment 210: 113–143. doi: 10.1016/j.rse.2018.03.017
- Sloan, L., and J. Morgan. 2015. “Who Tweets with Their Location? Understanding the Relationship Between Demographic Characteristics and the Use of Geoservices and Geotagging on Twitter.” PLoS One 10 (11): e0142209. https://journals.plos.org/plosone/article?id=10.1371/journal.pone.0142209.
- Small, Christopher. 2012. “Spatiotemporal Dimensionality and Time-Space Characterization of Multitemporal Imagery.” Remote Sensing of Environment 124: 793–809. doi: 10.1016/j.rse.2012.05.031
- Solecki, William, Karen C. Seto, and Peter J. Marcotullio. 2013. “It’s Time for an Urbanization Science.” Environment: Science and Policy for Sustainable Development 55 (1): 12–17.
- Storch, Tobias, Christoph Reck, Stefanie Holzwarth, and Vanessa Keuck. 2018. “CODE-DE – The Germany Operational Environment for Accessing and Processing Copernicus Sentinel Products.” IGARSS 2018, Valencia, July 22–27.
- Storch, Hans von, and Francis W. Zwiers. 1999. Statistical Analysis in Climate Research. Cambridge: Cambridge University Press.
- Talent, Mishka. 2017. “Improving Estimates of Occupancy Rate and Population Density in Different Dwelling Types.” Environment and Planning B: Urban Analytics and City Science 44 (5): 802–818.
- Tatem, A. J. 2017. “WorldPop, Open Data for Spatial Demography.” Scientific Data 4: 170004. https://www.nature.com/articles/sdata20174 doi: 10.1038/sdata.2017.4
- Tilman, David, Christian Balzer, Jason Hill, and Belinda L. Befort. 2011. “Global Food Demand and the Sustainable Intensification of Agriculture.” Proceedings of the National Academy of Sciences 108 (50): 20260–20264. doi: 10.1073/pnas.1116437108
- UN-Habitat. 2016. World Cities Report 2016: Urbanization and Development – Emerging Futures. Edited by UN-Habitat, World Cities Report. Nairobi: UN-Habitat.
- United Nations. 2015a. World Urbanization Prospects: The 2014 Revision Edited by United Nations. New York, NY: United Nations – Department of Economic and Social Affairs; Population Division.
- United Nations. 2015b. Transforming our World: the 2030 Agenda for Sustainable Development. New York, NY: General Assembly United Nations.
- United Nations. 2017. World Population Prospects: The 2017 Revision, Key Findings and Advance Tables. Edited by United Nations. New York, NY: United Nations – Department of Economic and Social Affairs; Population Division.
- USGS. 2006. Shuttle Radar Topography Mission. edited by University of Maryland Global Land Cover Facility. College Park, MD.
- The World Bank. 2018a. “GNI Per Capita, Atlas Method (current US$) – NY.GNP.PCAP.CD.” Last Modified 01.03.2018. Accessed May 25, 2018. https://data.worldbank.org/.
- The World Bank. 2018b. “Population, Total – SP.POP.TOTL.” Last Modified 01.03.2018. Accessed May 25, 2018. https://data.worldbank.org/.
- The World Bank. 2018c. “Urban Population (% of total) – SP.URB.TOTL.IN.ZS.” Last Modified 01.03.2018. Accessed May 25, 2018. https://data.worldbank.org/.
- Zhou, Liming, Robert E. Dickinson, Yuhong Tian, Jingyun Fang, Qingxiang Li, Robert K. Kaufmann, Compton J. Tucker, and Ranga B. Myneni. 2004. “Evidence for a Significant Urbanization Effect on Climate in China.” Proceedings of the National Academy of Sciences of the United States of America 101 (26): 9540–9544. doi: 10.1073/pnas.0400357101