
ABSTRACT
Researchers are continually finding new applications of satellite images because of the growing number of high-resolution images with wide spatial coverage. However, the cost of these images is sometimes high, and their temporal resolution is relatively coarse. Crowdsourcing is an increasingly common source of data that takes advantage of local stakeholder knowledge and that provides a higher frequency of data. The complementarity of these two data sources suggests there is great potential for mutually beneficial integration. Unfortunately, there are still important gaps in crowdsourced satellite image analysis by means of crowdsourcing in areas such as land cover classification and emergency management. In this paper, we summarize recent efforts, and discuss the challenges and prospects of satellite image analysis for geospatial applications using crowdsourcing. Crowdsourcing can be used to improve satellite image analysis and satellite images can be used to organize crowdsourced efforts for collaborative mapping.
1. Introduction
1.1. Definitions of crowdsourcing, VGI and collaborative mapping
The term ‘crowdsourcing’ was coined in 2005 as a portmanteau of crowd and outsourcing (Howe Citation2006; Schenk and Guittard Citation2009; Hirth, Hoßfeld, and Tran-Gia Citation2011; Estellésarolas Citation2012) and represents information for which crowds of people including both the volunteered and the non-volunteered information. Crowdsourcing includes a mix of bottom-up and top-down processes (Brabham Citation2008; Brabham Citation2013; Prpic and Shukla Citation2016). The advantages of using crowdsourcing may include improved costs, speed, quality, flexibility, scalability, and diversity (Prpic, Taeihagh, and Melton Citation2015). Crowdsourcing has been used in early competitions, astronomy, genealogy research, journalism, linguistics, ornithology, public policy, seismology, and libraries since this term was first popularized on the Internet (Brabham Citation2008). At around the same time (2007), the phrase ‘volunteered geographic information’ (VGI) was coined by Goodchild (Goodchild Citation2011) in an attempt to formalize the impact of the volunteered information on geography. VGI is defined as ‘geographic information acquired and made available to others through the voluntary activity of individuals or groups, with the intent of providing information about the geographic world’ (Sui, Elwood, and Goodchild Citation2012; Tulloch Citation2014). The power of crowdsourced geographic information has provided valuable supplementary information for applications such as disaster response and damage assessment (Kryvasheyeu et al. Citation2016), environmental monitoring or mapping (Gouveia and Fonseca Citation2008; Mooney and Corcoran Citation2011), crisis management (Zook et al. Citation2010; Roche, Propeck-Zimmermann, and Mericskay Citation2013), urban planning (Foth et al. Citation2009; Mooney, Sun, and Yan Citation2011), map creation (Haklay and Weber Citation2008), and location-based services (Mooney, Sun, and Yan Citation2011; Savelyev et al. Citation2011).
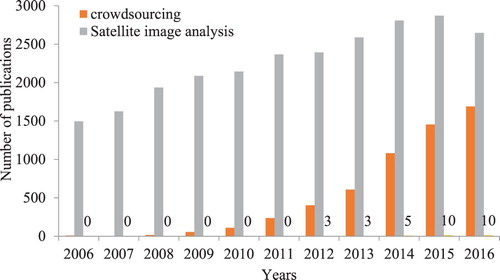
With the emergence of Web 2.0, crowdsourcing has been increasingly used in satellite image analysis for collaborative mapping, as in the example of involving the public to support the efforts of experts to analyze satellite images for various applications (Maisonneuve and Chopard Citation2012). Collaborative mapping is the aggregation of Web mapping and user-generated content, from a group of individuals or entities, and can take several distinct forms (See, Fritz, and Leeuw Citation2013; Wikipedia Citation2016). With the growth of technology for storing and sharing maps, collaborative maps have become competitors to commercial services, in the case of OpenStreetMap (OSM), Ushahidi, GeoWiki, Wikimapia, Field Papers etc. initiatived by Google Map Maker and Yandex. Map editor, Youth Mappers, Missing Maps, Tomnod, Talking Points Collaborative Mapping. Among all the articles published during the last decade, satellite image analysis and crowdsourcing have accounted for a large share of the total applications. An analysis using the Institute of Science Information Web of Science found that, in an example of parallel evolution, 5655 articles about crowdsourcing and 24,962 articles about satellite image analysis have been published since 2006 (Figure ). The number of crowdsourcing articles increased rapidly, from 8 articles in 2006 (when the crowdsourcing first appeared in the database) to 1690 in 2016. The number of publications about satellite image analysis increased more slowly, from 1494 in 2006–2646 in 2016. However, articles that combine these two research areas are much less common, since satellite image analysis using crowdsourcing is a new research field; thus, there have been only 31 articles since 2012.
Figure 1. Number of publications per year retrieved from the Institute of Science Information Web of Science for crowdsourcing (query = ‘crowdsourcing’ or ‘crowdsourced’), satellite image analysis (query = ‘satellite image analysis’), and satellite image analysis using crowdsourcing (query = ‘crowdsourcing’ and ‘satellite image analysis’) during the period from 2006 to 2016. Numbers beside the bars represent the number of articles for publications that focus on satellite image analysis using crowdsourcing.
1.2. Crowdsourcing for satellite image analysis
There are four main crowdsourcing collection methods that have been used in satellite image analysis: geotagging (i.e. visiting an image object in the field and recording its characteristics and coordinates), GPS-trajectory coordinates (i.e. recording the positions of a series of points along a trajectory), satellite image annotation (i.e. ground-truthing or field-validation of image attributes), and ‘what you see is what you map’ (WYSIWYM; i.e. incorporating the reports of field investigators in maps) (Schmid et al. Citation2013). These crowdsourced efforts can include data collected from mobile phones, mobile mapping vans, drones and other unmanned aircraft systems (Heipke Citation2010), and remote-sensing image-server sites such as OpenTopography.org, which provides access to high-resolution topographic data obtained using technologies such as LiDAR (Sui, Goodchild, and Elwood Citation2013) and the associated geographic coordinates.
The use of crowdsourcing has been highly relevant for the validation of remote-sensing products such as the European forest cover map (Pekkarinen, Reithmaier, and Strobl Citation2009), the GlobCover map (Defourny et al. Citation2009), and in disaster damage assessment and response exercises (Kerle and Hoffman Citation2013). For example, in disaster damage assessment and response, satellite remote sensing images have been used to provide an overview of a disaster site, which was then supplemented by scenes of the disaster captured from the ground by volunteers, and the combination has proven indispensable to support efforts such as an assessment of structural damage (Zhang and Kerle Citation2008). Crowdsourcing can also provide a mechanism to develop actionable information and enable geospatial analysis for monitoring a disaster in real-time. For example, crowdsourcing by volunteers and non-volunteers who are experienced with remote sensing using Internet-based mapping portals has supported emergency response operations, despite a range of problems with current collaborative mapping approaches (Barrington et al. Citation2011; Kerle and Hoffman Citation2013).
These problems include how best to train volunteers for the task, to ensure data quality, to ensure that instructions are accurately understood and translated into valid results, and how to adapt the mapping scheme for different needs. In this paper, we will describe how crowdsourced geographic information and image analysis can work together effectively, including how crowdsourcing can improve satellite image analysis and how the satellite imagery can be integrated with crowdsourcing. We will also discuss the problems and prospects of collaborative mapping using crowdsourced geographic information and satellite image analysis.
1.3. Structure of this review
Specifically, we will review five aspects of integrating satellite remote sensing images with crowdsourcing to produce high-quality geographical information. In Section 2, we present an overview of using crowdsourcing to make an automated analysis of remote sensing images more robust. In Section 3, we discuss how satellite images can be used to guide crowdsourcing strategies. In Section 4, we focus on collaborative mapping by integrating crowdsourced geographic information with satellite images. In Section 5, we describe the problems and prospects of crowdsourced image analysis using crowdsourcing. Finally, we summarize collaborative mapping techniques and their challenges in Section 6.
2. Improving satellite image analysis via crowdsourcing information
Satellite image analysis is a complex task that requires a comprehensive use of spectral, textural, contextual, and semantic information, as well as an understanding of human cognition. There are currently many machine-based, automated image analysis algorithms that can support satellite image analysis (Tewkesbury et al. Citation2015). These techniques, which include image segmentation, building delineation, and road network extraction, usually need a first guess at the solution by a human analyst to be effective. Such initialization hints can be obtained from crowdsourced data, including positional and land type information provided by human observers. Furthermore, most of the algorithms need analysts who have been trained to set the parameters. Often, these parameters depend on the type of landscape (urban vs. rural areas, for instance) and the characteristics of the image data (e.g. spectral bands, resolution). An existing crowdsourcing group can be used to estimate these parameters. Furthermore, a large class of techniques, such as image classification and object recognition, involve a learning (training) step that requires annotated examples as input. Existing crowdsourced geographic information can be used to define the examples extracted from the images and to annotate them (Christophe, Inglada, and Maudlin Citation2010).
Current satellite image analysis techniques can be divided into two general approaches: pixel-based and object-oriented (Duro, Franklin, and Dubé Citation2012). Therefore, the improvement of satellite image analysis using crowdsourcing can be done at a pixel level or an object level, respectively. The public can define the pixels or objects that will be used as the underlying units to map land cover, land use, damage, and other features of the landscape. The information contained within these units (e.g. spectral, textural, and contextual information) and in the differences among them (Su et al. Citation2012) can be used by volunteers to define the membership of each unit in one or more classes.
2.1. Geo-Wiki.org: the use of crowdsourcing to improve pixel-based global land cover classification
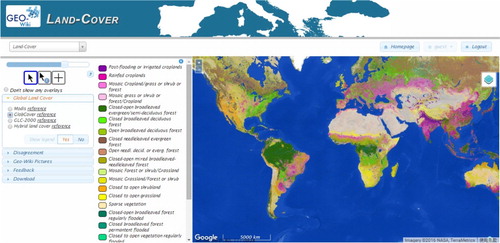
Pixel-based image analysis has long been the main approach for classifying remotely sensed imagery, since pixels are the basic elements of such images, and the pixels are used as the underlying units for classification (Duro, Franklin, and Dubé Citation2012). Most existing global land cover maps are pixel-based classification products. Unfortunately, there are large differences among existing global land cover maps because of differences in the data sources and image-processing algorithms; as a result, global-scale ecosystem and land-use research lack crucial accurate data. Fortunately, crowdsourcing can be used to improve the accuracy of these maps. To assist in this improvement, Fritz et al. (Citation2009) developed a geospatial Wiki site (www.geo-wiki.org) to improve global land cover maps using crowdsourced data (Figure ). The public review hotspot maps of global land cover and assess whether the land cover maps are correct based on what they can see in Google Earth (https://www.google.com/earth/) and on what they can infer based on their local knowledge (Waldner et al. Citation2015). Their input is recorded in a database, along with uploaded photos, and this additional data is being used to create a new and improved hybrid global land cover map. Currently, the Geo-Wiki site offers visualization of three recent global land cover products (GLC-2000, the Moderate Resolution Imaging Spectroradiometer [MODIS] dataset from the Terra and Aqua satellites, and GlobCover). Figure provides an example of a GlobCover visualization.
Figure 2. A visualization of the global land cover types using the GlobCover product provided by the Geo-Wiki.org Web site.
Based on the success of Geo-Wiki, See et al. (Citation2013) proposed an urban Geo-Wiki in which citizens are mobilized to validate global maps of urban extent, Skalský et al. (Citation2014) proposed a soil Geo-Wiki that was designed to support the collection and sharing of soil information, and Fritz et al. (Citation2015) explored the Geo-Wiki approach for mapping the extent of global cropland and the distribution of field sizes.
Fritz et al. also developed a Cropland Capture game (http://www.geo-wiki.org/oldgames/croplandcapture/) to encourage crowdsourcing to contribute image analysis. In this game, users interpret land cover types from around the world using satellite or airborne remote sensing images or photographs or pictures drawn by players or other citizens. To validate a land cover map, the player presses and holds the Alt-key and clicks on the desired pixel, then validates that portion of the land cover map using supporting pictures. The validation methods include a traditional confusion matrix and an error matrix using test samples captured by volunteers.
2.2. The wisdom of crowds on an object level
Object-based image analysis has become increasingly commonplace (Duro, Franklin, and Dubé Citation2012). The public can label the land cover types in segmented remote sensing image objects. Because object-based image analysis relies on a more generalized visual appearance and on a more contiguous depiction of land cover, and people can incorporate their knowledge, experience, and visual evidence while assessing the spectral, textural, and contextual features of images. Because this approach is based on acquired real-world knowledge and wisdom, it can improve the analysis compared with the purely automated interpretation of image properties. Soares et al. (Citation2011, Citation2013) proposed that the ‘wisdom of crowds’ can be used to obtain consensus on a topic or object (e.g. classification or labeling purposes) by collecting and analyzing the opinions of multiple volunteers about specific objects. Their research focuses on labeling of imprecisely segmented image regions and has shown the kind of information that can be inferred from analysis of the individual and collective behavior.
There have been many applications of crowdsourcing to improve remote sensing image analysis, especially in land cover mapping, disaster mitigation, and emergency management. Cervone (Citation2016) argued that we can fill the gaps in remote sensing data by mining data from social media. In disaster management, satellite remote sensing goes beyond crowdsourcing. In some instances, people act as remote sensors without even knowing it. For example, the U. S. Geological Survey (USGS) uses earthquake-related tweets (from the Twitter service) to detect and locate earthquakes. In 2008, the USGS used Google Earth images of Myanmar following Cyclone Nargis to identify infrastructure destroyed in the storm. In this project, 31 members of GISCorps (http://www.giscorps.org/) from around the world spent more than 1300 h working on the project, and were able to identify more than 60,000 buildings, bridges, and roads (http://www.earthmagazine.org/article/rise-community-remote-sensing).
3. Improving crowdsourcing quality based on satellite image analysis
Remote sensing images can be used to develop a strategy for guiding the volunteers to optimize a set of criteria, especially with respect to data quality. There have been some applications of this approach to improve crowdsourcing strategies. For example, the Imagery to the Crowd project (IttC) (https://mapgive.state.gov/ittc/), publishes high-resolution commercial satellite imagery licensed by the United States Government in a format that volunteers can easily map into OpenStreetMap (https://www.openstreetmap.org). Imagery to the Crowd addresses significant data gaps to support humanitarian and development needs (Liu Citation2014).
A complex set of interaction flows, and engagement strategies can be used to improve crowdsourcing strategies based on satellite images. Maisonneuve and Chopard (Citation2012) investigated how a crowdsourcing approach could support the efforts of experts to analyze satellite imagery; one example was for geo-referencing objects. They considered two types of flow to process crowdsourced information: parallel sourcing, in which two or more volunteers independently examine an image, and iterative sourcing, in which one or more subsequent volunteers review and revise previous evaluations. Liu (Citation2014) summarized three other types of flow: crowd seeding, in which volunteers receive cell phones they can use to report their assessments from the field; crowd feeding, in which researchers interact with volunteers to direct them towards points of interest; and crowd harvesting, in which researchers passively harvest information (as in the example of monitoring earthquake tweets). The rest of Section 3 will describe each of these approaches in more detail.
3.1. Parallel sourcing and iterative sourcing
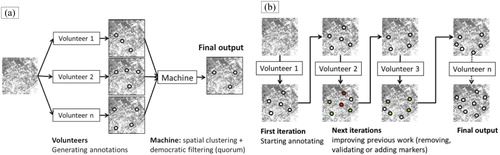
In the parallel sourcing model, volunteers independently perform the same task and generate individual solutions. An aggregation function is then used to synthesize the collective output (Figure (a)). In an iterative sourcing model, a chain of volunteers is used to sequentially review and improve initial solutions (Figure (b)).
Figure 3. Schemas for the (a) parallel and (b) iterative models for organizing crowdsourcing strategies. Source: Maisonneuve and Chopard (Citation2012).
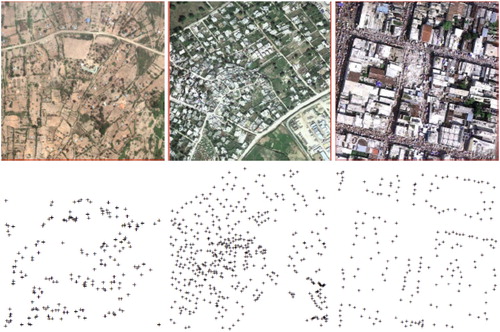
To evaluate the accuracy of the parallel and iterative models, Maisonneuve and Chopard (Citation2012) chose the problem of identifying buildings within three different areas using a Web-based platform that let volunteers annotate objects that they believed were buildings. The three areas have different topologies and different difficulties (Figure ). The top row of images in Figure presents the satellite images and the bottom row presents the buildings identified by experts (the ‘gold standard’). From left to right, the first column represents a sparse area on Rusinga Island in Kenya, the second represents an area in Haiti with a mixture of sparse and dense areas, and the last column represents a dense area of Port au Prince in Haiti.
Figure 4. (Top) Images of three areas with different topologies and densities of buildings. (Bottom) Expert classification of buildings from these images. Source: Maisonneuve and Chopard (Citation2012).
Maisonneuve and Chopard investigated the quality of the parallel and iterative approaches based on their accuracy (type I and type II errors) and on the consistency of the results. The parallel strategy, which generates consensus results, corrects type I errors (wrong annotations) better than the iterative model. However, in difficult areas (e.g. the third satellite image in Figure ), it does not effectively resolve disagreements. The iterative model outperforms the parallel model for heterogeneous areas, but with a potential path-dependency effect: mistakes may propagate, generating type I errors more easily as the iterations proceed. They also observed that the iterative model reduces type II errors (increases accuracy) from one iteration to the next one. However, the iterative model wastes time for the volunteers and their community (because each new assessment must wait until the previous assessment is complete) and may therefore be inappropriate in applications such as disaster response, where a fast response is essential. The parallel model also provides an output that is more consistent than the basic iterative approach because the latter permits a loss of knowledge through incorrect revision of previously correct assessments.
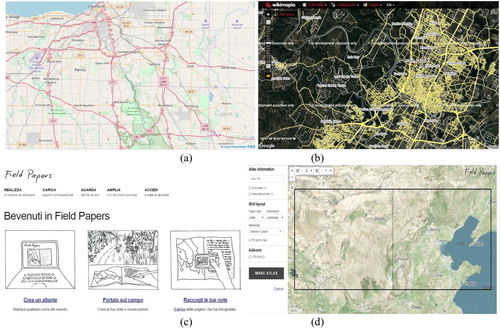
Figure 5. Platform of OSM (a), Wikimapia (b) and field papers (c,d).
3.2. Crowd seeding, crowd feeding, and crowd harvesting
Van der Windt (Citation2012) coined the term ‘crowd seeding’ to describe an approach that ‘combines the innovations of crowdsourcing with standard principles of survey research and statistical analysis’. Liu (Citation2014) made this concept concrete using an example in which researchers establish an active, one-way request that pre-identifies and engages with certain people in a crowd, sometimes empowering them by providing tools that permit or facilitate the engagement. Crowd seeding was used to translate and geocode the Mission 4636 messages (http://www.mission4636.org/) that supported international aid efforts after the 2010 Haitian earthquake.
‘Crowd feeding’ moves beyond one-way interactions to create an active, two-way feedback loop between researchers and the crowd, typically through networking technologies. There are two forms of crowd-feeding: in one, data generated, or tasks conducted by the crowd are fed to or shared back with the crowd; in the other, the crowd receives feedback after processing of the crowdsourced data.
‘Crowd harvesting’ is a passive, one-way information flow that does not direct the crowd to perform a task, but rather harvests or mines the crowded data or services, sometimes without their direct knowledge or consent. The USGS Tweet Earthquake Dispatch (TED) system (https://earthquake.usgs.gov/earthquakes/ted/) sent an alert 20 s after the start of the magnitude 4.0 Maine earthquake in 2012. The system uses an algorithm to sense or detect earthquakes based on significant spikes in seismic-related tweets. This system automatically harvests Twitter data from many earthquake-related tweets, and when a certain threshold is exceeded, this triggers the TED real-time earthquake detection system.
4. Collaborative mapping by integrating crowdsourced data and satellite images
Remote sensing images offer a realistic perpendicular view for a relatively large area with acceptable geometric accuracy. However, correction of 3D geometry is a task that is well-suited to crowdsourcing; for example, publics with GPS devices (including many smartphones) can provide 3D data on points of interest, seen from different perspectives, that can be used to correct the image geometry. OpenStreetMap, Google Maps, and Wikimapia (wikimapia.org/) are examples of collaborative mapping projects that aim to produce a digital map of the world (Ali et al. Citation2017). Among the associated tools, DeepOSM (https://github.com/trailbehind/DeepOSM) is neural network software that can be trained to classify roads and features in satellite imagery using OpenStreetMap (OSM) data as the training data. In addition, Terrapattern (www.terrapattern.com) is a neural network tool for reverse image searches in maps and is trained using inputs from volunteers. As noted earlier, there are many other applications for collaborative mapping. These tools let researchers integrate crowdsourced location data or event positions with remote sensing images (Goodchild and Glennon Citation2010; Zook et al. Citation2010) using a variety of clustering (Huynh et al. Citation2013) and cognitive (Kerle and Hoffman Citation2013) techniques.
4.1. Geotagging satellite images
Geotagging is the annotation of media or information (such as photographs or tweets) with geographic coordinates to define the place of creation or relevance (Schmid et al. Citation2013). Meier and Werby (Citation2011) argued that the 2010 Haiti earthquake was the first disaster in which aid workers used the free and open-source mapping tool Ushahidi (https://www.ushahidi.com/), which means ‘witness’ in Swahili, to assist search and rescue operations and help deliver aid to where it was needed most. Within a short period after the 12 January 2010 Haiti earthquake, a coalition of partners set up the Mission 4636 project to allow anyone in the country to text their location and most urgent needs. In addition, Zook et al. (Citation2010) described how information technology was used in the Haiti relief effort, including crowdsourced data and satellite images. Workers combined high-quality satellite imagery from Google Maps, DigitalGlobe (https://www.digitalglobe.com/), and GeoEye (http://www.satimagingcorp.com/gallery/geoeye-1/) with crowdsourced data to help coordinate the delivery of emergency relief. Their application was limited to marking disaster locations on a remote sensing image, so there is clearly room to advance this technology. Goodchild and Glennon (Citation2010) studied ways to interpret the location of a fire, evacuation orders, and the locations of emergency shelters in the hills behind Santa Barbara during the Tea Fire in November 2008 and the Jesusita Fire in May 2009. They used images with fine temporal resolution, such as data from MODIS, and images with fine spatial resolution, such as Google Maps.
There are many platforms of collaborative mapping to geotag on satellite images. And the OpenStreetMap (OSM), Wikimapia and Field Papers are reviewed here. OpenStreetMap (OSM) is a collaborative project to create a free editable map of the world (See, Fritz, and Leeuw Citation2013). The creation and growth of OSM has been motivated by restrictions on use or availability of map information across much of the world, and the advent of inexpensive portable satellite navigation devices. And Figure (a) is the interface of OSM (https://www.openstreetmap.org) for creating new places/street or editing the existing places/street. Wikimapia is an online editable map, and public can describe any place on earth or just surf the map discovering tons of already marked places. And Figure (b) is the developing interface of Wikimapia (http://wikimapia.org) by displaying satellite image and vector map of roads and boundary regions together. Field Papers (http://fieldpapers.org/) is a tool to create a multi-page atlas of anywhere in the world. Public can take the maps outside, into the field, to record notes and observations about the area they are looking at or use it as their own personal tour guide in a new city after they print it. And Figure (c) is the interface for logging in the interface of map editing on satellite remote sensing images (Figure (d)).
4.2. Using cognitive task analysis to unite volunteers with remote sensing specialists
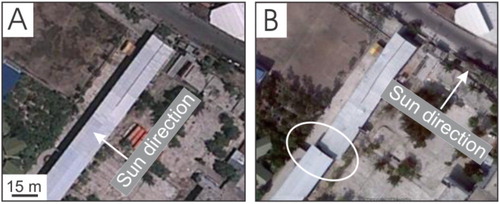
Collaborative mapping for emergency response is a complex cognitive work system that depends crucially on an understanding of the mapping goals by volunteers who are experienced in remote sensing using Internet-based mapping portals, working together with remote sensing specialists. Crowdsourcing by volunteers who have experience with remote sensing is a potentially powerful tool for assessing disaster damage. Beginning in 2008, following Cyclone Nargis in Myanmar and the Wenchuan earthquake in China, the first attempts were made to apply collaborative mapping by a form of crowdsourcing (Goodchild and Glennon Citation2010) in post-disaster situations. Kerle and Hoffman (Citation2013) proposed the cognitive task analysis method to understand the information and decision requirements of the map and image users, with the goal of making it possible to optimally instruct volunteers and merge their mapping contributions into suitable map products. Cognitive task analysis (Crandall, Klein, and Hoffman Citation2006) is the primary methodology used in cognitive systems engineering (Hoffman and Woods Citation2000), which can be used for collaborative damage mapping during an emergency response. For example, such proxies for the passage of time as missing or smaller shadows compared to the pre-event situation (Figure (a)), different roof offsets between adjacent buildings (e.g. the oval in Figure (b)), or non-overlap of pre-disaster building polygons (Figure (b)), can be used to do collaborative damage mapping (Meier and Werby Citation2011). To solve the fundamental issues about how to best design a methodology for collaborative mapping during an emergency response, they recommend the iterative approach involving map users, remote sensing specialists, cognitive systems engineers, and instructional designers, as well as experimental psychologists. USAID/Rwanda developed a collaboration map to graphically depict the relationships of USAID with its key stakeholders, and the cognitive analysis method was used in the process finding these relationships (USAID Citation2018). They used excel-based worksheet to customize the map’s three stakeholder/relationship dimensions, i.e. take stock of the current relationship, determine resource-based influence, determine non-resource-based influence.
Figure 6. Use of time proxies for the cognitive task analysis method in structural building damage assessment before (A) and after (B) disaster. ©Google Earth. Source: Kerle and Hoffman (Citation2013).
5. Challenges and opportunities
With the increasing availability of high-resolution remote sensing images, the number of potential applications of satellite image analysis has expanded. However, it is necessary to incorporate human knowledge in these efforts to produce a successful image analysis product. Unfortunately, the participation process that acquires this knowledge is labor intensive. Crowdsourcing is inexpensive, but there is no guarantee of high-quality information, and the spatial and temporal coverage may be inadequate for some purposes. Thus, many researchers are examining how satellite image analysis and crowdsourcing can work together more effectively. In this section, we will describe some of the challenges these researchers face and the opportunities for success.
5.1. Challenges
5.1.1. Challenges for combining crowdsourcing and satellite image analysis
Crowdsourcing is inexpensive and allows Internet users from any region to get involved in image analysis. Their inputs can resolve the many uncertainties that remain unsolved in satellite image analysis. There are three main challenges that must be overcome to optimize the potential of crowdsourcing for satellite image analysis: attracting and motivating more people for image analysis, maintaining the crowdsourced data quality and preventing sabotage, developing the strategy to optimize data criteria. A problem is that data produced by volunteers is often considered to be of lesser quality than data produced by experts (Coleman, Georgiadou, and Labonte Citation2009; Heipke Citation2010), even though crowdsourcing provides a rich source of user-generated content that is difficult to replace. Therefore, we have summarized these challenges in two contexts: motivating volunteers to participate and maintain quality and performing collaborative mapping.
The first challenge is how to attract and motivate a wide range of volunteers and non-volunteers who might like to get involved in remote sensing image analysis, but motivating people who have some experience with geography, visual image analysis, and mapping would be particularly useful. People are crucial for non-profit organizations, so knowing how to attract and retain them is an important challenge. One solution is to use social networks (Granell and Ostermann Citation2016) and existing groups to advertise volunteer opportunities. Another option is to create competitive games (Salk et al. Citation2015) that make the effort more fun.
The second challenge is how to maintain an adequate level of quality and to prevent sabotage by people who are interested in undermining the credibility of the work. The validation will only be truly successful if it uses some form of self-monitoring by the group. The Wikipedia (https://www.wikipedia.org/) provides both a possible model for success and an example of how such an approach can fail. On the positive side, the entries are edited and monitored collaboratively by volunteers, and can therefore be revised to include a range of opinions (Goodchild Citation2008). On the negative side, such volunteers may become fatigued and unable to provide adequate monitoring, thereby allowing errors or even deliberate sabotage to go undetected; editors with a political or other agenda can modify entries in ways that many readers would object to it (https://en.wikipedia.org/wiki/Criticism_of_Wikipedia). In a research context or a real-world context such as disaster response, such tampering can lead to unusable data or the loss of lives; thus, volunteer monitoring will be insufficient, and a professional monitor (e.g. the researcher or an aid coordinator) must take responsibility for the monitoring.
The third challenge is how to develop a strategy that volunteers can use to optimize a set of criteria, especially those related to data quality. Maisonneuve and Chopard (Citation2012) developed parallel and iterative models for crowdsourced image analysis. As noted earlier, the two models have different strengths and weaknesses. They found that the parallel model tends to reduce type I errors (fewer false identifications) by filtering to select only consensus results, whereas the iterative model tends to reduce type II errors (better completeness) and outperforms the parallel model for difficult or complex areas thanks to the accumulation of knowledge. Their goal in future research is to develop a hybrid model based on the iterative model to take advantage of knowledge accumulation. In the proposed hybrid model, volunteers should be allocated preferentially to the current annotations with the greatest uncertainty. This uncertainty can, in turn, be estimated by the degree of uncertainty of a single volunteer or by the degree of disagreement within a group of volunteers.
5.1.2. Challenges for collaborative mapping
Crowdsourcing can exploit local knowledge for collaborative mapping, because the participants work together to collect, share, and use information about geographic features. The rich shared body of geographic data can be used to improve image analysis, particularly for applications in which the location, time, and nature of an event are unknown. However, there are challenges for the crowdsourcing used in collaborative mapping: data is likely to be subjective, remote contributions and flexible contribution mechanisms result in imprecise classification of crowdsourced geographic data, and spatial data may contain uncertainties due to factors such as insufficiently strict definitions of geographic features. Ali et al. (Citation2017) found that these challenges introduced problems related to inconsistency, incompleteness, and imprecise classification. For example, whether the image object covered by grass in the middle of the image should be classified as a park, a garden, a meadow, or grassland is not strictly defined.
For collaborative mapping using crowdsourced geographic data, several challenges must be overcome:
How can the mapping objective be conveyed comprehensively and unambiguously? The difficulty of this challenge depends on the mapping objectives. Generally speaking, land use and land cover classification is dichotomous, and the challenges lie in performing classifications because the image pixels or objects are not always strictly defined, as Figure shows. In damage mapping applications, explaining the system is particularly challenging because the expression of damage in images is highly variable and complex (e.g. physical damage may be continuous rather than binary or discrete).
How can the problem of the different viewing angles for remote sensing images and volunteer photos be resolved? Volunteer photos provide detailed views of different sides of an object such as a building, and possibly even the interior of the object. In contrast, vertical, single-view satellite images offer one or few perspectives and considerably less detail. How to register, match, assess, and interpret the images produced by collaborative mapping can be challenging. On the other hand, the additional information provided by multiple perspectives could be transformed from a problem to an opportunity to improve the analysis.
How can the contributions of many volunteers be merged and evaluate? Collaborative mapping offers the great advantage of parallel processing, leading to potentially enormous time savings, while keeping the mapping load per individual manageable. However, few of the volunteers will have had experience in such projects. Thus, their contributions must be checked for accuracy, completeness, and errors while also providing feedback (whether manual or automatic) during mapping by suggesting modifications to the procedure or alerting volunteers to likely mapping errors (Zook et al. Citation2010).
5.2. Opportunities
5.2.1. Improving crowdsourced data quality via image analysis
Maintaining the quality of crowdsourcing is crucial to allow its use in satellite image analysis. The satellite image and image analyzed results can be used to assess data completeness of crowdsourced data through the automated matching procedures (Koukoletsos, Haklay, and Ellul Citation2012; Zielstra, Hochmair, and Neis Citation2013) and assess the crowdsourced data accuracy including attribute and positional accuracy (Foody et al. Citation2013). About the assessing of data completeness for crowdsourced data, Koukoletsos et al. developed a method to match crowdsourced data to analyzed results from satellite image and evaluate its quality. Their method combined geometric and attribute constraints from road name and road type to process heterogeneous datasets, by considering the attributes that may be missing. Zielstra et al. completed and assessed the quality of OSM road data using new OSM editor tools allowing contributors to trace current TIGER/Line data based on the satellite image. Therefore, the further opportunities should be included: (1) developing the more generable and more robust data quality accuracy assessment method for crowdsourced data, covering also cases where one of them is heterogeneous and uncertain; (2) revealing more details about how to do a more comprehensive analysis of the type of data, i.e. feature types and attributes etc.; (3) setting up the accuracy assessment model and efficiency assessment model for more dataset types and formats; (4) expanding the crowdsourced data completeness assessment methods and accuracy assessment methods to other countries and word widely.
5.2.2. Enhancing image analysis using crowdsourced data
High-quality crowdsourced shows considerable potential to improve satellite image analysis. For example, Geo-wiki will make it possible to identify the correct land cover type from a consistent global land cover map in situations where a given pixel has been incorrectly labeled. Moreover, depending on the number of validations, it will be necessary to keep track of which validations are based on older images, since land use and cover types change, and more recent images or data may be available to update the older classification. There have been many improvements and achievements about the combination of image analysis and crowdsourcing. However, there are still some opportunities, which are as followed.
(1) Finding the new and robust ways to enhance the error tolerance of image analysis using crowdsourced data. Currently, if the land type or thematic attribute should be changed depends on the information shared by individuals and the accuracy of the shared data influences the outcomes. One way to answer this question is setting up a robust mechanism for filtering out the lower quality contributions from those of high, acceptable quality data. In addition, strengthen the feedback mechanisms that judging the land type or thematic attribute should be changed. (2) Integrating more other crowdsourced data sources beside Geo-Wiki for satellite image analysis, such as OSM, Wikimapia, Field Papers and Flickr photos etc. Moreover, how do we create a sustainable community that engages ordinary citizens and enhance their skills for creating new hybrid product is a problem should be pay attention. (3) Finding the ways to solve the social problems by combining crowdsourced data and image analysis techniques. For an example, we can generate new and non-existent but realistic images using conditional adversarial neural networks based on crowdsourced data by combining the remote sensing image on the website of Invisible Cities (https://opendot.github.io/ml4a-invisible-cities/implementation). This is positive originally, for simulating the possible results for given disaster or events. However, it maybe results in an unnecessary panic to public if some people malicious changing on land cover type, thematic attributes, or even the remote sensing images. Therefore, there are potential researches about exploring this kind of malicious false images by combining the crowdsourced data and the image analysis. (4) Extending the application to other fields, such as earthquake damage monitoring and assessment, temporal estimation and simulation of the floods, water classification, transportation monitoring and assessment etc. by combining the crowdsourced data and the image analysis.
5.2.3. Opportunities for collaborative mapping
For collaborative mapping, choosing the most appropriate image characteristics (e.g. pixel versus object) will affect the quality and quantity of crowdsourcing. Small differences between observations may not be recognizable, particularly for non-experts (Kerle and Hoffman Citation2013). To solve this problem, a rule-guided classification approach has been proposed. Ali et al. (Citation2017) attempted to extract descriptive (qualitative) rules for specific geographic features to guide volunteers toward the most appropriate classification. They developed empirical rules to enhance the data quality for identification of grass-related features such as open forest, gardens, parks, and meadows. In the future, such an approach can be used to develop qualitative or quantitative classification rules that can be used to improve the accuracy of collaborative mapping. This will help to reduce the subjectivity of volunteer assessments and thereby decrease the uncertainty in spatial data that arises from insufficiently strict definitions of geographic features and their characteristics.
In addition, there have been some data-mining approaches based on examination of public data such as the tweets published by the members of Twitter and more participatory approaches, including approaches based on cognitive task analysis. Examples include DeepOSM, OSM-Crosswalk-Detection (https://github.com/smajida/OSM-Crosswalk-Detection), OSM-HOT-ConvNet (https://github.com/larsroemheld/OSM-HOT-ConvNet), Terrapattern, and Skynet Data (https://github.com/developmentseed/skynet-data). Rule-guided methods such as DeepOSM are now being developed to support collaborative mapping. Therefore, there is promising opportunities for data mining in multiple dimensions collaborative mapping combining crowdsourced data and satellite image analysis.
6. Summary and conclusions
In this paper, we have summarized the current, challenges and opportunities of collaborative mapping by combining satellite image analysis with crowdsourcing. Our goal was to investigate the ways that a crowdsourcing approach that includes involvement by both experts and non-experts could support efforts to expand the analysis of satellite imagery, as in the case of geo-referencing points and objects. Through this summary we conclude as followed:
The crowdsourced data with high quality can be used to improve satellite image analysis. And Geo-Wiki and ‘wisdom of crowds’ are examples of using crowdsourced data to improve land cover classification based on satellite images. Based on the current remarkable achievements on improving satellite image analysis using crowdsourced data, the further deep application can be extended to other field areas, such as earthquake damage monitoring and assessment, temporal estimation and simulation of the floods, transportation monitoring and assessment etc.
Data quality of crowdsourcing can be improved by satellite image analysis results. There are two kinds of strategies for incorporating image analysis results to improve crowdsourced data quality such as parallel model and iterative model, and there is a balance between type I and type II errors. And crowd seeding, crowd feeding, and crowd harvesting are the descriptions of combining, feedback and task perform process of crowdsourcing and image analysis.
Geotagging satellite images and uniting volunteers with remote sensing specialists using cognitive task analysis are two ways for collaborative mapping by integrating crowdsourced data and satellite images.
Challenges for combining crowdsourcing and satellite image analysis lie in attracting and motivate a wide range of public for crowdsourced data collection and calibration, guaranteeing the data quality, and developing a strategy to optimize the combination of crowdsourced data and satellite image analysis. For the collaborative mapping, the challenges lie in conveying the mapping objective comprehensively and unambiguously, resolving the problem of the different viewing angles for remote sensing images and volunteer photos, and merging and evaluating the contributions of many volunteers.
There are many opportunities on improving crowdsourced data quality via image analysis, enhancing image analysis using crowdsourced data, and collaborative mapping. For example, developing the framework of improving crowdsourced data quality, finding the ways to enhance the error tolerance of image analysis, and strengthening the usage of data-mining techniques for collaborative mapping.
Acknowledgments
We thank the journal's reviewers for their efforts to improve the quality of our manuscript.
Disclosure statement
No potential conflict of interest was reported by the authors.
Additional information
Funding
References
- Ali, A. L., Z. Falomir, F. Schmid, and C. Freksa. 2017. “Rule-guided Human Classification of Volunteered Geographic Information.” ISPRS Journal of Photogrammetry & Remote Sensing 127: 3–15. doi:10.1016/j.isprsjprs.2016.06.003.
- Barrington, L., S. Ghosh, M. Greene, and S. Harnoy. 2011. “Crowdsourcing Earthquake Damage Assessment Using Remote Sensing Imagery.” Annals of Geophysics 54 (6): 680–687. doi:10.4401/ag-5324.
- Brabham, D. C. 2008. “Crowdsourcing as a Model for Problem Solving an Introduction and Cases.” Convergence: The International Journal of Research Into New Media Technologies 14 (1): 75–90. doi:10.1177/1354856507084420.
- Brabham, D. C. 2013. Crowdsourcing. Cambridge: The MIT Press.
- Cervone, G. 2016. “Mining Social Media to Task Satellite Data Collection During Emergencies.” 2016 SPIE. doi:10.1117/2.1201604.006400.
- Christophe, E., J. Inglada, and J. Maudlin. 2010. “Crowd-sourcing Satellite Image Analysis.” In Geoscience and Remote Sensing Symposium (IGARSS)” IEEE Geoscience and Remote Sensign Society, 1430–1433. doi:10.1109/IGARSS.2010.5648833.
- Coleman, D. J., Y. Georgiadou, and J. Labonte. 2009. “Volunteered Geographic Information: The Nature and Motivation of Producers.” International Journal of Spatial Data Infrastructures Research 4 (1): 332–358.
- Crandall, B., G. A. Klein, and R. R. Hoffman. 2006. Working Minds: A Practitioner’s Guide to Cognitive Task Analysis. Cambridge: MIT Press.
- Defourny, P. P., L. Schouten, S. Bartalev, S. P. Bontemps, P. Caccetta, A. J. W. P. de Wit, C. P. Di Bella, et al. 2009. “Accuracy Assessment of a 300m Global Land Cover Map: The GlobCover Experience.” New Library World 112 (5–6): 236–247.
- Duro, D. C., S. E. Franklin, and M. G. Dubé. 2012. “A Comparison of Pixel-based and Object-based Image Analysis with Selected Machine Learning Algorithms for the Classification of Agricultural Landscapes Using SPOT-5 HRG Imagery.” Remote Sensing of Environment 118 (6): 259–272. doi:10.1016/j.rse.2011.11.020.
- Estellésarolas, E. 2012. “Towards an Integrated Crowdsourcing Definition.” Journal of Information Science 38 (2): 189–200. doi:10.1177/0165551512437638.
- Foody, G. M., L. See, S. Fritz, M. V. D. Velde, C. Perger, C. Schill, and D. S. Boyd. 2013. “Assessing the Accuracy of Volunteered Geographic Information Arising From Multiple Contributors to an Internet Based Collaborative Project.” Transactions in GIS 17 (6): 847–860. doi: 10.1111/tgis.12033
- Foth, M., B. Bajracharya, R. Brown, and G. Hearn. 2009. “The Second Life of Urban Planning? Using NeoGeography Tools for Community Engagement.” Journal of Location Based Services 3: 97–117. doi:10.1080/17489720903150016.
- Fritz, S., I. McCallum, C. Schill, C. Perger, R. Grillmayer, F. Achard, F. Kraxner, and M. Obersteiner. 2009. “Geo-wiki.org: A Global Platform to Visualize, Crowd-source and Improve Information on Global Land Cover and Land Use.” Remote Sensing 1: 345–354. doi:10.3390/rs1030345.
- Fritz, S., L. See, I. Mccallum, L. You, A. Bun, E. Moltchanova, M. Duerauer, et al. 2015. “Mapping Global Cropland and Field Size.” Global Change Biology 21 (5): 1980–1992. doi:10.1111/gcb.12838.
- Goodchild, M. F. 2008. “Commentary: Whither VGI?” GeoJournal 72: 239–244. doi:10.1007/s10708-008-9190-4.
- Goodchild, M. F. 2011. “Citizens as Sensors: The World of Volunteered Geography.” In The Map Reader: Theories of Mapping Practice and Cartographic Representation, edited by M. Dodge, R. Kitchin, and C. Perkins, 370–378. New York: Wiley.
- Goodchild, M. F., and J. A. Glennon. 2010. “Crowdsourcing Geographic Information for Disaster Response: A Research Frontier.” International Journal of Digital Earth 3 (3): 231–241. doi:10.1080/17538941003759255.
- Gouveia, C., and A. Fonseca. 2008. “New Approaches to Environmental Monitoring: The Use of ICT to Explore Volunteered Geographic Information.” GeoJournal 72: 185–197. doi:10.1007/s10708-008-9183-3.
- Granell, C., and F. O. Ostermann. 2016. “Beyond Data Collection: Objectives and Methods of Research Using VGI and Geo-social Media for Disaster Management.” Computers Environment & Urban Systems 59: 231–243. doi:10.1016/j.compenvurbsys.2016.01.006.
- Haklay, M., and P. Weber. 2008. “OpenStreetMap: User-generated Street Maps.” IEEE Pervasive Computing 7: 12–18. doi:10.1109/MPRV.2008.80.
- Heipke, C. 2010. “Crowdsourcing Geospatial Data.” ISPRS Journal of Photogrammetry and Remote Sensing 65 (6): 550–557. doi:10.1016/j.isprsjprs.2010.06.005.
- Hirth, M., T. Hoßfeld, and P. Tran-Gia. 2011. “Anatomy of a Crowdsourcing Platform – Using the Example of Microworkers.com.” Fifth International Conference on Innovative Mobile and Internet Services in Ubiquitous Computing, IEEE, 322–329. doi:10.1109/IMIS.2011.89.
- Hoffman, R. R., and D. D. Woods. 2000. “Studying Cognitive Systems in Context: Preface to the Special Section.” Human Factors 42 (1): 1–7. doi:10.1518/001872000779656633.
- Howe, J. 2006. “The Rise of Crowdsourcing.” WIRED Magazine. Accessed March 14, 2017. http://distcomp.ethz.ch/lectures/fs10/seminar/paper/michael-8.pdf.
- Huynh, A., K. Ponto, A. Y. M. Lin, and F. Kuester. 2013. “Visual Analytics of Inherently Noisy Crowdsourced Data on Ultra High Resolution Displays.” Aerospace Conference. IEEE, 2013: 1–8. doi:10.1109/AERO.2013.6497421.
- Kerle, N., and R. R. Hoffman. 2013. “Collaborative Damage Mapping for Emergency Response: The Role of Cognitive Systems Engineering.” Natural Hazards & Earth System Sciences 13 (1): 97–113. doi:10.5194/nhess-13-97-2013.
- Koukoletsos, T., M. Haklay, and C. Ellul. 2012. “Assessing Data Completeness of VGI Through an Automated Matching Procedure for Linear Data.” Transactions in GIS 16 (4): 477–498. doi: 10.1111/j.1467-9671.2012.01304.x
- Kryvasheyeu, Y., H. Chen, N. Obradovich, E. Moro, P. Van Hentenryck, J. Fowler, and M. Cebrian. 2016. “Rapid Assessment of Disaster Damage Using Social Media Activity.” Science Advances 2 (3): e1500779. doi:10.1126/sciadv.1500779.
- Liu, S. B. 2014. “Crisis Crowdsourcing Framework: Designing Strategic Configurations of Crowdsourcing for the Emergency Management Domain.” Computer Supported Cooperative Work (CSCW) 23 (4): 389–443. doi:10.1007/s10606-014-9204-3.
- Maisonneuve, N., and B. Chopard. 2012. “Crowdsourcing Satellite Imagery Analysis: Study of Parallel and Iterative Models.” In Geographic Information Science, edited by N. Xiao, M. P. Kwan, M. F. Goodchild, and S. Shekhar, 116–131. Berlin: Springer. doi:10.13140/RG.2.1.1994.9285.
- Meier, P., and O. Werby. 2011. “Ushahidi in Haiti: The Use of Crisis Mapping During the 2009 Earthquake in Haiti.” In Proceedings of the IADIS Int. Conf. ICT, Society and Human Beings 2011, Proceedings of the IADIS International Conference e-Democracy, Equity and Social Justice 2011, Part of the IADIS, MCCSIS, 247–250.
- Mooney, P., and P. Corcoran. 2011. “Can Volunteered Geographic Information be a Participant in EEnvironment and SDI?” In Environmental Software Systems. Frameworks of Environment, edited by J. Hrebicek, G. Schimak, and R. Denzer, 115–122. Berlin: Springer. doi:10.1007/978-3-642-22285-6_13.
- Mooney, P., H. Sun, and L. Yan. 2011. ““VGI as a Dynamically Updated Data Source in Location-based Services in Urban Environments”.” In Proceedings of the 2nd International Workshop in Ubiquitous Crowdsourcing: UbiCrowd’11, Beijing, China, 17–21 September, edited by M. Vukovic and S. Kumara. New York: Association for Computing Machinery.
- Pekkarinen, A., L. Reithmaier, and P. Strobl. 2009. “Pan-European Forest/Non-forest Mapping with Landsat ETM+ and CORINE Land Cover 2000 Data.” ISPRS Journal of Photogrammetry & Remote Sensing 64 (2): 171–183. doi:10.1016/j.isprsjprs.2008.09.004.
- Prpic, J., and P. Shukla. 2016. “Crowd Science: Measurements, Models, and Methods.” Paper Presented in Proceedings of the 49th Annual Hawaii International Conference on System Sciences, Kauai, Hawaii, IEEE Computer Society.
- Prpic, J., A. Taeihagh, and J. Melton. 2015. “The Fundamentals of Policy Crowdsourcing.” Policy & Internet 7 (3): 340–361. doi:10.1002/poi3.102.
- Roche, S., E. Propeck-Zimmermann, and B. Mericskay. 2013. “GeoWeb and Crisis Management: Issues and Perspectives of Volunteered Geographic Information.” GeoJournal 78: 21–40. doi:10.1007/s10708-011-9423-9.
- Salk, C. F., T. Sturn, L. See, S. Fritz, and C. Perger. 2015. “Assessing Quality of Volunteer Crowdsourcing Contributions: Lessons from the Cropland Capture Game.” International Journal of Digital Earth 8 (4): 1–17. doi:10.1080/17538947.2015.1039609.
- Savelyev, A., S. Xu, K. Janowicz, C. Mülligann, J. Thatcher, and W. Luo. 2011. “Volunteered Geographic Services: Developing a Linked Data Driven Location-Based Service.” In Proceedings of the 1st ACM Sigspatial International Workshop on Spatial Semantics and Ontologies, Chicago, IL, November 1, edited by N. Wiegand, G. Berg-Cross, and D. Varanka, 25–31. New York: Association for Computing Machinery.
- Schenk, E., and C. Guittard. 2009. “Crowdsourcing: What Can be Outsourced to the Crowd, and Why?” Accessed on April 13, 2017. https://www.researchgate.net/profile/Claude_Guittard/publication/40270166_Crowdsourcing_What_can_be_Outsourced_to_the_Crowd_and_Why_/links/00b7d523b03088fbd1000000.
- Schmid, F., L. Frommberger, C. Cai, and F. Dylla. 2013. “Lowering the Barrier: How the What-you-see-is-What-you-map Paradigm Enables People to Contribute Volunteered Geographic Information.” In ACM Symposium on Computing for Development (DEV-4), Cape Town, South Africa, edited by M. Martonosi and B. Raman. New York: Association for Computing Machinery.
- See, L., S. Fritz, and J. D. Leeuw. 2013. “The Rise of Collaborative Mapping: Trends and Future Directions.” ISPRS International Journal of Geo-Information 2 (4): 955–958. doi: 10.3390/ijgi2040955
- See, L., S. Fritz, C. Perger, M. V. D. Velde, D. Schepaschenko, and M. Obersteiner. 2013. “Urban Geo-wiki: A Crowdsourcing Tool to Improve Urban Land Cover.” In Citizen E-Participation in Urban Governance: Crowdsourcing and Collaborative Creativity, IGI Global, edited by C. Nunes Silva, 119–143. doi:10.4018/978-1-4666-4169-3.ch008.
- Skalský, R., J. Balkovic, S. Fritz, L. See, V. D. V. Marijn, and M. Obersteiner. 2014. “Soil Geo-wiki: A Tool for Improving Soil Information.” EGU General Assembly Conference Abstracts. Accessed March 14, 2017. http://presentations.copernicus.org/EGU2014-2540_presentation.pdf.
- Soares, M. D., R. Santos, N. Vijaykumar, and L. Dutra. 2011. “Analysis of User Behavior and Difficulty in Labeling Polygons of a Segmented Image in a Citizen Science Project.” Journal of Computer Science 29: 26–37. doi:10.1.1.431.5528.
- Soares, M. D., R. Santos, N. L. Vijaykumar, and L. V. Dutra. 2013. “Analysis of User Proficiency and Involvement in a Citizen Science Project.” Cadernos do IME–Série Informática 29: 26–37. doi:10.12957/cadinf.2010.6543.
- Su, W., C. Zhang, J. Y. Yang, H. G. Wu, L. Deng, W. H. Ou, A. Z. Yue, and M. J. Chen. 2012. “Analysis of Wavelet Packet and Statistical Textures for Object-oriented Classification of Forest-Agriculture Ecotones Using SPOT 5 Imagery.” International Journal of Remote Sensing 33 (11): 3557–3579. doi:10.1080/01431161.2010.532823.
- Sui, D., S. Elwood, and M. Goodchild. 2012. Crowdsourcing Geographic Knowledge: Volunteered Geographic Information (VGI) in Theory and Practice, 847–849. Berlin: Springer.
- Sui, D., M. Goodchild, and S. Elwood. 2013. “Volunteered Geographic Information, the Exaflood, and the Growing Digital Divide.” In Crowdsourcing Geographic Knowledge: Volunteered Geographic Information (VGI) in Theory and Practice, edited by D. Sui, S. Elwood, and M. Goodchild, 1–12. Berlin: Springer. doi:10.1007/978-94-007-4587-2_1.
- Tewkesbury, A. P., A. J. Comber, N. J. Tate, A. Lamb, and P. F. Fisher. 2015. “A Critical Synthesis of Remotely Sensed Optical Image Change Detection Techniques.” Remote Sensing of Environment 160: 1–14. doi:10.1016/j.rse.2015.01.006.
- Tulloch, D. 2014. “Crowdsourcing Geographic Knowledge: Volunteered Geographic Information (VGI) in Theory and Practice.” International Journal of Geographical Information Science 28 (4): 847–849. doi:10.1080/13658816.2013.873440.
- USAID. 2018. Accessed on October 2, 2018. https://usaidlearninglab.org/library/collaboration-mapping.
- Van der Windt, P. 2012. “From Crowdsourcing to Crowd Seeding: The Cutting Edge of Empowerment.” Accessed March 14, 2017. http://petervanderwindt.files.wordpress.com/2012/03/crowdseedingoup.pdf.
- Waldner, F., S. Fritz, A. D. Gregorio, and P. Defourny. 2015. “Mapping Priorities to Focus Cropland Mapping Activities: Fitness Assessment of Existing Global, Regional and National Cropland Maps.” Remote Sensing 7: 7959–7986. doi:10.3390/rs70607959.
- Wikipedia. 2016. Edited on January 2016. Assessed October 1, 2018. https://en.wikipedia.org/wiki/Collaborative_mapping.
- Zhang, Y., and N. Kerle. 2008. “Satellite Remote Sensing for Near-real Time Data Collection.” In Geospatial Information Technology for Emergency Response, edited by S. Zlatanova and J. Li, 75–102. London: Taylor & Francis.
- Zielstra, D., H. H. Hochmair, and P. Neis. 2013. “Assessing the Effect of Data Imports on the Completeness of OpenStreetMap – A United States Case Study.” Transactions in GIS 17 (3): 315–334. doi: 10.1111/tgis.12037
- Zook, M., M. Graham, T. Shelton, and S. Gorman. 2010. “Volunteered Geographic Information and Crowdsourcing Disaster Relief: A Case Study of the Haitian Earthquake.” World Medical Health Policy 2: 7–33. doi:10.2202/1948-4682.1069.