
 ?Mathematical formulae have been encoded as MathML and are displayed in this HTML version using MathJax in order to improve their display. Uncheck the box to turn MathJax off. This feature requires Javascript. Click on a formula to zoom.
ABSTRACT
Urban areas presently consume around 75% of global primary energy supply, which is expected to significantly increase in the future due to urban growth. Having sustainable, universal energy access is a pressing challenge for most parts of the globe. Understanding urban energy consumption patterns may help to address the challenges to urban sustainability and energy security. However, urban energy analyses are severely limited by the lack of urban energy data. Such datasets are virtually non-existent for the developing countries. As per current projections, most of the new urban growth is bound to occur in these data-starved regions. Hence, there is an urgent need of research methods for monitoring and quantifying urban energy utilization patterns. Here, we apply a data-driven approach to characterize urban settlements based on their formality, which is then used to assess intra-urban urban energy consumption in Johannesburg, South Africa; Sana’a, Yemen; and Ndola, Zambia. Electricity is the fastest growing energy fuel. By analyzing the relationship between the settlement types and the corresponding nighttime light emission, a proxy of electricity consumption, we assess the differential electricity consumption patterns. Our study presents a simple and scalable solution to fill the present data void to understand intra-city electricity consumption patterns.
1. Introduction
Urban areas currently house 55% of the world’s population (United Nations Citation2018) and consume nearly 75% of global primary energy supply (United Nations Citation2016). At the present rate of urbanization, 68% of the global population is expected to live in urban areas by the year 2050. (United Nations Citation2018). To accommodate this large population, the urban infrastructure and services will also expand greatly and likely cause a massive increase in urban energy demands. Within the global energy mix, electricity is the second largest energy fuel that supplies about 19% of present global energy needs (International energy Agency Citation2017a). However, it is anticipated that around 40% of the overall increase in global energy demands through 2040 will result from increased electricity consumption (International energy Agency Citation2017b). Thus, ensuring sufficient supply of electricity to meet the future demands in environmentally sustainable manner is of prime importance. Electricity access is also considered a vital indicator of economic growth (United Nations Centre for Human Settlements Citation1984). The latest Sustainable Development Goals of the United Nations mandate universal access to clean and modern energy to all by the year 2030 (United Nations – Sustainable Development Goals Citation2018). Given the sheer dominance of urban areas on global energy consumption, meeting these sustainability goals will largely depend on present and future urban energy dynamics. Understanding urban electricity consumption patterns may not only help to clarify the present energy scenarios but may also assist in projecting a large part of future global energy needs (Howard et al. Citation2012; Zhu et al. Citation2013). Such information could help in planning as well as capacity building to meet the demands in a sustainable manner.
Different factors such as demography, climate, and economics govern electricity usage patterns at local levels (McLoughlin et al. Citation2012; Zheng et al. Citation2014), contribute to wide variations in electricity usage among and within geographic regions. Thus, to accurately understand and quantify urban electricity consumption patterns, pertinent data needs to be acquired at appropriate scales. Much of the local level energy usage information in the developed countries is captured by intelligent systems such as smart meters capable of recording customer behavior and consumption patterns (Hancke et al. Citation2013; Anderson et al. Citation2017). The collected information may then be analyzed to predict the present and short-term needs and also to prepare the systems to meet the long-term energy requirements (Rahman et al. Citation2014). However, neither the cities in developing countries nor all the cities in the developed world possess the required infrastructure or the capital to invest in these technologies (Hilbert Citation2013). On the other hand, notwithstanding the heavy urban-centric nature of global energy consumption, the energy accounting systems are predominantly focused on national and regional scales (Grubler et al. Citation2012). Traditional energy demand models are based on the Gross Domestic Product (GDP), population growth rates, and gains from energy efficiency measures. However, GDP values have been found to be inconsistently measured around the world (Feige and Urban Citation2008). Consequently, such models may provide unreliable energy estimates which are unsuitable for comparative analysis. The non-availability of urban scale energy data and incompatibility of energy demand models in urban analysis thus pose serious challenges that hinder the much-needed urban energy studies. As per the present trends of urbanization, it is expected that around 90% of global urban expansion will take place in Asia and Africa (United Nations Citation2018). In terms of the urban area expansion, Asia is expected to undergo the highest amount of urban growth, while Africa is projected to face the highest urbanization rates (Seto et al. Citation2012). As most of these areas lack the necessary systems to monitor energy consumption, alternative methods must be identified to overcome the present obstacles.
To overcome the scarcity of urban-level energy data, the potential of remote sensing derived surrogate measures may be assessed. For example, past researchers have indicated that separation of settlement types could lead to the identification of urban dynamics patterns that were hitherto unseen (Patino and Duque Citation2013; Taubenböck and Kraff Citation2014). High-resolution satellite images offer unique capabilities to distinguish between various settlement types based on their physical appearance in these images, which can be used to develop a formality-based settlement typology. Recent advancements in remote sensing capabilities in terms of input data and sophisticated algorithms have paved the way for the identification of different urban settlement types based on texture analysis (Yuan et al. Citation2015; Graesser et al. Citation2012). As the size, type, age, and location of urban settlements impact their energy consumption profiles (Carréon and Worrell Citation2018), the image-generated settlement typologies could be analyzed further for their correlation with energy consumption. Successful development of such proxy measures of urban energy consumption may significantly reduce the dependence on ground surveys and find useful applications over data-poor regions.
While presenting a texture analysis-based method for identifying different settlement types over diverse landscapes, Graesser et al. (Citation2012) reported distinct spatial characteristics between formal and informal settlements, captured using different texture measures, in Caracas, Venezuela; Kabul, Afghanistan; and La Paz, Bolivia. A texture-based built-up presence matrix, known as PanTex, was applied by Pesaresi et al. (Citation2008) to delineate urban area boundary in panchromatic imagery. Statistical properties of image texture features were utilized by Vijayaraj et al. (Citation2008) to identify urban and non-urban areas. Such prior work highlights the applicability of satellite image processing methods in urban settlement characterization. Therefore, such texture-based approaches could help in the identification of different settlement types that are associated with the various levels of socio-economic activities including energy consumption, e.g. residential and commercial type buildings. The applicability of building types and urban patterns in the identification of socio-economic attributes have been indicated before (Cowen and Jensen Citation1998). Thus, in the absence of ground level energy consumption information, viability of the settlement types to indicate the differential electricity usage at city-levels needs to be tested.
Nighttime lights datasets capture anthropogenic light emission from human settlements at night under cloud-free conditions, which has been widely used as a proxy for energy consumption from local to global scales. Nighttime lights imaging capabilities, provided by Defense Meteorological Satellite Program’s Operational Linescan Sensor (DMSP/OLS), have long been exploited by scientists to monitor and map electricity consumption patterns (Welch Citation1980; Welch and Zupko Citation1980; Amaral et al. Citation2005; Kiran Chand et al. Citation2009; Letu et al. Citation2010; Zhao et al. Citation2006; Xie and Weng Citation2016; Xie and Weng Citation2016; Cao et al. Citation2014; He et al. Citation2014). Townsend and Bruce (Citation2010) observed high correlation between electricity consumption and nighttime lights emission at state (R2 = 0.93) and statistical local area (R2 = 0.87) levels. High correlation (R2 = 0.91) was also observed between electric power consumption and nighttime lights in Brazilian Amazon (Amaral et al. Citation2005). Time-series DMSP/OLS nighttime lights data was used to map electricity consumption at 1 km spatial grid in China between 1994 and 2009 (Cao et al. Citation2014). Recently, Mellander et al. (Citation2015) analyzed the scope of nighttime lights data as a surrogate of economic activities at finer spatial scales, ranging from square blocks of 250 × 250 meters in urban areas and 1000 × 1000 meters in rural areas, using statistical data in Sweden. This study used both saturated and radiance (non-saturated) data from DMSP/OLS and found that the radiance data is better aligned with socio-economic parameters, especially at estimating their densities. While nighttime lights are arguably not a perfect proxy of economic activities at urban scales; it still remains one of the strongest surrogates in the absence of any other viable alternative (Mellander et al. Citation2015). The recent introduction of Visible Infrared Radiometer Suite (VIIRS) Day/Night band (DNB) data has added much-needed improvement to the existing nighttime imaging capabilities in terms of higher spatial and radiometric resolutions (Elvidge et al. Citation2013). The VIIRS DNB datasets are free from the saturation issues of DMSP/OLS, which severely limited the intra-urban applications of the later. The initial research findings from the application of VIIRS DNB datasets have indicated that it is better equipped to detect minute variations in nighttime lighting levels than its predecessor (Ma et al. Citation2014; Shi et al. Citation2014; Jaturapitpornchai et al. Citation2015; Román and Stokes Citation2015). Thus, in the absence of urban energy statistics, the unique capabilities of VIIRS DNB may be exploited to assess whether there is any correlation between nighttime lighting levels and the satellite data derived settlement types.
For this work, we identified three cities in the developing world, i.e. Ndola, Zambia; Sana’a, Yemen; and Johannesburg, South Africa. These cities show considerable variation in population size and socio-economic characteristics which may result in their distinct electricity consumption profiles. We applied a set of texture measures on high-resolution satellite images of these three cities to capture distinct spatial characteristics associated with different building types. This was followed by a factorization-based texture segmentation method (Yuan et al. Citation2015) to classify the settlements into different functional types. Using the human settlement inventory, we then draw a correlation between settlement types and associated nighttime lights emission from VIIRS DNB data. We assume that the nighttime lighting is a viable indicator of their economic characteristics, including electricity consumption. Thereby, correlation with nighttime lights may also indicate an association with electricity consumption in urban settlements. In the following sections, the study areas and datasets have been briefly described. Next, the methods applied in this work have been explained, followed by a description of the results. We then discuss the patterns observed in these three cities and conclude by highlighting the significance of this work for urban dynamics research.
2. Data
2.1. High-resolution optical images
High-resolution satellite imagery from the WorldView 2 and WorldView 3 satellites, with a spatial resolution of 0.3–0.5 meters, was obtained for the three cities. The images represented a wide variety of human settlement types across the three cities. The city of Sana’a was processed using one strip of images collected by WorldView 2 on 12 December 2016, covering a total area of approximately 1320 sq. km. The city of Ndola was processed using another strip of images collected by World View 3 on 24 June 2016, covering an area of approximately 450 sq. km. The amount of geographical area processed for Johannesburg was 11,039 sq. km. and was spread across four image strips collected from WorldView 2 and WorldView 3 satellites. The acquisition period for those four images strips is from August 2017 to December 2017. Across the three city study area, a total of six image strips, broken down into 32 scenes of approximately 44,000 pixel columns by 31,000 pixel rows and 2–4 GB in size each, were obtained as four band (NIR-Red-Green–Blue) data and mosaiced at each city-level to create the input data for the texture analysis.
2.2. VIIRS DNB nighttime lights data
The 2015 VIIRS DNB annual composite data used in this study was downloaded from the website of National Geophysical Data Center of National Oceanic and Atmospheric Administration (NGDC-NOAA) (https://ngdc.noaa.gov/eog/viirs/download_dnb_composites.html). The VIIRS DNB dataset offers significant improvements over its predecessor, DMSP/OLS datasets, both in terms of higher spatial resolution (500 m versus 1 km) and much higher radiometric resolution (14-bit versus 6-bit quantization levels). The increased information content may thus enable minute detection of urban lights at local levels (Elvidge et al. Citation2017). The VIIRS DNB annual composites are average radiance values of urban lights emitted at night, measured in nanoWatts/cm2/sr units. To create an annual composite, all available cloud-free data for a calendar year are used to obtain the average values of the pixels. Prior to compositing, the anomalies from aurora, sunlit and moonlit pixels, clouds, lightning, and stray lights along with the background values have been removed from the data (Elvidge et al. Citation2013). However, lights from gas flares and biomass burning are still present in this data. To counter this, we applied a gas flare mask obtained from NGDC-NOAA and omitted all such pixels associated with gas flares. After this correction, we considered the data to be free from all known sources of errors.
3. Study area
3.1. Johannesburg, South Africa
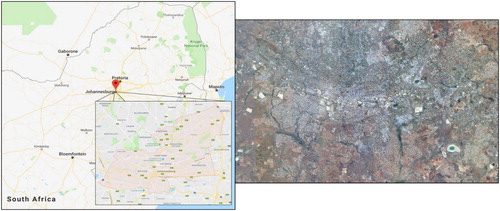
Johannesburg () is the largest city in South Africa and had a population of 9.6 million in 2016. Johannesburg was originally founded in 1886, making it one of the youngest major cities in the world. According to the 2016 World’s Cities Report, the United Nations is projecting Johannesburg to become a megacity between 2016 and 2030, with a projected population of 11.5 million by 2030. (United Nations Citation2016). Johannesburg has seen many periods of rapid expansion, including the period after the discovery of gold in the 1890s. Like many other cities in the global south, Johannesburg continues to experience the effects of rapid urbanization, frequent migration, crowding, and massive unemployment, among other challenges. The city experiences what can be described as a warm temperate climate, according to the Koppen-Geirger Climate Classification, with dry winters and warm summers. Temperatures are considered mild year-round, which is another factor in the constant influx of population (Kottek et al. Citation2006). The climate and location are not the only enticing characteristics of Johannesburg. The City of Johannesburg has typically had an economic growth rate higher than the province of Gauteng and even the national level across all periods between 1997 and 2016 (Karuaihe Citation2013), fostering population growth.
Figure 1. Location map and satellite image of Johannesburg, South Africa. (Source: Google Map. Note: Not drawn to scale, for representative purpose only.)
3.2. Sana’a, Yemen
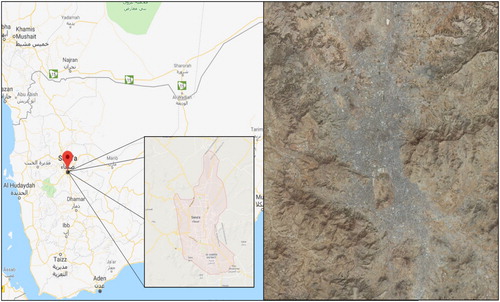
Sana’a () is the largest city, as well as the capital, in the Republic of Yemen with a population of around 3.9 million in 2012. It also carries the distinction of being one of the oldest continuously inhabited cities, as well as one of the highest elevation capital cities in the world. Due to its long heritage and distinctive architectural patterns, part of the city (Old City of Sana’a) is designated as a UNESCO World Heritage Site. The city experiences mild semi-arid climate which can often be characterized as cold steppe or desert climates (Kottek et al. Citation2006). Due to the recent conflict in Yemen, many areas, including Sana’a, are experiencing a declining economy which is pushing poverty levels to 80% nationally. The city is also experiencing a recent influx of population from Internally Displaced People (IDP) seeking refuge from the conflict. Due to increased political tension, Sana’a is facing armed conflict, which currently makes the city a point of constant dynamic population movement (The World Bank Citation2018).
Figure 2. Location and satellite image of Sana’a, Yemen. (Source: Google Map. Note: Not drawn to scale, for representative purpose only.)
3.3. Ndola, Zambia
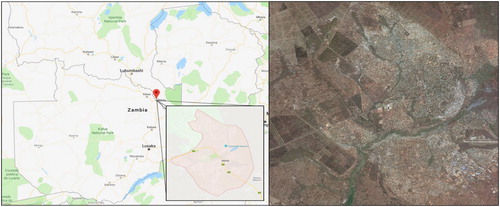
Zambia is a landlocked nation located in southern Africa, surrounded on all sides by Democratic Republic of the Congo, Tanzania, Malawi, Mozambique, Zimbabwe, Botswana, Namibia, and Angola. Ndola is the third largest city and the commercial capital of Zambia. Ndola (). The city experiences a warm climate with dry winters and warm summers (Kottek et al. Citation2006). As per the 2010 census, Ndola was home to 455,194 people. According to the 2010 Census of Population and Housing, Ndola has had a steady growth rate of 1.9 percent between 2000 and 2010 (Central Statistical Office, Lusaka, Zambia Citation2014). It is located in the Copperbelt region, which is well known for copper mining activities. Consequently, Ndola has become the main industrial and commercial hub in the region. The region went through an economic boom during the early 1980s when multiple industries, such as vehicle assembly and clothing manufacturers, had a presence in the area. However, the region went through a lean period between then and 2000. The economy has continued a steady recovery with a 1.8% increase in the labor force between 2000 and 2010, and Ndola has seen an employment rate of 76.9% (Central Statistical Office, Lusaka, Zambia Citation2014).
Figure 3. Location and satellite image of Ndola, Zambia. (Source: Google Map. Note: Not drawn to scale, for representative purpose only.)
4. Method
Two major steps were undertaken to achieve the research objectives. First, the settlement types were characterized for each study area. This characterization was based on preliminary research which consulted census information, demographic and point-of-interest data, as well as reports from government agencies, relevant NGO’s, and local news sources to determine the meaningful differences between class types for each area of interest. This information was then used to develop a class typology common to all three study areas. Next, the analysis of the relationships between the settlement types and corresponding nighttime lights emission was carried out to derive insights on electricity consumption patterns. For characterization of human settlements, we calculated texture responses for training samples in each of the three cities. The training samples were collected after careful visual observation of each city so that such samples comprehensively represent the observed settlement types. Once the texture responses were calculated for these samples, a texture-based segmentation method, proposed by Yuan et al. (Citation2015), was applied for delineation of the various settlement types.
In the following subsections, we briefly discuss the texture measures as well as the segmentation method applied in this study.
4.1. Texture analysis
Image texture could be characterized by the spatial distributions of gray levels in a given neighborhood of an image. Jain et al. (Citation1995) defined texture as the repeating patterns of the local variations in the intensity of Digital Number (DN) values, which are too fine to be distinguished as separate objects. On high-resolution images, texture analysis has been shown to provide supplementary information on the image properties and improve classification accuracy (Aguilar et al. Citation2016). In this work, two widely available texture measures, Gabor filter and Laplacian of Gaussian operator, were used. We briefly discuss these two texture measures in the following sections.
4.1.1. Gabor filter
Originally introduced by Dennis Gabor in 1946, Gabor filter is a linear filter mostly used for edge detection. Researchers have found successful application of Gabor functions to model the simple cells in the visual cortex of mammals, and thus it is thought to be similar to the human visual system in perception. These functions have widely been used in imagery analysis owing to their spatial locality, orientation selectivity, and frequency characteristics (Marmol Citation2011). Gabor filters have been widely applied in urban feature extraction from remote sensing images (Ruiz et al. Citation2004; Zhong and Wang Citation2007, Wang et al. Citation2016, Stan et al. Citation2015). Following the work of Fogel and Sagi (Citation1989), the Gabor function could be defined as (EquationEquation 1(1)
(1) ):
(1)
(1) where σ is Gaussian width, θ is the filter orientation, W denotes the frequency, and ψ denotes the phase shift. X and Y are the center of the applied filter. For an input matrix L(x,y) and a Gabor operator G(x, y |W, θ, ψ, X, Y), a G × L spectra could be obtained for different orientations and shifts of the Gabor operator for identifying the texture element, as given in Equations 2a–2c:
(2a)
(2a)
(2b)
(2b)
(2c)
(2c) where x and y are indices over the basic matrix elements, ψ denotes the phase shift (i.e. 0 and π/2), and W is the number of cycles in n pixels, where n is the size of the input pattern. GL1 and GL2 are Gabor filter convolutions and textures, while S is the locally shift invariant output obtained by using mean of GL1 and GL2.
4.1.2. Laplacian of Gaussian
The Laplacians are the second order spatial derivatives of an image, which helps to identify areas of rapid change such as the edge areas in an image. The input to Laplacian generation is a single gray-scale image, and the process produces another grayscale image as an output. The mathematical formulation of the Laplacian is provided in Equation 3:(3)
(3) Here, L(x,y) is the Laplacian of an image where it’s DN values are given by f(x,y). In a gray-scale input image, this is calculated by applying discrete convolution kernels. However, the derivative filters are known to be sensitive to image noise. Hence, it is required that derivative filters are preceded by a smoothing operation, which is generally done using Gaussian filters. This way, the application of Laplacian filters in an image texture analysis becomes a two-step process and is collectively known as Laplacian of Gaussian or LoG operation. When the Gaussian filter is included for smoothing purposes, a combined Laplacian of Gaussian may be explained by a single equation, under the assumption that the LoG function is centered on zero and the Gaussian standard deviation is σ (Equation 4):
(4)
(4)
LoG texture descriptors have found wide acceptance in urban feature extraction from images (Hinz and Baumgartner Citation2003, Kit et al. Citation2012, Yuan et al. Citation2014, Cooner et al. Citation2016).
4.2. Settlement characterization
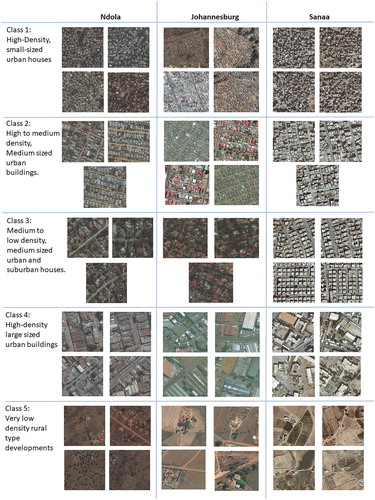
In this work, we used four Gabor filters with a scale value of 2.5, and oriented at 0, 45, 90, and 135 degrees; and two LoG operators with scale values of 1.2 and 1.8. These filters were used to capture the textural characteristics of the settlements such as the size, density, and orthogonality of their layout. Satellite images for each city were first visually inspected for distinct settlement patterns. Once the settlement types were identified, Potential training points were chosen for relative uniformity and lack of interference with neighboring classes. Individual models for each city were developed using a subset of up to four training samples per settlement type (). First, the texture response was calculated on the training samples, which was followed by the application of a factorization-based texture segmentation approach (Yuan et al. Citation2015) to segment the data into these settlement types. We used a settlement area mask to keep non-settled areas out of this process, which helped in data dimension reduction and computational efficiency. The settlement mask was generated from the same datasets used for settlement characterization, to avoid any potential discrepancies from the temporal mismatch. The mask was obtained from the LandScan project team at Oak Ridge National Laboratory, where it underwent extensive quality control to ensure its accuracy. More information on the development of the settlement layer may be found in Cheriyadat et al. (Citation2007) and Patlolla et al. (Citation2012). By this process, the models were iteratively trained using different subsets of imagery until reaching a result wherein all of the previously recorded potential training points were accurately classified according to their original label.
Figure 4. Samples showing different settlement types identified in three cities.
The segmentation method utilizes a specific texture descriptor called local spectral histograms (Yuan et al. Citation2015), which is calculated based on the local distribution of the filter responses (Liu and Wang Citation2002). In this method, the input is represented by an M × N feature matrix comprised of M dimensional feature vectors computed from N number of pixels. The feature at every pixel is regarded as a linear combination of the representative features, encoding the criterion for the selection of boundaries. Two matrices, containing representative features and their pixel-wise combined weights, are multiplied to obtain the feature matrix. The combined weights indicate the belongingness of the corresponding pixels to the segments. The final segmentation is then achieved through factorizing the feature matrix using singular value decomposition and non-negative matrix factorization. For a detailed description on each of these steps, readers may refer to Yuan et al. (Citation2015).
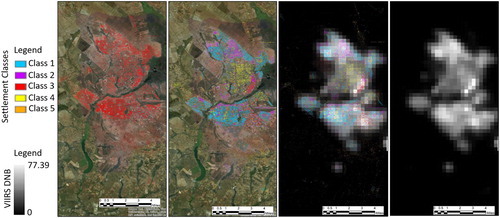
Through visual analysis of high-resolution optical images, we were able to identify multiple settlement classes in each of the cities. These three cities are located in vastly different climatic and physiographic settings, and significant differences exist in the socio-cultural and economic conditions of their inhabitants. All such conditions could have distinct effects in the manifestation of the settlement patterns (Small Citation2011). Distinct patterns were observed in the settlements of these three cities. For the sake of generalizability and interpretation, we demarcated five broad settlement types whose interpretations closely align for all three cities ().
Class 1: High-density, small-sized urban houses. Characterized by non-orthogonal layout.
Class 2: High to medium-density, medium-sized urban buildings. Characterized by orthogonal layout and mixed use commercial and residential. Some suburban developments in the case of Johannesburg.
Class 3: Medium to low-density, medium-sized urban and suburban houses. Characterized by orthogonal layout.
Class 4: High-density, large urban buildings. In the case of Johannesburg, it includes the downtown area and high-rise buildings. In the case of Sana’a, the development is medium to low density, however, marked by large urban buildings.
Class 5: Very low-density, rural type developments, and includes all other types of developments not included in Classes 1–4.
The discrepancy between the characteristics of Class 4 settlements in Sana’a and Johannesburg is likely due to the relatively lower density of commercial development in the former versus the latter.
4.3. Analysis of correspondence between settlement types and nighttime lights emission
As mentioned above, in the absence of any electricity consumption data for these cities, VIIRS nighttime lights data were used as a proxy of electricity consumption patterns. The 500-meter spatial resolution of VIIRS DNB is much coarser than that of the settlement characterization map used here, which is around eight meters. Hence, a pixel to pixel correlation was not possible in this study. To examine the relationship between the settlement types and corresponding nighttime lights emission, the presence of different types of settlements within each VIIRS DNB pixels was calculated. We made regular grids matching the spatial resolution of VIIRS DNB data covering each city and extracted areas of different settlement types within each grid in square kilometers. It was observed that for some parts of the cities, especially in Sana’a and Ndola, VIIRS DNB did not detect any lights. This could be a sign of the lack of electricity access. These settlements were most likely inhabited by the economically weaker population of the society, which needed to be included into the analysis. Thus, all such pixels were included in the study. For Ndola, a large gas flare was observed on the eastern edge of the city. We removed the affected pixels using the gas flare mask mentioned in the data section. Next, three linear regression models were developed to assess the relationship between the settlement types and the corresponding nighttime lights emission. In these equations, the VIIRS DNB values were considered as the dependent variable, and the area of the settlement types was included in the model as the independent variable. The general form of the relationship is given in Equation 5:(5)
(5) where Si is the area of settlement type i in square kilometer, while i is an index for settlement types. DNVIIRSDNB denotes the pixel values in the VIIRS DNB data, and ε denotes the Gaussian noise. In the absence of electricity consumption data, coefficients from the regression model indicate what is the expected change in the nighttime lights emission in nanoWatts/cm2/sr, corresponding to a square kilometer change in the area of individual settlement types. As the data exhibited signs of heteroskedasticity, the coefficients and standard errors were estimated using a heteroskedisticity consistent method, known as the White-Huber standard errors. The initial settlement map, classified settlement map, VIIRS DNB nighttime lights observation, and correspondence between lights data and settlements have been graphically provided in the Figures through .
Figure 5. Clockwise from top-left: Settlement Map, Settlement Classes, Settlement Classes overlaid on VIIRS DNB image, and VIIRS DNB data for Johannesburg, South Africa.
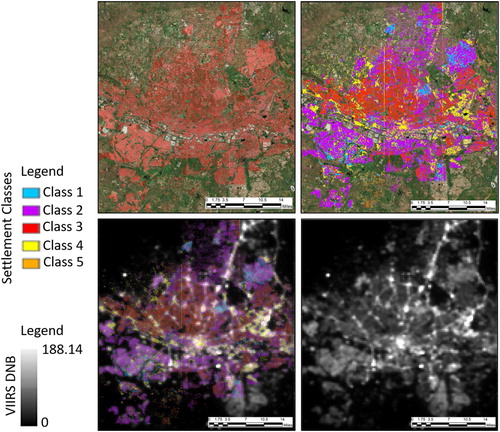
Figure 6. From left: Settlement Map, Settlement Classes, Settlement Classes overlaid on VIIRS DNB image, and VIIRS DNB data for Sana’a, Yemen.
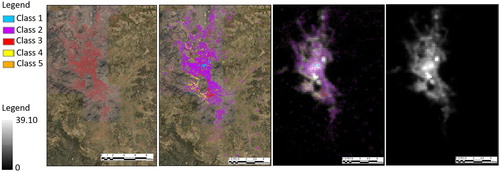
Figure 7. From left: Settlement Map, Settlement Classes, Settlement Classes overlaid on VIIRS DNB image, and VIIRS DNB data for Ndola, Zambia.
5. Results
Results from the regression for Ndola, Sana’a, and Johannesburg indicated a statistically significant correlation between the settlement types and corresponding nighttime lights emission. The regression model for Ndola, Zambia, explained 77% of the variance in the data (R2 = 0.77, F(5, 1634) = 1080, p < .0001), while the model for Sana’a, Yemen, explained 71% of the variance (R2 = 0.71, F(5, 5798) = 2862, p < .0001). Lastly, the model for Johannesburg, South Africa, accounted for 45% of the variance (R2 = 0.45, F(5, 14338) = 2372, p < .0001). The individual coefficients are given below (–).
Table 1. Regression results between VIIRS DNB and settlement types in Ndola, Zambia.
Table 2. Regression results between VIIRS DNB and settlement types in Sana’a, Yemen.
Table 3. Regression results between VIIRS DNB and settlement types in Johannesburg, South Africa.
In Ndola, Zambia, we observed that the nighttime lights emission increased by 1.70 nanoWatts/cm2/sr corresponding to a one square kilometer increase in the area of class 1 type settlements (high-density, small urban houses) (). Similarly, a square kilometer increase in high to medium, mid-sized urban buildings that could be used for both commercial or residential use (Class 2) leads to 2.61 nanoWatts/cm2/sr increase in nighttime lights emission. The increase of per square kilometer area of Class 3 and Class 4 type settlements results in an increase of 3.17 and 2.74 nanoWatts/cm2/sr, respectively. The coefficient for class 5 was found to be extremely small and nonsignificant in this model. We reason that this is most likely caused by extremely sparse development in Class 5 for this city. Most nighttime lights emission in Ndola were found to be associated with Class 3 which represents the medium to low-density, medium-sized urban and suburban houses.
For Sana’a, Yemen, most nighttime lights emission was found to be associated with Class 4, showing an increase of 3.86 nanoWatts/cm2/sr in nighttime lights emission from one square kilometer increase in Class 4 settlement type. This was closely followed by Class 1, showing 3.60 nanoWatts/cm2/sr increase in lights emission corresponding to a one square kilometer increase in the area of Class 1 type settlements. Class 3, 2, and 5 were observed as having comparatively less effect on nighttime lights emission ().
In Johannesburg, South Africa, Class 4 type settlements, which included the downtown areas and the high-rise buildings, were observed to have the most association with the nighttime lights emission. Results show a 5.38 nanoWatts/cm2/sr increase in nighttime lights for each square kilometer increase in Class 4 type settlements, while a square kilometer increase in Class 2 type settlement was found to result in an increase of 2.05 nanoWatts/cm2/sr in nighttime lights emission. Classes 1, 3, and 5 have a lesser and somewhat similar association with the emission of nighttime lights ().
6. Discussion
The lack of urban-level energy statistics severely hinders planning processes related to capacity building as well as provision of access. However, the unabated urban growth and the urban-centric nature of global energy dynamics necessitates the development of methods to overcome such barriers. In the data-poor regions of the world, which are also the hot-spots for future urban growth, the data scarcity is far more severe than the developed world. Under these circumstances where no ground data is available, remote sensing-based proxy measures need to be assessed for their applicability in these data poor regions. We used nighttime lights from VIIRS DNB as a surrogate of urban electricity consumption. The nighttime lights are not perfect, but nevertheless a strong proxy for urban economic activities (Mellander et al. Citation2015). In the absence of any other viable alternative, it remains one of the best available options. Thus, in this work, we assess the correspondence between satellite data derived urban settlement types and urban nighttime light emissions. We applied two widely accepted texture descriptors and a texture-based segmentation method proposed by Yuan et al. (Citation2015) to develop an urban settlement typology for Ndola, Zambia; Sana’a, Yemen; and Johannesburg, South Africa. We then used the settlement inventory to find a possible correlation with nighttime lights emission. Since the spatial resolutions of the urban settlement raster created in this work and VIIRS DNB are widely dissimilar, a pixel-to-pixel analysis was not appropriate. Hence, we calculated the area of different settlement types corresponding to the area of each VIIRS DNB pixel and developed regression models between the area of different settlement types and corresponding nighttime lights emission (expressed in nanoWatts/cm2/sr).
In all three study cities, we discovered a statistically significant correlation between settlement types and nighttime lights emission, which we have considered as a surrogate of electricity consumption. In Johannesburg, the results indicate that class 4 type of buildings, representing high-density and large urban buildings including those in downtown areas have the maximum association with nighttime lights emission. We interpret this as an indication that maximum electricity usage in this city occurs from large buildings that are likely be of commercial and industrial usage and the downtown area which also traditionally houses many businesses. In Ndola, the highest association was observed between Class 3 or the medium to low-density, medium-sized urban and suburban houses. The rural type, sparsely distributed buildings did not exhibit a statistically significant relationship with the lights, we assume this to be a likely effect of their sparse distribution and the fact that many such buildings did not register any lights. Lastly, in Sana’a we see both the large urban buildings (Class 4) and the small sized, non-orthogonally laid out buildings (Class 1) to have the maximum association with nighttime lights. This is a likely result of the conflict that Sana’a has been facing, which would have resulted in displacement of people to makeshift shelters, either inside large buildings or at temporary, informal shelters.
The trends observed from this analysis indicates a statistically significant correlation between the satellite image derived functional settlement types and nighttime lights emission, which is considered a proxy of electricity consumption. The significant correlation as seen in this study shows encouraging potential towards the development of similar metrics to understand energy consumption patterns within cities, specifically when no other data is available. Past analysis using much detailed information about the urban landscapes found a useful correlation between urban texture and energy consumption (Ratti et al. Citation2005). Even though the work was focused on large, advanced cities such as London, United Kingdom; Berlin, Germany; and Toulouse, France, where detailed datasets are available; the study nonetheless prove that urban patterns could be a key to understanding energy consumption. Similar assumptions were followed while characterizing the settlements in this study. To make the method generalizable elsewhere, this study uses freely available nighttime lights data as a proxy of energy consumption patterns. On the other hand, the settlement characterization method can be implemented with limited time and cost for different geographies around the world. Development of similar settlement databases for other cities could draw more insight on the interrelationship between building types and their energy consumption. However, the strength of these relationships is a function of society, economy, and culture, which may not always be accounted for by remote sensing-based methods alone.
As caveats of our study, we will first state that the nighttime lights data was found not to have captured lights from some parts of these cities, especially in Sana’a, Yemen and Ndola, Zambia. This is an artifact of the socio-economic conditions in these places. Also, the overpass time of VIIRS is after midnight local times, which could have affected local lighting patterns in many parts of these cities. Furthermore, the reliability of power grids and the local political and economic controls over electricity consumption could play a significant role in this process that cannot be accounted for by remote sensing data. Secondly, the coefficient of determination for Johannesburg, South Africa was much weaker than the other two cities. We assume that this is an effect of heavily mixed land-use in of Johannesburg, resulting in confounding nighttime lights signals. Also, since this method only relies on remote sensing data, we cannot predict in absolute terms how much electricity is being used at these cities.
Our study presents an applicability of data-driven methods in urban electricity related applications. In the absence of any ground information, a prevalent situation in many countries, this method could indicate the differences in the levels of energy consumption, estimated using nighttime lights as a proxy in this case, corresponding to urban building stock at local levels. Such information, in conjunction with land-use datasets could prove valuable for urban planning. For example, the planners may correlate between existing land use and electricity usage patterns, identify zones that are prime for rolling out efficiency measures or areas that could be developed according to plans meeting future goals. Our method is applicable to different cities due to its non-reliance on ground data. If local electricity information or other socio-economic information is available, those may be included to enrich the model. Further improvement of this method is anticipated in near future.
7. Conclusion
Our study is an attempt towards using remote sensing data and image processing driven methods to understand local scale electricity consumption patterns and understanding socio-economic dynamics within cities. Application of these methods over other cities will validate the assumptions made here and will strengthen the applicability of the method. The patterns identified in this study may be used in conjunction with other available data, such as land-use maps, to inform local-level policy making and, ultimately, help inform urban planning decisions in data scarce regions of the world.
Acknowledgement
The authors would like to thank Dr. Jiangye Yuan, Dr. Nicholas Nagle, Dr. H.M. Abdul Aziz, and Sarah Tennille for their help, suggestions, and critical feedback on this work.
Disclosure statement
No potential conflict of interest was reported by the authors.
ORCID
Pranab K. Roy Chowdhury http://orcid.org/0000-0002-7572-050X
Budhendra L. Bhaduri http://orcid.org/0000-0003-1555-1377
References
- Aguilar, Manuel A., Antonio Fernández, Fernando J. Aguilar, Francesco Bianconi, and Andrés García Lorca. 2016. “Classification of Urban Areas From Geoeye-1 Imagery Through Texture Features Based on Histograms of Equivalent Patterns.” European Journal of Remote Sensing 49 (1): 93–120.
- Amaral, Silvana, Gilberto Câmara, Ant^onio Miguel Vieira Monteiro, José Alberto Quintanilha, and Christopher D. Elvidge. 2005. “Estimating Population and Energy Consumption in Brazilian Amazonia Using Dmsp Night-time Satellite Data.” Computers, Environment and Urban Systems 29 (2): 179–195.
- Anderson, Ben, Sharon Lin, Andy Newing, AbuBakr Bahaj, and Patrick James. 2017. “Electricity Consumption and Household Characteristics: Implications for Census-Taking in a Smart Metered Future.” Computers, Environment and Urban Systems 63: 58–67.
- Cao, Xin, Jianmin Wang, Jin Chen, and Feng Shi. 2014. “Spatialization of Electricity Consumption of China Using Saturation-corrected dmsp-ols Data.” International Journal of Applied Earth Observation and Geoinformation 28: 193–200.
- Carréon, Jesús Rosales, and Ernst Worrell. 2018. “Urban Energy Systems Within the Transition to Sustainable Development. A Research Agenda for Urban Metabolism.” Resources, Conservation and Recycling 132: 258–266.
- Central Statistical Office, Lusaka, Zambia. 2014. Copperbelt Province Analytical Report – 2010 Census. https://www.zamstats.gov.zm/phocadownload/2010_Census/2010_Census_Analytical_Reports/CopperbeltProvinceAnalyticalReport-2010Census.pdf.
- Cheriyadat, Anil, Eddie Bright, David Potere, and Budhendra Bhaduri. 2007. “Mapping of Settlements in High-resolution Satellite Imagery Using High Performance Computing.” GeoJournal 69 (1–2): 119–129.
- Cooner, Austin J., Yang Shao, and James B. Campbell. 2016. “Detection of Urban Damage Using Remote Sensing and Machine Learning Algorithms: Revisiting the 2010 Haiti Earthquake.” Remote Sensing 8 (10): 868.
- Cowen, D. J., and J. R. Jensen. 1998. “Extraction and Modeling of Urban Attributes Using Remote Sensing Technology.” In People and Pixels: Linking Remote Sensing and Social Science, 164–188. Washington, DC: The National Academies Press. National Research Council.
- Elvidge, Christopher D., Kimberly E. Baugh, Mikhail Zhizhin, and Feng-Chi Hsu. 2013. “Why Viirs Data Are Superior to Dmsp for Mapping Nighttime Lights.” Proceedings of the Asia-Pacific Advanced Network 35: 62–69.
- Elvidge, Christopher D., Kimberly Baugh, Mikhail Zhizhin, Feng Chi Hsu, and Tilottama Ghosh. 2017. “Viirs Night-time Lights.” International Journal of Remote Sensing 38 (21): 5860–5879.
- Feige, Edgar L., and Ivica Urban. 2008. “Measuring Underground (Unobserved, Non-observed, Unrecorded) Economies in Transition Countries: Can We Trust gdp?” Journal of Comparative Economics 36 (2): 287–306.
- Fogel, Itzhak, and Dov Sagi. 1989. “Gabor Filters as Texture Discriminator.” Biological Cybernetics 61 (2): 103–113.
- Graesser, Jordan, Anil Cheriyadat, Ranga Raju Vatsavai, Varun Chandola, Jordan Long, and Eddie Bright. 2012. “Image Based Characterization of Formal and Informal Neighborhoods in an Urban Landscape.” IEEE Journal of Selected Topics in Applied Earth Observations and Remote Sensing 5 (4): 1164–1176.
- Grubler, Arnulf, Xuemei Bai, Thomas Buettner, Shobhakar Dhakal, David J. Fisk, Toshiaki Ichinose, James E. Keirstead, G. Sammmer, David Satterthwaite, Niels B. Schulz, et al. 2012. “Chapter 18 – Urban Energy Systems.” In Global Energy Assessment – Toward a Sustainable Future, 1307–1400. Cambridge/Laxenburg: Cambridge University Press/International Institute for Applied Systems Analysis.
- Hancke, Gerhard P., Silva Bruno de Carvalho e, and Gerhard P. Hancke Jr. 2013. “The Role of Advanced Sensing in Smart Cities.” Sensors 13 (1): 393–425.
- He, Chunyang, Qun Ma, Zhifeng Liu, and Qiaofeng Zhang. 2014. “Modeling the Spatiotemporal Dynamics of Electric Power Consumption in Mainland China Using Saturation-corrected Dmsp/ols Nighttime Stable Light Data.” International Journal of Digital Earth 7 (12): 993–1014.
- Hilbert, Martin. 2013. Big Data for Development: From Information-to Knowledge Societies , SSRN Scholarly Paper No. Id 2205145. Rochester, NY: Social Science Research Network.
- Hinz, Stefan, and Albert Baumgartner. 2003. “Automatic Extraction of Urban Road Networks from Multi-View Aerial Imagery.” ISPRS Journal of Photogrammetry and Remote Sensing 58 (1–2): 83–98.
- Howard, B., L. Parshall, J. Thompson, S. Hammer, J. Dickinson, and V. Modi. 2012. “Spatial Distribution of Urban Building Energy Consumption by end use.” Energy and Buildings 45: 141–151.
- International Energy Agency. 2017a. “Key World Energy Statistics.” Accessed August 18, 2018. https://www.iea.org/publications/freepublications/publication/KeyWorld2017.pdf.
- International Energy Agency. 2017b. “World Energy Outlook 2017 – Executive Summary.” Accessed August 18, 2018. https://www.iea.org/Textbase/npsum/weo2017SUM.pdf.
- Jain, Ramesh, Rangachar Kasturi, and Brian G. Schunck. 1995. Machine Vision. Vol. 5. New York: McGraw-Hill.
- Jaturapitpornchai, Raveerat, Teerasit Kasetkasem, Itsuo Kumazawa, Preesan Rakwatin, and Thitiporn Chanwimaluang. 2015. “A Level-based Method for Urban Mapping Using npp-Viirs Nighttime Light Data.” In Information and Communication Technology for Embedded systems (IC-ICTES), 2015 6th International Conference of IEEE, Hua-Hin, Thailand, March 22–24, 2015, 1–6.
- Karuaihe, Selma. 2013. The State of the Economy: City of Johannesburg. Retrieved October 10, 2018, from http://www.hsrc.ac.za/en/review/hsrc-review-january-2015/state-of-economy-city-of-jhb.
- Kiran Chand, T. R., K. V. S. Badarinath, C. D. Elvidge, and B. T. Tuttle. 2009. “Spatial Characterization of Electrical Power Consumption Patterns Over India Using Temporal dmsp-ols Night-time Satellite Data.” International Journal of Remote Sensing 30 (3): 647–661.
- Kit, Oleksandr, Matthias Lüdeke, and Diana Reckien. 2012. “Texture-based Identification of Urban Slums in Hyderabad, India Using Remote Sensing Data.” Applied Geography 32 (2): 660–667.
- Kottek, Markus, Jürgen Grieser, Christoph Beck, Bruno Rudolf, and Franz Rubel. 2006. “World map of the k¨Oppen-Geiger Climate Classification Updated.” Meteorologische Zeitschrift 15 (3): 259–263.
- Letu, Husi, Masanao Hara, Hiroshi Yagi, Kazuhiro Naoki, Gegen Tana, Fumihiko Nishio, and Okada Shuhei. 2010. “Estimating Energy Consumption from Night-time dmps/ols Imagery After Correcting for Saturation Effects.” International Journal of Remote Sensing 31 (16): 4443–4458.
- Liu, Xiuwen, and DeLiang Wang. 2002. “A Spectral Histogram Model for Texton Modeling and Texture Discrimination.” Vision Research 42 (23): 2617–2634.
- Ma, Ting, Chenghu Zhou, Tao Pei, Susan Haynie, and Junfu Fan. 2014. “Responses of Suominpp Viirs-Derived Nighttime Lights to Socioeconomic Activity in China’s Cities.” Remote Sensing Letters 5 (2): 165–174.
- Marmol, Urszula. 2011. “Use of Gabor Filters for Texture Classification of Airborne Images and Lidar Data.” Photogrammetry, Cartography and Remote Sensing 22: 325–336.
- McLoughlin, Fintan, Aidan Duffy, and Michael Conlon. 2012. “Characterising Domestic Electricity Consumption Patterns by Dwelling and Occupant Socio-economic Variables: An Irish Case Study.” Energy and Buildings 48: 240–248.
- Mellander, Charlotta, Jośe Lobo, Kevin Stolarick, and Zara Matheson. 2015. “Night-time Light Data: A Good Proxy Measure for Economic Activity?” PLoS one 10 (10): e0139779.
- Patino, Jorge E., and Juan C. Duque. 2013. “A Review of Regional Science Applications of Satellite Remote Sensing in Urban Settings.” Computers, Environment and Urban Systems 37: 1–17.
- Patlolla, Dilip R., Eddie A. Bright, Jeanette E. Weaver, and Anil M. Cheriyadat. 2012. “Accelerating Satellite Image Based Large-scale Settlement Detection with gpu.” In Proceedings of the 1st ACM SIGSPATIAL International Workshop on Analytics for Big Geospatial data, Redondo Beach, CA, USA, November 07–09, 2012. ACM, 43–51.
- Pesaresi, Martino, Andrea Gerhardinger, and Fraņcois Kayitakire. 2008. “A Robust Built-up Area Presence Index by Anisotropic Rotation-invariant Textural Measure.” IEEE Journal of Selected Topics in Applied Earth Observations and Remote Sensing 1 (3): 180–192.
- Rahman, Ashikur, Xue Liu, and Fanxin Kong. 2014. “A Survey on Geographic Load Balancing Based Data Center Power Management in the Smart Grid Environment.” IEEE Communications Surveys & Tutorials 16 (1): 214–233.
- Ratti, Carlo, Nick Baker, and Koen Steemers. 2005. “Energy Consumption and Urban Texture.” Energy and Buildings 37 (7): 762–776.
- Román, Miguel O., and Eleanor C. Stokes. 2015. “Holidays in Lights: Tracking Cultural Patterns in Demand for Energy Services.” Earth’s Future 3 (6): 182–205.
- Ruiz, L. A., A. Fdez-Sarŕıa, and J. A. Recio. 2004. “Texture Feature Extraction for Classification of Remote Sensing Data Using Wavelet Decomposition: A Comparative Study.” In 20th ISPRS Congress, Istanbul, Turkey, July 12–23, 2004, 35, 1109–1114.
- Seto, Karen C, Burak Güneralp, and Lucy R Hutyra. 2012. “Global Forecasts of Urban Expansion to 2030 and Direct Impacts on Biodiversity and Carbon Pools.” Proceedings of the National Academy of Sciences 109 (40): 16083–16088.
- Shi, Kaifang, Bailang Yu, Yixiu Huang, Yingjie Hu, Bing Yin, Zuoqi Chen, Liujia Chen, and Jianping Wu. 2014. “Evaluating the Ability of npp-Viirs Nighttime Light Data to Estimate the Gross Domestic Product and the Electric Power Consumption of China at Multiple Scales: A Comparison with dmsp-ols Data.” Remote Sensing 6 (2): 1705–1724.
- Small, Christopher. 2011. “The Human Habitat.” In Human Population. Ecological Studies (Analysis andSynthesis). Vol. 214., edited by R. Cincotta and L. Gorenflo, 27–46. Berlin: Springer.
- Stan, Mihaela, Anca Popescu, Mihai Datcu, and Dan Alexandru Stoichescu. 2015. “An Assessment of Feature Extraction Methods for Sentinel-1 Images on Urban Areas.” In Geoscience and Remote Sensing Symposium (IGARSS), 2015 IEEE International, Milan, Italy, July 26–31, 2015. IEEE, 369–372.
- Taubenböck, Hannes, and N. J. Kraff. 2014. “The Physical Face of Slums: a Structural Comparison of Slums in Mumbai, India, Based on Remotely Sensed Data.” Journal of Housing and the Built Environment 29 (1): 15–38.
- Townsend, Alexander C., and David A. Bruce. 2010. “The use of Night-time Lights Satellite Imagery as a Measure of Australia’s Regional Electricity Consumption and Population Distribution.” International Journal of Remote Sensing 31 (16): 4459–4480.
- United Nations. 2016. “The World’s Cities in 2016.” http://www.un.org/en/development/desa/population/publications/pdf/urbanization/the_worlds_cities_in_2016_data_booklet.pdf.
- United Nations. 2018. “World Urbanization Prospects: The 2018 Revision.” Department of Economic and Social Affairs. Population Division, United Nations.
- United Nations Centre for Human Settlements. 1984. “Energy Requirements and Utilization in Rural and Urban Lowincome Settlements.” http://mirror.unhabitat.org/pmss/getElectronicVersion.aspx?nr=1655&alt=1.
- United Nations – Sustainable Development Goals. 2018. “Affordable and Clean Energy.” Accessed August 18, 2018. https://www.un.org/sustainabledevelopment/energy/.
- Vijayaraj, Veeraraghavan, Anil M. Cheriyadat, Phil Sallee, Brian Colder, Ranga Raju Vatsavai, Eddie A. Bright, and Budhendra L. Bhaduri. 2008. “Overhead Image Statistics.” In Applied imagery pattern Recognition Workshop, 2008. AIPR’08. 37th IEEE, Washington, DC, USA, October 15-17, 2008. IEEE, 1–8.
- Wang, Anqi, Peng Liu, and Chao Xie. 2016. “Urban Land use Classification From High-Resolution sar Images Based on Multi-Scale Markov Random Field.” In Geoinformatics, 2016 24th International Conference on. IEEE, Galway, Ireland, August 14–20, 2016, 1–4.
- Welch, R. 1980. “Monitoring Urban Population and Energy Utilization Patterns from Satellite Data.” Remote Sensing of Environment 9 (1): 1–9.
- Welch, R., and S. Zupko. 1980. “Urbanized Area Energy-utilization Patterns from Dmsp Data.” Photogrammetric Engineering and Remote Sensing 46 (2): 201–207.
- The World Bank. 2018. “The World Bank in Yemen.” http://www.worldbank.org/en/country/yemen/overview.
- Xie, Yanhua, and Qihao Weng. 2016. “Detecting Urban-scale Dynamics of Electricity Consumption at Chinese Cities Using Time-Series Dmsp-ols (Defense Meteorological Satellite Programoperational Linescan System) Nighttime Light Imageries.” Energy 100: 177–189.
- Yuan, Jiangye, Deliang Wang, and Anil M. Cheriyadat. 2015. “Factorization-based Texture Segmentation.” IEEE Transactions on Image Processing 24 (11): 3488–3497.
- Yuan, Jiangye, DeLiang Wang, and Rongxing Li. 2014. “Remote Sensing Image Segmentation by Combining Spectral and Texture Features.” IEEE Transactions on Geoscience and Remote Sensing 52 (1): 16–24.
- Zhao, Shuqing, Liangjun Da, Zhiyao Tang, Hejun Fang, Kun Song, and Jingyun Fang. 2006. “Ecological Consequences of Rapid Urban Expansion: Shanghai, China.” Frontiers in Ecology and the Environment 4 (7): 341–346.
- Zheng, Menglian, Christoph J Meinrenken, and Klaus S. Lackner. 2014. “Agent-based Model for Electricity Consumption and Storage to Evaluate Economic Viability of Tariff Arbitrage for Residential Sector Demand Response.” Applied Energy 126: 297–306.
- Zhong, Ping, and Runsheng Wang. 2007. “A Multiple Conditional Random Fields Ensemble Model for Urban Area Detection in Remote Sensing Optical Images.” IEEE Transactions on Geoscience and Remote Sensing 45 (12): 3978–3988.
- Zhu, Dan, Shu Tao, Rong Wang, Huizhong Shen, Ye Huang, Guofeng Shen, Bin Wang, Wei Li, Yanyan Zhang, Han Chen, et al. 2013. “Temporal and Spatial Trends of Residential Energy Consumption and air Pollutant Emissions in China.” Applied Energy 106: 17–24.