
ABSTRACT
In recent years, researchers of different communities have increased their efforts in formalizing a set of measurements regularly collected for analysing changes in Drivers, States, Impacts and Responses of a given discipline. In some cases, different actors have converged in a minimum set of Essential Variables (EVs), such as for Climate, Biodiversity or Oceans. The definition of such EVs is an ongoing evolution and in extension (e.g. EVs for water) although some communities have not even started (e.g. agriculture and energy). This paper characterizes the Earth Observation (EO) networks and creates a graph representation of their relations. Secondly, this graph is enriched with the EVs produced by each network creating a knowledge base. Finally, an effort has been done to identify links between EVs and Sustainable Development Goals (SDG) indicators in a way that they indirectly connect the EO. An analysis to detect gaps in EO variables due to a lack of observational networks is performed. Several suggestions for improving SDG indicators framework by considering EVs are exposed, as well as proposing new necessary EVs and suggesting new EO based indicators. The complete graph is available in the ENEON website (http://www.eneon.net/graph-ev-sdg/).
Highlights
There is a need for a common and comprehensive list of Essential Variables. Research infrastructures need to be characterized in terms of the EV they are able to produce. Policy monitoring can benefit from Earth observation.
1. Introduction
Back in the late 90s, the United States former Vice-President Al Gore promoted the vision of ‘Digital Earth’ as a multi-resolution, three-dimensional representation of the planet that would make possible to find, visualize and optimize a vast amount of geo-referenced information on geo-physical and social environments and make them available for analysis. Such a system would allow users to navigate through space and time, accessing historical data as well as future predictions (based for example on environmental models), and its use would be supported by scientists, policy-makers and children alike (Gore Citation1998). Some years later, Google maps have released this concentrating the efforts in presenting a photographic view and a street/road view that could be enough for many applications. However, up to now, this service does not allow studying the interesting processes and dynamics that the Earth presents, such as climate change, carbon fluxes, water dynamics and biodiversity treats. In fact, to achieve the Gore vision requires incorporating information of other variables that can represent the status and the evolution of the planet in all its aspects. For example, to characterize Earth climate dynamics it is necessary to represent variables including temperature, precipitation, and wind (that are part of the Essential Climate Variables, Bojinski et al. Citation2014), but if the aim is to describe the vegetation biodiversity, other parameters are needed, such as Leaf Area Index (LAI) and forest biomass (to cite some variables part of the Essential Biodiversity Variables, Pereira et al. Citation2013). Additionally, most of the useful variables are difficult to perceive, such as the climate ones, invisible to human eye, or the biodiversity ones that might be visible but difficult to be estimated with direct indicators. On one hand, in-situ sensors can be deployed on the ground to measure these variables although being this an expensive technology, difficult to maintain and only available to represent a tiny fragment of the Earth at a regular frequency (Goetz and Dubayah Citation2011). On the other hand, Earth Observation (EO) satellite imagery from radar and optical sensors is an alternative to obtain Earth regular related measurements (Geller et al. Citation2017). In this case, the spatial coverage increases significantly but the frequency of the observations is restricted to the revisiting period of the selected orbit, sometimes forcing the spatial agencies to launch costly constellations of satellites that observe the same area more frequently. Besides, raw data products collected from remote sensing satellites are not useful to directly measure the same type of variables that can be measured with in-situ instruments. EO does not deliver any statistical indicators by default but it provides some spatial, spectral, and temporal information that can then be related to indicators (GEO Citation2017). Space agencies ground segments make considerable efforts to process and transform raw data into variables or high-level products that are useful to describe the Earth. The evidence of this can be clearly seen in the investment in ESA thematic Copernicus services (https://www.copernicus.eu/en/services). National Statistical Offices are also key elements on identifying the best algorithmic approach and statistical applications that are most suited to the use of EO data, based on clear organizational benefits, feasibility of methods and likely cost savings (GEO Citation2017). A framework that defines a minimum set of essential variables helps to guide the process of creating remote sensing high-level products. Determining the set of essential variables also helps in harmonizing in-situ sensor and remote sensing data.
1.1. Essential variables
Measuring the status and evolution of the Earth is costly. The cost of maintaining a dense network of in-situ sensors is high and increases with the number of variables to be measured. Alternatively, extracting variables from remote sensing data might be a challenge for the limited capacity of the ground segment that might not be able to support the timely creation of too many variables. On the other hand, in the last 50 years, the maturity of the technical capacities of the sensors combined with the communication networks and computer infrastructures has made available vast amounts of data. These and other factors have forced to re-open the question of what is the minimum set of variables that can be enough to fully characterize the state and future evolution of the Earth. Determining the set of essential variables becomes a question of reducing costs and being more efficient.
Some communities have already initiated the process to define the minimum set of variables that should be measured. The first community to start this process was the weather and climate one. In the 1990s, gaps in knowledge of climate and declining core observational networks in some countries led to emphasize on a limited set of critical variables that should be observed. The discussions ended up with the Global Climate Observing System (GCOS) programme developing the concept of ‘Essential Climate Variables’ (ECVs), broadly adopted in science and policy (Bojinski et al. Citation2014). ECV provide empirical evidence on status and evolution of climate, and should help guiding mitigation and adaptation measures. Similarly, other EVs have been defined. For instance, the Global Ocean Observing System (GOOS) took the initiative to define a set of Essential Ocean Variables (EOVs) to avoid duplication of efforts across observing platforms and networks, and to adopt common standards for data collection and dissemination to maximize the utility of data (Fischer and Grimes Citation2012). Also, the Intergovernmental Science-Policy Platform on Biodiversity and Ecosystem Services (IPBES), partners from the Group on Earth Observations Biodiversity Observation Network (GEO BON), sought consensus for setting up the Essential Biodiversity Variables (EBVs) as the basis of monitoring biodiversity worldwide. EBVs, still under discussion, will provide a consistent national or regional biodiversity monitoring and sharing framework along with the expected funding (Pereira et al. Citation2013).
It is noteworthy that the different sets of different EV are not completely isolated but there are some common variables and intersections between domains (see ). Lawford (Citation2014, Appendix D) has proposed a list of Essential Water Cycle Variables (EWVs) that has many intersections with the ECV. Indeed, variables related with Earth cycles can be proposed for Water studies but also for other approximations such as the carbon cycle and the energy cycle (Su et al. Citation2018) (e.g. including the Food Water and Energy nexus (Bombelli et al. Citation2015)). In addition, other communities, such as related to Agriculture, have a clear set of variables, mainly related to production, which could be considered EV (Atzberger Citation2013). In general, EVs definition is at a different level of maturity depending on the GEO Societal Benefit Areas (SBA). The definition of EVs can benefit from the creation of a transversal initiative in GEO that studies the process followed by the most mature EV sets and formulates recommendations on how to adapt it to the needs of the SBAs that are not so advanced (e.g. Energy and mineral resource development) or have not even started (e.g. Disaster Resilience). The final aim is to have a superset of EV that can monitor all aspects of the Earth environment.
Figure 1. Intersections between different sets of EVs. (Modified diagram initially from: GEOWOW-WP6-IOU-16.1.1).
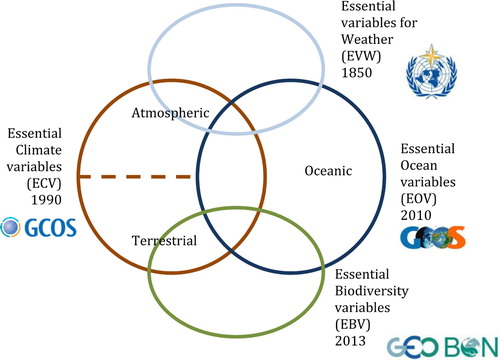
During the last 20 years, the reason for the existence of different EVs has evolved and has become more connected to the decision making process. Initially, EVs for Weather were defined as the necessary data to make the first weather forecasts in the 1850s. More than a century and a half later, in 1990, the ECVs were defined as ‘physical, chemical, or biological variables or a group of linked variables that critically contribute to the characterization of Earth's climate’ (Bojinski et al. Citation2014). However, no reference to any target group is mentioned, although it can be assumed that scientists will be the ones to characterize the climate. Instead, the EOV differentiate two target groups, adding a reference to societal aspect: ‘EOV are variables that have a high feasibility of sustained observation and high impact in responding to state scientific and societal issues’ (Hayes et al. Citation2015). Concerning the EBV, the GEO BON strategy for its definition (Pereira et al. Citation2013) goes one step further and takes a closer position versus the decision maker by saying that an EBV ‘lie between primary observations and indicators’ (Niemeijer Citation2002). In fact, this is the first time that an explicit reference to ‘indicators’ to respond to multiple dynamic global monitoring and policy needs it’s done (Reyers et al. Citation2017). It is worth to notice that biodiversity and ecosystems disciplines have made previous efforts in connecting to the decision makers. To move closer to the decisions that have economical implications, the Ecosystem Services can be interpreted as an effort to quantify the EBVs by only considering variables that are able to quantify the value that the ecosystems provide to the humankind. Sometimes the services can be quantified from an economic perspective (like timber availability), some others are more spiritual (like cultural and therapeutic aspects of being in contact with nature) (Daily et al. Citation2009).
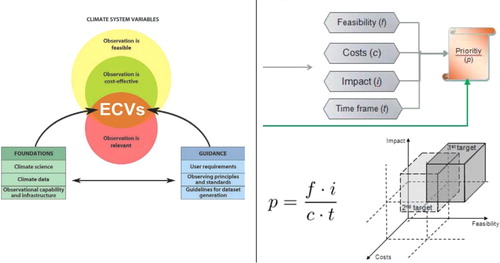
Mainly, EVs are identified by consensus in discussions made from Expert Panels formed by the networks of the observation discipline (e.g. climate and ocean). Since the objective is to maximize funding to be able to maintain stable networks of EO that are able to provide long time series, EV are selected following three criteria: Relevance (the variable is effective in addressing the topic), Feasibility (observing or deriving the variable on a global scale is technically feasible using proven, scientifically understood methods) and Cost-effectiveness: (generating and archiving data on the variable is affordable, mainly relying on coordinated observing systems using proven technology, taking advantage – where possible – of historical datasets) (see ).
Figure 2. Essential variables are defined in a way that relevance (or impact), feasibility and cost-efficiency are maximized. (a) Specific ECVs example from Bojinski et al. Citation2014. (b) General example from Bombelli et al. Citation2016.
1.2. Policy indicators and the SDGs
The global decision making is a complex process. Sometimes policy makers agree on common goals (e.g. biodiversity conservation). Later, each goal is crystallized in a series of targets (e.g. to achieve a significant reduction of the current rate of biodiversity lost by 2010). Targets need to be realistic but not necessarily specific, so they are not directly formulated in a way that can quantify or assess. The mechanism defined to measure, monitor and report the progress of a given target is based on the implementation of Indicators. Mace and Baillie (Citation2007) proposes the following criteria to define indicators: make the indicator relevant to the purpose; distinguish between measures of pressure, state, and response; design and validate the measures in context; ensure the indicators communicate effectively to relevant audiences; decide between composite indicators and lists of measures; and maximize the cost-effectiveness of the indicators. Indeed, a solid framework of indicators requires multiple types of good and reliable data and clear methodological guidelines related to their metadata. In fact, this is a process that evolves over time, with the emergence of new technology or new data to calculate current indicators or to include new indicators when needed. This is the case of geospatial data and EO that can provide alternative manners to collect, analyse and compute indicators. However, how to extract the necessary indicators from the existing EO data and its relation to the EVs is still a challenging issue, mainly due to the vast amount of data available in several repositories and formats. In this paper, the abstract level of the Essential Variables concept facilitates its connection to the Indicators. This has been already done for monitoring biodiversity goals defined in the Convention on Biological Diversity (Secades et al. Citation2014), the Ramsar convention on Wetlands, the Convention on the Conservation of Migratory Species of Wild Animals, the Marine Strategy Framework Directive and the European Water Framework Directive (Geijzendorffer et al. Citation2016).
Certainly, the definition of indicators for monitoring and reporting progress of policy targets depends on many factors such as scientific criteria (e.g ecological significance), historical (i.e. builds on existing historical records and statistical data availability), stakeholder interests (e.g. easy to be understood by target audience), intrinsic (e.g. easy to be measured repetitively), logistics (e.g. practical ad hoc solutions for immediate needs) (Feest Citation2013; Hayes et al. Citation2015). This set of criteria to select indicators seems much more complex than the one used in the definition of EVs more based on a good balance between feasibility, cost and impact. That could be one of the reasons why mapping EVs to indicators might present some difficulties.
In 2012, the United Nations Rio + 20 summit in Brazil committed governments to create a set of Sustainable Development Goals (SDGs) moving from a deep transition from the Millennium Development Goals (MDGs) of the last 15 years (2000-2015) to a 2030 agenda on sustainable development.. The Agenda describes 17 Goals and 169 Targets, which are integrated and indivisible, and carefully balanced in three dimensions of sustainable development: the economic growth, the social inclusion and the environmental sustainability (Disley Citation2013). Their means of implementation are based on the integration of sustainable development into national policies and processes mobilizing all available resources and bringing together Governments and National Authorities, civil society, the private sector, the UN system as well as other actors. The progress made in implementing the goals and targets is being followed-up and reviewed at national, regional and global levels according to their capabilities, circumstances and specificities. In turn, the 169 Targets are supported by an initial set of 244 indicators (UN Citation2016) that requires the use of multiple types of data, from traditional national administrative data to new sources of data outside statistical systems, such as EO and geospatial information (Anderson et al. Citation2017). EO and geospatial information can significantly reduce the costs of monitoring the aspirations reflected in the Goals and Targets, and make SDG monitoring and reporting viable within the limited resources available to governments. Beyond the SDG framework, these same data can provide developing countries and regions with an increased capacity to acquire, analyse and utilize information for a broad range of policy-making purposes (GEO Citation2017). According to the level of data availability and methodological development, the SDG Indicators have been grouped into three different Tiers: from Tier I, for the ones having an established methodology and widely available data, to Tier II and Tier III, for those having no data available or no methodology established, respectively (UN Citation2018).
Figure 3. Classification of indicators in the DPSIR framework (modified version from in Mace and Baillie Citation2007).
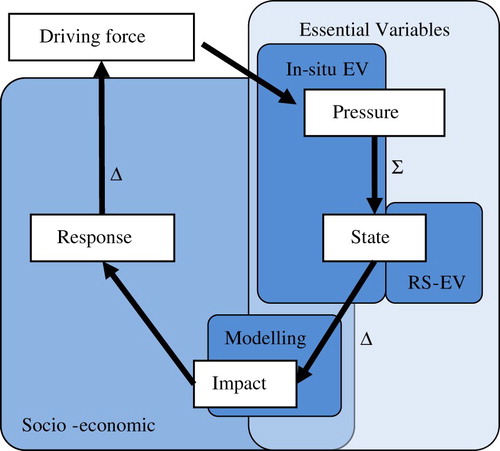
With such a large number of indicators, it is a challenge to assure the completeness of the set. One of the ways to explore the representativeness and comprehensiveness of a set of indicators is the use of the Driver-Pressure-State-Impact-Response (DPSIR) analysis. The DPSIR framework was first elaborated in the European Environment Agency (EEA) programme that sponsored the Dobris Assessment of Europe's environment (Air, Water, and Soil) and is used for environmental issues in Europe (EEA Citation1995). This framework describes the interactions between society (anthropogenic activities), environment (natural science) and socio-economic consequences (social science) and proposes a classification of indications by determining if they measure pressure, state, impact or response (). It considers the human integral part of the ecosystem generating pressures, sensing the impact and applying responses (Zaldívar et al. Citation2008). A measure of pressure can be trends in invasive species; a measure of state can be trends in abundance and distribution of selected species; a measure of impact can be health and well-being of communities; and a measure of response can be the coverage of protected areas (Kristensen Citation2004).
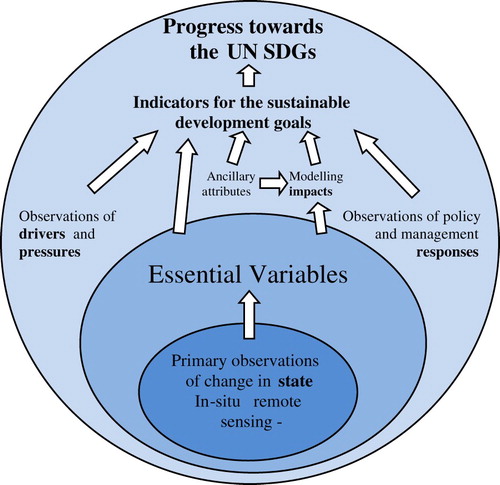
The challenge of using a DPSIR approach is to identify which components of the framework can be monitored using EO data. Considering that the main driving forces are human induced (e.g. tourism, industry economic growth), such forces cannot be directly observed and measured using sensors but they can be derived from socioeconomic parameters. Instead, some of the actual pressures on the environment (e.g. land-use change, pollution) can be measured by EO (mainly in-situ sensors) as well as the state of the system (e.g. habitat, vegetation) (through in-situ sensors or remote sensing). Following the components, the impact, being a translation between the changes in some observed variables and consequences to the humankind (e.g. environmental damage, public health), can be modelled or measured using socioeconomic metrics. Finally, the response component is materialized as human decisions (e.g. laws, taxes) that act modifying the driving force and these needs to be quantified through socioeconomic indices. Therefore, depending on the type of indicator, a socioeconomic variable or a natural-environmental variable will be needed. In summary, Essential Variables (and EO) can be used to calculate indicators of pressure and state, could be useful to derive impact and could rarely participate in the assessment of response indicators ().
Figure 4. Essential variables in the context of the information needed to obtain measurable indicator values (modified version from Pereira et al. Citation2013 Fig. S1).
This paper proposes to generalize the approach enunciated in Geijzendorffer et al. (Citation2016) for the EBV to all other EVs and to incorporate the link with the SDG indicators. Indeed, the Essential Variable framework and the DPSIR framework could potentially be used as a tool to identify existing biases in policy reporting for the SDG and the set of indicators to be used, through which the comprehensiveness of the reporting can be enhanced.
This paper addresses the following questions: What are the relationships between SDGs and EVs?, how can the relationships between EVs, SDG indicators and EO be represented? and what is the link between the DPSIR framework the SDG indicators and EVs?. These questions are addressed in general and demonstrated in particular using the example of SDG15 Life on Land.
2. Methods
2.1. The graph representation
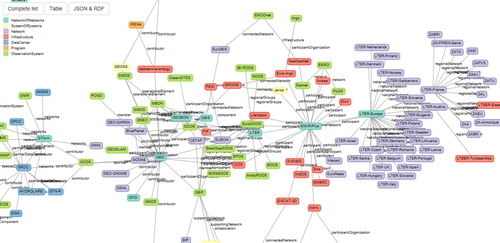
Networks for EO are organized thematically but collaborate between each other through cross-thematic networks such as ENVRIplus, the Copernicus in-situ Component or the Global Earth Observation System of Systems (GEOSS). Some networks are able to guarantee their continuity (e.g. by being recognized as a European Research Infrastructure Consortium – ERIC) and some others depend on projects and change the name and composition along time or unfortunately vanish when funding mechanisms end. The European Union Horizon 2020 ConnectinGEO project created the European Network of Earth Observation Networks (ENEON) that is proposed as a part of the foreseen GEOSS knowledge base (Santoro, Nativi, and Mazzetti Citation2016). ENEON has become an observatory of the status of the EO networks. The most visible product is an object-based database of data collected for each observatory that is represented as a living graph that depicted each EO network and their interdependencies in Europe. The intrinsic complexity of the network structure interdependencies is emphasized by the graph representation.
The graph is also distributed in turtle, one of the formats used in the Resource Description Framework (RDF) that can be integrated into the Linked Open Data (LOD). LOD is used as a mechanism of linking publicly available data ‘silos’ on the Internet by means of semantic methods and networks. By linking data, all of the objects (e.g. networks) become related to each other. By determining a number of rules about these relationships such inter-linked data can be ‘understood’ by machines and algorithms, which enables global data mining approaches and the discovery of truly new associations, patterns and knowledge (Lausch, Schmidt, and Tischendorf Citation2015). LOD relies on a RDF data model that is a list of triples composed by an object identifier, a relation and another object identifier. Identifiers are conceived to be global and should be unique in the Internet. Initially, the ENEON graph only presented networks (e.g. Ocean Biogeographic Information System (OBIS) or Global Forest Observations Initiative (GFOI)) of different types that were related in terms of collaboration or dependency between them (see ).
Figure 5. Original graph diagram of networks done by the ENEON Observatory.
This work extents the graph to include SDG indicators. A Unified Modeling Language (UML) class diagram (see ) shows the different concepts and relations used in the graph as well as the properties of each one. The UML has been transformed into a JSON schema file. A JSON file (conformal and validated with the JSON schema) describes each object and relates it to other objects. The graphical library d3.js (https://d3js.org/) is used to draw the graph in a web page. Each element of the graph is active: by hovering on the element, the element and the first level related elements are illuminated while the rest are shadowed. This characteristic permits fast visual navigation over the graph. By clicking one of the objects, a panel presenting more details about the object is displayed. User can also choose to display the data as a list of objects or in a tabular form. Finally, a JSON-LD library converts the JSON file into an RDF document for the LOD.
Figure 6. UML model for the graph.
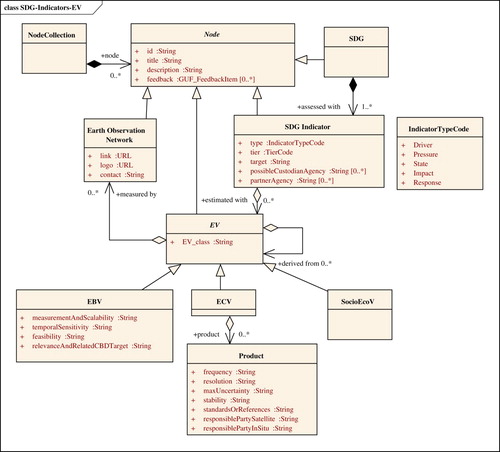
Since the focus of this study is on SDG indicators, SDG targets have not been represented as objects but as attributes of indicators (as shown in ). In the future, the SDG targets can be represented as objects and all the relations among targets that are described by the International Council for Science (ICSU Citation2017) and later extended by the Institute for Global Environmental Strategies (IGES Citation2017) could be included. Actually, IGES has already elaborated a visualization tool for the SDG target relations in the form of a graph (https://sdginterlinkages.iges.jp/visualisationtool.html). Once incorporated in the present graph it will also indirectly show relations among the EVs.
As shown in the UML model (see ), each node of the network can be complemented by a list of feedback items. A feedback item, following the OGC Geospatial User Feedback Conceptual Model Standard (Masó and Bastin Citation2016), includes information about a resource directly provided by users as they use the data, such as ratings, comments (including motivation, question, answer, response, justification, resolution or moderation), usage reports, discovered issues or related publications. The aim of getting feedback items related to each node is twofold: on one side, as networks are highly dynamic in some cases, feedback items can be used (in the graph node representing an EO network) by the responsible parties to raise the need for updates in order to foster graph maintenance; on the other side, for nodes representing SDGs, SGD indicators or EVs, user feedback items can be used to introduce information about those elements, such as publications about a EV or new methods for using a EV to measure a certain SGD indicator or comments/publications on a certain relation between an EV and a SDG.
3. Results
3.1. Linking EVs with SDGs
The study presented here is framed within the ERA-PLANET H2020, strand 2, GEOEssential project (http://www.geoessential.eu/), being thematically focused on biodiversity and the Energy-Water-Food Nexus. The distinction between the different network types has been removed (as this is not relevant here), the graph has been extended to include the most stable set of current EVs related to the topics (ECVs and EBVs) and the EVs have been related with the networks that are responsible for storing, offering or producing data products that can help to retrieve each EV. This way, when looking for an EV the user can immediately know which network of EO can provide relevant data.
3.2. Relationships between EVs, SDGs and EO
In a second step, we have included the SDGs that are directly related with the environment (SDG 2, 6, 7, 13, and 15) and their corresponding SDG indicators. In this paper, SDG targets have not been considered, since SDG indicators are the elements that can be related to the EVs (according to the studies done by the UN on for the indicators classified as Tier I and Tier II, which are the ones with a defined methodology, and from our own expertise). On the contrary, we have expressed some relations between EVs since some of them can be estimated from some others (see ). This information could be represented in a multidimensional matrix of relations but becomes much easier to interpret it as a graph, where the user can navigate from SDGs to networks for EO to get the data to assess the progress towards the goal.
3.3. Links between DPSIR and EVs
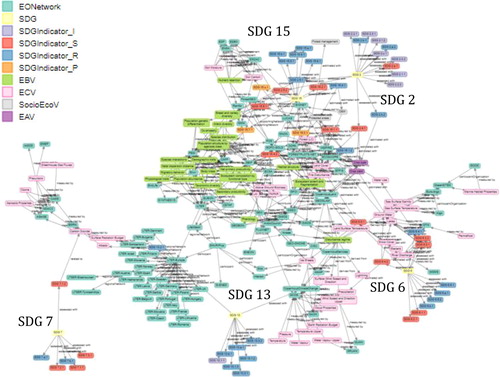
The resulting graph is available at http://www.eneon.net/graph-ev-sdg. Different colours represent the different object types. As discussed previously, the SDG indicators are differentiated, following the DPSIR model, into pressure, status, impact and response indicators ().
Figure 7. The graph that links SDGs, indicators (classified following the DPSIR framework), EVs and EO networks.
3.3.1. Quality approach
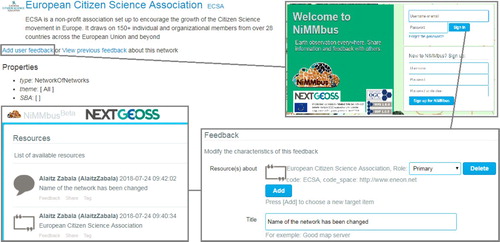
To record the feedback of the users on current gaps and future evolution of the objects and relations, the graph is liked to the NiMMbus system (https://opengis.uab.cat/nimmbus), where user feedback is stored and from which it can be retrieved. Each node in the graph has an identifier and several feedback items can be created and linked to it. The graph triggers the creation of a citation and feedback item in NiMMbus by associating the right operation from the NiMMbus API to the ‘Add Feedback’ button. When the button is pressed, a window to log in NiMMbus appears, then the citation is automatically created (using the information carried on the request to NiMMbus), and then the user is redirected to the user feedback item page where the feedback for the node can be provided. Feedback from other users is seen as part of the description of the resource that appears in the information panel (see ).
Figure 8. Connection of the graph to the NiMMbus user feedback system.
3.4. Classification of SDG in DPSIR framework
As mentioned previously, natural-environmental variables are mainly used to monitor indicators of pressure and state, in some cases contribute to indicators of impact and rarely participate in the assessment of indicators of response. Therefore, it is important to identify which indicators can be considered indicators of pressure, state and impact. In this study, the DPSIR framework has been applied to the SDG indicators to classify them into the 4 components with the results shown in . This classification exercise identifies 146 indicators out of 244 (61%) that for in DPSIR classes that might potentially be assessed by EO. However, the actual number of indicators where EO can be directly used is clearly inferior due to the socioeconomic nature of some SDGs (such as SDG 4: Ensure inclusive and equitable quality education and promote lifelong learning opportunities for all). The Group of Earth Observation published a document (GEO Citation2017) discussing about 29 indicators that can be directly determined by the use of EO. If one analyses that subgroup from a DPSIR perspective, the results show that 3 indicators are related to pressures, 20 are related to states,1 is related to impacts and 6 are related to responses.
Table 1. SDG indicators classification following the DPSIR framework done in this study.
The graph can be used to discover the EO networks that can provide data to assess progress towards a SDG. Taking the SDG 15 as an example, the UN has proposed 14 indicators for the SDG 15 (Protect, restore and promote sustainable use of terrestrial ecosystems, sustainable manage forests, combat desertification, and halt and reverse land degradation and halt biodiversity loss), that can be seen in the graph by hovering or clicking on the SDG15 box (see ). Following the DPSIR framework, the indicators are shown in different colours depending on whether they are considered pressures (3 indicators for the SDG15), status (4), impact (0) or responses (7). A user can see that most of the indicators are considered responses, human actions oriented to correct the impacts of the drivers in terms of management strategies. From this visualization, one learns that 7 of these indicators cannot be measured by EO. More specifically, the exploration of the graph informs users that SDG 15.4.2 is related to some classes represented in a land cover map.
Figure 9. SDG15 indicators classified as pressures (in red), status (in orange) and responses (in blue).
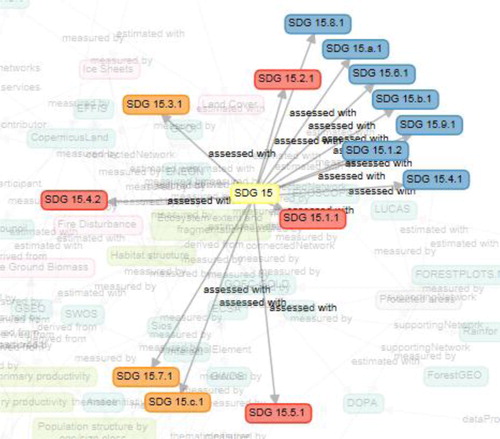
Figure 10. SDG 15.1.1 and its relation to forest area and land cover.
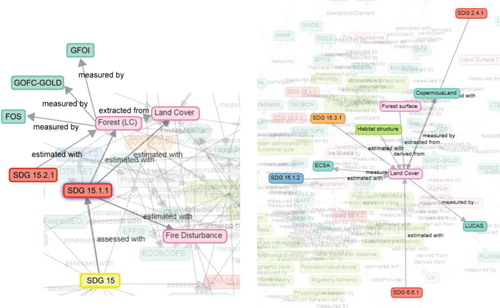
Indicator 15.1.1 is defined as the Forest area as a proportion of total land area. In the graph, the user can see that forest area is measured directly by the Global Observation for Forest Cover and Land Dynamics (GOFC-GOLD) and the Global Forest Observation Initiative (GFOI), but it can be also extracted from a land cover class (). Land cover is generated and distributed by Copernicus Land and even by Citizen Science (represented by the European Citizen Science Association ECSA) (Fritz et al. Citation2012). The graph also informs users that Land cover is used in other SDG indicator, such as SDG 15.3.1 Proportion of land that is degraded over the total land area as mentioned by Anderson et al. (Citation2017). Finally, the graph clearly informs that the capacity to monitor indicators of SDG 15 with EO is, in fact, limited to 8 indicators out of 14 (a 57%).
From these readings, the user can see that EBV could be good variables to monitor the progress of SDG 15 achievements. Again, the graph can go into more detail and illustrates how much useful are the EBV for the given SDG. The connection between a SDG indicator and an EV is done through a relationship that is represented as a back-link for the EV. User can find the report on the number of back-links that an object in the graph has by changing to the tabular presentation of the graph. There are 22 objects in the list (type: EBV) corresponding to the 22 EBV that user can find in the GEO BON website (https://geobon.org/ebvs/what-are-ebvs) but in the graph, only 7 EBV have back-links with the SDG 15 indicators (see ).
Table 2. EBV and its connection with SDG15 indicators.
The graph not only becomes an interesting tool for learning about EV, indicators and SDGs, but also for identifying gaps and surprising results. This is the case of SDG 15 and the lack of usage of the species population class in a SDG that wants to halt biodiversity lost, or the low proportion of usage of ecosystem function and structure for a SDG that want to protect and restore terrestrial ecosystems.
Finally, the user can use the graph to perform the opposite analysis: to identify if there is any SDG15 indicator of pressure, state or impact that is not using EBV named here as orphan SDG indicators. This is not the case, so the user can conclude that for each SDG 15 indicator there is at least one EBV that can be used to assess it.
4. Discussion
4.1. Linking EVs, SDGs and EO
The user can successfully identify the strengths and weaknesses of the connections between EVs and SDGs using the graph as a tool for the analysis of the interrelation. It is now possible to state that the use of EVs for monitoring SDGs is limited and we believe that widening it could be beneficial. Hereafter some solutions for these limitations are proposed.
4.1.1. New groups of EVs
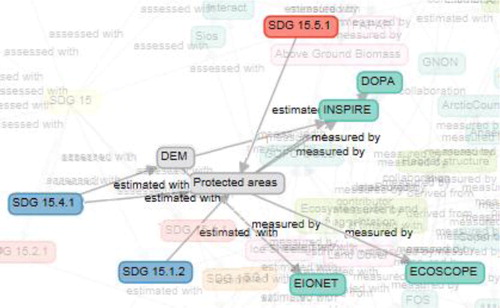
As we have discussed before, there are some mismatches between the SDG indicators and the EVs. In the same vein, Reyers et al. (Citation2017) proposed a new set of Essential SDG Variables (ESDGV) by adding specific criteria during the process for defining what is essential. However, this approach requires a change in perspective on the definition of EVs (currently focused on EO) and a conceptual model of how systems function at the level of global sustainability and human well-being, a complex system for which may be even impossible to reach a consensus. Besides, for the SDGs more related to EO, this refocus process may not be necessary. Going back to the graph results concerning the SDG 15 monitoring, the graph shows that, in some cases, the EVs framework related to such SDG needs to be complemented with some extra socio-economic variables or ancillary data. This view is also supported by members of the EBVs community (Pereira et al. Citation2013) (see ). For instance, indicators SDG 15.1.2, 15.4.1 and 15.5.1 are limited to ‘protected areas’, as their definition specifies so. Therefore, there is a clear need to use a map representing the protected areas to extract such indicators. ‘Protected area’ variable is not an EV per se, but can be considered as a Socio-Economic Variable. At the same time, indicator SDG 15.4.1(Coverage by protected areas of important sites for mountain biodiversity) also needs a digital elevation model (DEM) to filter out low elevations and select mountain protected areas. Although several institutions and networks, such as the Digital Observatory for Protected Areas (DOPA), can provide ‘protected areas’ information, this kind of variables are commonly captured by environmental Spatial Data Infrastructures (SDI) promoted by governments such as the European SDI (INSPIRE), where protected areas and elevations are part of the datasets in Annex I and Annex II respectively ().
Figure 11. In some cases, there is a need for introducing some socioeconomic variables (in grey) as a filter, such as protected areas or DEM.
Another example is SDG 2 (End hunger, achieve food security and improved nutrition and promote sustainable agriculture), which obviously requires to extend the concept of EV to the agricultural sector to consider a new type of Essential Agriculture Variable related to crop monitoring. Crop type (Kussul et al. Citation2017) and crop yield (Rembold et al. Citation2013) are two variables easily derived through EO. Unfortunately, up to now no community has yet has considered defining a set of essential variables for agriculture; only GEOGLAM, which represents a strong Agriculture Community of Practice in GEO, defined some variables based on monitoring needs to support policy and programme development at the local, regional, national and global scales (Bombelli et al. Citation2016). Again, these are socioeconomic-oriented EVs that could be strongly related to SDG2 indicators. However, it is clear that EO could play an important role in deriving parameters essential to estimate crops types and exploitation. An extra effort should be done in approaching agricultural EVs to the monitoring needs in this field and to the assessment of the global policies such as SDG. In the scope of this paper, two proposed Essential Agriculture Variables (EAV) have been incorporated to the graph (Crop type and Crop yield) to give response to 2.4.1 Proportion of agricultural area under productive and sustainable agriculture (EAV on Crop type and yield), and 2.b.2 Agricultural export subsidies (EAV on Crop type).
SDG 6 (Ensure availability and sustainable management of water and sanitation for all) requires using some of the ECV variables related to water but some efforts are ongoing in GEO to complete the definition of more specific EV for the water sector. The GEO Water Cycle Community of Practice has been engaged in identifying user needs and Essential Water Cycle Variables (EWVs). This work builds on the achievements of the IGOS-P Integrated Global Water Cycle Observation Theme (GEO Citation2004) and has resulted in two major documents (Unninayar and Friedl Citation2010; Lawford Citation2014) with the GEOSS Water Strategy (Lawford Citation2014) summarizing the most recent status. The deliberation on EWVs is still in an early stage (Bombelli et al. Citation2016). However, SDG 6 indicators are highly oriented to socioeconomic data and even if some EO related EWV are defined, these could poorly contribute to the assessment of the SDG policies. Some examples of EO contribution to the monitoring of the SDG6, can be the algal bloom detection in relation to 6.3.2 Proportion of bodies of water with good ambient water quality; (that could benefit from a water quality category in the future EWV) the flood prediction system in relation to 6.5.1 Degree of integrated water resources management implementation; and the ecosystem mapping (e.g. mangrove and lake ecosystems) in relation to 6.6.1 Change in the extent of water-related ecosystems over time (GEO Citation2017).
Similarly, SDG 7 (Ensure access to affordable, reliable, sustainable and modern energy for all) could require defining some EV related to renewable energy or carbon and oil mining. Currently, some renewable energy measurements are related to some ECVs but the measurement requirements might be different enough to consider the need for a more specific set. For example, the meteorological wind measurements are done at 10 m above the ground, an inadequate elevation for current turbines much taller than that. Renewable Energy is a domain where no major dedicated EO network exists. Moreover, no formal attempt by international bodies to define EVs was undertaken. Again, only socioeconomic-oriented EVs could help in this case to assess SDG policies in terms of energy. For this reason, only one indicator has been found in relation to an EV: 7.1.2 Proportion of population with primary reliance on clean fuels and technology where Carbon Dioxide, Methane and other Greenhouse Gases are indirectly related to the proportion of clean fuels.
Finally, other SDGs could require a mixture of EVs and socioeconomic variables such as SDG 3 (Ensure healthy lives and promote well-being for all at all ages) or SDG 11 (Make cities and human settlements inclusive, safe, resilient and sustainable) or will need to be completely based on socioeconomic variables, such as SDG 4 (Ensure inclusive and equitable quality education and promote lifelong learning opportunities for all) or SDG 5 (Achieve gender equality and empower all women and girls). Comprehensive sets of SBA-specific EVs as well as an integrated set of GEO EVs will be of high value for any gap analysis and prioritization within GEO. We recommend that a new initiative in GEO is created to therefore emphasize the importance of EVs throughout all GEO activities and push for the definition of new EVs among all SBA for a better meta-coordination and comprehension among communities, sharing knowledge and processes and giving integrated responses to interconnected challenges such as SDGs monitoring.
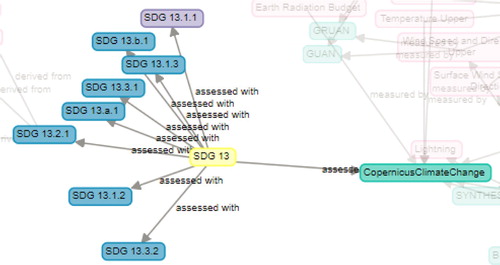
Goal 13 (Take urgent action to combat climate change and its impacts) is a special case, because the SDGs knowledge the United Nations Framework Convention on Climate Change as the primary international, intergovernmental forum for negotiating the global response to climate change. That might be the reason why although being an important goal related to actions to adapt and mitigate climate change, it is highly socioeconomic orientated and far from the ECV. Nevertheless, in the graph, it is worth mentioning the existence of the Copernicus Climate Change Service, which clearly performs background and it is related directly to SDG 13 (as an exception, at a goal level and not at an indicator level) (see ).
Figure 12. Direct relation from an EONetwork to a SDG goal as an exception for the SDG 13 goal.
On parallel, GEO’s EO4SDGs Initiative is helping on realizing the potential that EO and geospatial information can offer to the SDGs. It also supports collaboration with national statistical offices, and builds capacity within GEO on statistical practices for the purposes of the SDGs. This initiative is promoting, thus, the emergence and scaling-up of joint efforts and collaborations between these national statistical offices, international statistical agencies, UN entities, and the EO/GI community to demonstrate the effective use of EO/GI data in complementing traditional data systems such as census data, administrative data, household survey data, and vital statistics, to help realize the SDGs (GEO Citation2017).
4.1.2. New SDG indicators based on existing EVs
The SDG indicators were developed consulting the UN agencies that regularly collected socioeconomic information with not much consideration on what EO could bring. In parallel, GEO BON was proposing the EBVs connected to EO. Based on the current set of EBVs, other SDG indicators can be defined for the current set of targets in SDG 15. For example, the target 15.4 By 2030, ensure the conservation of mountain ecosystems, including their biodiversity, in order to enhance their capacity to provide benefits that are essential for sustainable development benefits from the current definition of indicators that are measuring not only the vegetal green cover (see 15.4.2 Mountain Green cover index) but also benefit from considering its animal component, which is measured using Species population EBVs. Therefore, it is relevant to propose a new indicator 15.4.n Proportion of mountain areas that are maintaining species population abundance. Similarly, target 15.5 Take urgent and significant action to reduce the degradation of natural habitats, halt the loss of biodiversity and, by 2020, protect and prevent the extinction of threatened species could benefit from another EBV by using the Ecosystem structure variable, so a new indicator 15.5.n Proportion of area that preserves habitat structures could also be incorporated.
4.1.3. New SDG indicators based on new EVs
A final step forward is to propose new SDG indicators based on new EVs. Target 15.3 By 2030, combat desertification, restore degraded land and soil, including land affected by desertification, drought and floods, and strive to achieve a land degradation-neutral world directly references degraded soil. However, its single indicator 15.3.1 Proportion of land that is degraded over the total land area does not mention the quality of the soil in terms of soil variables, such as soil degradation and soil productivity. For this specific case, the EAV proposed previously, should include a soil category with the already existing ECV Soil Carbon and soil moisture together with the new soil type, soil degradation and soil productivity (in addition to the already mentioned ‘crop’ category with ‘crop type’ and ‘crop yield’ that will be useful for SDG 2 indicators). Assuming that these EVs could exist, a new indicator 15.3.n Proportion of land that is recovering from soil degradation is be proposed. Several networks present in the graph can take the lead on this establishing soil variables: The European Network on Soil Awareness, the European Soil Bureau Network, the European Soil Data Centre the European Soil Partnership and International Soil Moisture Network.
4.2. EVs and DPSIR framework
The classification of indicators using the DPSIR framework helps us to understand the various natures of the SDG indicators and that response indicators will not be measurable with EO. Another classification factors are the socioeconomic nature of some SDGs (such as SDG 4: Ensure inclusive and equitable quality education and promote lifelong learning opportunities for all) that are obviously not measurable by EO. Even if we focus on an environmental SDG such as the SDG15, we still see that half of the indicators are related to responses in the DPSIR framework. By realizing that, we can start suspecting the SDG15 indicator framework was not designed keeping the EBV in mind. This is confirmed by the fact that two-thirds of the EBV cannot be used to quantify any of the currently proposed SDG indicators.
5. Conclusions
The SDG indicators were developed in a consultation process among the UN agencies. Independently, EO networks have internationally been working to organize different type of information regularly collected by in-situ or remote sensors, into a minimum set of Essential Variables to monitor the Earth status and evolution and to better inform policy.
GEO has done an effort to map the SDG indicators to EVs. Unfortunately, EO networks provide many types of data that are not yet classified as EVs. To clarify the panorama and study the degree of match between the SDG indicators and the EVs, a graph representing indicators, EVs and EO networks and their interconnections has been build. The graph is a useful web-based tool to find the relevant EO networks, mainly in Europe, that can provide the knowledge to assess progress towards the SDGs. The graph, that can also be exported to RDF and connected to the LOD, is maintained by the European Network of Earth Observation Networks (ENEON) observatory.
The first perception navigating through the graph data is that the match between the EVs and the SDGs is far from perfect. On one hand, some SDGs are targeting social or economic aspects but social scientists have not adopted the EV framework. Secondly, Even if EVs useful to monitor the evolution of a topic of one SDG exists, many EV's are completely ignored by the SDG indicator framework The UN and GEO should collaborate to create new indicators based on existing EVs. For example, extending the SDG 15 indicators making use of some additional EBV could be beneficial for having a more precise SDG monitoring. Furthermore, some other SDGs that are dealing with scientific disciplines have not been addressed by their collectives yet. On the other hand, a set of SDG indicators measure human responses to changes in the status of the Earth system that impact on human activities. This set of indicators can rarely be linked to EVs, due to the indicators socioeconomic nature. The application of the DPSIR model can help users to distinguish this set of SDG indicators.
In this context, GEO should advocate for a broader adoption of the EVs framework by creating a GEO initiative on Essential Variables as a coordination body for EVs. For example, the initiative could explore new types of EVs such as the Essential Agriculture Variables (EAV) that could be useful for better assessing SDG 2 and SDG 15 indicators. Among the EAV, the need for a soil category and several networks that can take the lead on this has been identified.
The work presented here is limited to the biodiversity and the food, water and energy nexus. To use the same approach for all SDGs indicators will require a better integration of socioeconomic variables.
Disclosure statement
No potential conflict of interest was reported by the authors.
ORCID
Alaitz Zabala http://orcid.org/0000-0002-3931-4221
Additional information
Funding
References
- Anderson, K., B. Ryan, W. Sonntag, A. Kavvada, and L. Friedl. 2017. “Earth Observation in Service of the 2030 Agenda for Sustainable Development.” Geo-spatial Information Science 20 (2): 77–96. doi:10.1080/10095020.2017.1333230.
- Atzberger, C. 2013. “Advances in Remote Sensing of Agriculture: Context Description, Existing Operational Monitoring Systems and Major Information Needs.” Remote Sensing 5 (2): 949–981. doi: 10.3390/rs5020949
- Bojinski, S., M. Verstraete, T. C. Peterson, C. Richter, A. Simmons, and M. Zemp. 2014. “The Concept of Essential Climate Variables in Support of Climate Research, Applications, and Policy.” Bulletin of the American Meteorological Society 95: 1431–1443. doi: 10.1175/BAMS-D-13-00047.1
- Bombelli, A., J. Masó, I. Serral, H.-P. Plag, J.-P. Shelley, P. Blonda, and S. Nativi. 2016. " D2.3: Proposal of EVs for selected themes." Pp. 66. https://ddd.uab.cat/record/163483.
- Bombelli, A., I. Serral, P. Blonda, J. Masó, H.-P. Plag, J.-P. Shelley, and I. McCallum. 2015. " D2.2. EVs Current Status in Different Communities and Way to Move Forward." Accessed 23 July 2018. https://ddd.uab.cat/record/146882.
- Daily, G. C., S. Polasky, J. Goldstein, P. M. Kareiva, H. A. Mooney, L. Pejchar, T. H. Ricketts, J. Salzman, and R. Shallenberger. 2009. " Ecosystem Services in Decision Making Time to Deliver."
- Disley, Y. P. 2013. “Sustainable Development Goals for People and Planet.” Nature 495: 21. doi: 10.1038/495021a
- EEA. 1995. Europe's Environment: The Dobris Assessment. Copenhagen: European Environmental Agency, 8 pp.
- Feest, A. 2013. “The Utility of the Streamlining European Biodiversity Indicators 2010 (SEBI 2010).” Ecological Indicators 28: 16–21. doi: 10.1016/j.ecolind.2012.10.015
- Fischer, A., and S. Grimes. 2012. " Definition of Ecosystem Essential Ocean Variables." Technical Report, GEOWOW-WP6-IOU-I6.1.1, GEOSS Interoperability for Weather, Ocean and Water, IOC-UNESCO, 24 pp.
- Fritz, S., I. McCallum, C. Schill, C. Perger, L. See, D. Schepaschenko, M. van der Velde, F. Kraxner, and M. Obersteiner. 2012. “Geo-Wiki: An Online Platform for Improving Global Land Cover.” Environmental Modelling & Software 31: 110–123. doi: 10.1016/j.envsoft.2011.11.015
- Geijzendorffer, I. R., E. C. Regan, H. M. Pereira, L. Brotons, N. Brummitt, Y. Gavish, P. Haase, C. S. Martin, J. B. Mihoub, and C Secades. 2016. “Bridging the gap Between Biodiversity Data and Policy Reporting Needs: An Essential Biodiversity Variables Perspective.” Journal of Applied Ecology 53 (5): 1341–1350. doi: 10.1111/1365-2664.12417
- Geller, G. N., P. N. Halpin, B. Helmuth, E. L. Hestir, A. Skidmore, M. J. Abrams, N. Aguirre, et al. 2017. “Remote Sensing for Biodiversity.” In The GEO Handbook on Biodiversity Observation Networks, edited by M. Walters and R. Scholes, 187–210. Cham: Springer.
- GEO. 2004. The Integrated Global Water Cycle Observations (IGWCO) Community of Practice. Group on Earth Observations.
- GEO. 2017. " Earth Observations in Support of the 2030 Sustainable Development." Document V.1.1. Accessed 24 July 2018 https://www.earthobservations.org/documents/publications/201703_geo_eo_for_2030_agenda.pdf.
- Goetz, S., and R. Dubayah. 2011. “Advances in Remote Sensing Technology and Implications for Measuring and Monitoring Forest Carbon Stocks and Change.” Carbon Management 2 (3): 231–244. doi: 10.4155/cmt.11.18
- Gore, A. 1998. " The Digital Earth: Understanding Our Planet in the 21st Century." Accessed 4 February 2012. http://www.nextspace.co.nz/wp-content/uploads/2010/08/Gore-Speech2.pdf.
- Hayes, K. R., J. M. Dambacher, G. R. Hosack, N. J. Bax, P. K. Dunstan, E. A. Fulton, P. A. Thompson, et al. 2015. “Identifying Indicators and Essential Variables for Marine Ecosystems.” Ecological Indicators 57: 409–419. doi: 10.1016/j.ecolind.2015.05.006
- ICSU. 2017. A Guide to SDG Interactions: From Science to Implementation. Edited by D. J. Griggs, M. Nilsson, A. Stevance, and D. McCollum. Paris: International Council for Science.
- IGES. (2017) Sustainable Development Goals Interlinkages and Network Analysis: A Practical Tool for SDG Integration and Policy Coherence. Edited by X. Zhou and M. Moinuddin. Kanagawa: Institute for Global Environmental Strategies.
- Kristensen P. 2004. The DPSIR Framework. Denmark: Environmental Research Institute, 10 pp.
- Kussul, N., M. Lavreniuk, S. Skakun, and A. Shelestov. 2017. “Deep Learning Classification of Land Cover and Crop Types Using Remote Sensing Data.” IEEE Geoscience and Remote Sensing Letters 14 (5): 778–782. doi:10.1109/LGRS.2017.2681128.
- Lausch, A., A. Schmidt, and L. Tischendorf. 2015. “Data Mining and Linked Open Data – New Perspectives for Data Analysis in Environmental Research.” Ecological Modelling 295: 5–17. doi: 10.1016/j.ecolmodel.2014.09.018
- Lawford, R. 2014. The GEOSS Water Strategy: From Observations to Decisions. Geneva: Group on Earth Observations.
- Mace, G. M., and J. E. M. Baillie. 2007. “The 2010 Biodiversity Indicators; Challenges for Science and Policy.” Conservation Biology 21 (6): 1406–1413. doi: 10.1111/j.1523-1739.2007.00830.x
- Masó, J., and L. Bastin. 2016. " OGC Geospatial User Feedback Standard: Conceptual Model (15-097r1)." OGC Implementation Standard. Accessed 24 July 2018. http://www.opengeospatial.org/standards/guf.
- Niemeijer, D. 2002. “Developing Indicators for Environmental Policy: Data-Driven and Theory-Driven Approaches Examined by Example.” Environmental Science & Policy 5: 91–103. doi: 10.1016/S1462-9011(02)00026-6
- Pereira, H. M., S. Ferrier, M. Walters, G. N. Geller, R. H. G. Jongman, Bruford Scholes, R. J. M. W. Brummitt N, et al. 2013. “Essential Biodiversity Variables.” Science 339: 277–278. doi: 10.1126/science.1229931
- Rembold, F., C. Atzberger, I. Savin, and O. Rojas. 2013. “Using Low Resolution Satellite Imagery for Yield Prediction and Yield Anomaly Detection.” Remote Sensing 5 (4): 1704–1733. doi:10.3390/rs5041704.
- Reyers, B., M. Stafford-Smith, K. H. Erb, R. J. Scholes, and O. Selomane. 2017. “Essential Variables Help to Focus Sustainable Development Goals Monitoring.” Current Opinion in Environmental Sustainability 26–27: 97–105. doi: 10.1016/j.cosust.2017.05.003
- Santoro, M., S. Nativi, and P. Mazzetti. 2016. “Contributing to the GEO Model Web Implementation: A Brokering Service for Business Processes.” Environmental Modelling & Software 84: 18–34. doi: 10.1016/j.envsoft.2016.06.010
- Secades, C., B. O'Connor, C. Brown, and M. Walpole. 2014. " Earth Observation for Biodiversity Monitoring: A Review of Current Approaches and Future Opportunities for Tracking Progress Towards the Aichi Biodiversity Targets (Secretariat of the Convention on Biological Diversity, 2014)." Accessed 25 July 2018. https://www.cbd.int/doc/publications/cbd-ts-72-en.pdf.
- Su, Z., W. Timmermans, Y. Zeng, J. Schulz, V. O. John, R. A. Roebeling, P. Poli, et al. 2018. “An Overview of European Efforts in Generating Climate Data Records.” Bulletin of the American Meteorological Society 99 (2): 349–359. doi: 10.1175/BAMS-D-16-0074.1
- Unninayar, S., and L. Friedl. 2010. GEO Task US-09-01a – Earth Observation Priorities: Water Societal Benefit Area. Battelle, USA: Group on Earth Observations.
- UN: Report of the Inter-Agency and Expert Group on Sustainable Development Goal Indicators (E/CN.3/2016/2/Rev.1). New York: United Nations Economic and Social Council; 2016.
- UN: Tier Classification for Global SDG Indicators. 31 December 2018. United Nations Economic and Social Council; 2018. Accessed 9 January 2018. https://unstats.un.org/sdgs/files/Tier Classification of SDG Indicators_31 December 2018_web.pdf
- Zaldívar, J. M., P. Viaroli, A. Newton, R. De Wit, C. Ibañez, S. Reizopoulou, and N. Murray. 2008. “Eutrophication in Transitional Waters: an Overview.” Transitional Waters Monographs 2 (1): 1–78.