
 ?Mathematical formulae have been encoded as MathML and are displayed in this HTML version using MathJax in order to improve their display. Uncheck the box to turn MathJax off. This feature requires Javascript. Click on a formula to zoom.
ABSTRACT
It has long been recognized that an effective drought monitoring and early warning system, which provides functions for real-time condition monitoring and prediction, risk assessment, information dissemination and response recommendation, is very important for the preparedness for and mitigation of drought impacts. In this article, we review the currently existing drought monitor and early warning systems, discuss applicable remote sensing datasets and drought indicators and present the development of a web-based quasi-real-time Global Drought Monitoring & Analysis Platform (Web-GDMAP). The Web-GDMAP is built upon a series of indicators derived from multi-source satellite remote sensing data and various other sources of data. From a technical perspective, the Web-GDMAP system includes a series of components from data storage, model implementation and distribution, to client-side visualization and user intuitive interaction. From a theoretical perspective, the Web-GDMAP system integrates multi-indicators on different aspects of drought, including anomalies in precipitation, anomalies in land surface thermal and vegetation conditions, water deficit of soil and plants, etc. Several case studies on applying the developed Web-GDMAP in the Asian region are demonstrated. Further improvements and perspectives are discussed.
1. Introduction
Drought, caused by a shortage of water over a certain period, is a normal but complex climatological event (Wilhite and Glantz Citation1985). Evolution of drought usually occurs in stages starting from meteorological drought, followed by agricultural and hydrological drought (Mishra and Singh Citation2010). As a general climatic phenomenon, the drought hazard cannot be avoided but its impact on society and environment can be mitigated through drought management (Wilhite Citation2007; Hannaford et al. Citation2018). Drought management frameworks, in turn, heavily rely on powerful drought monitoring and early warning mechanisms, which can provide rich information for drought dynamics (Wilhite, Sivakumar, and Wood Citation2000; Hao et al. Citation2017). Numerous drought indices have been developed to qualify and quantify different stages of drought and multiple attempts have been and are being made to develop web-based drought early warning systems (DEWS) to capture in (near) real-time these drought events (Heim Citation2002; AghaKouchak et al. Citation2015).
Several national and continental scale drought monitoring tools are in operation (). European Drought Observatory (EDO) (Niemeyer et al. Citation2009), which sees expansion to Latin America through EuroCLIMA collaboration program (Pozzi et al. Citation2013) and Africa through the Drought Early Warning System for Africa (DEWFORA) (Iglesias et al. Citation2014), presents a dynamic system based on the Combined Drought Indicator (CDI) and Standardized Precipitation Index (SPI). Users can retrieve time-series, maps and raw data through Web Coverage Services (WCS) as defined by the Open Geospatial Consortium (OGC). A processing service provides the functionality to generate high-resolution maps with the available coverages. The Princeton Experimental African Drought Monitor also can provide supplementary drought early warning information over Africa through the Famine Early Warning Systems Network (FEWS Net) (Sheffield et al. Citation2013).
Table 1. Overview of web-based drought monitoring initiatives.
The U.S. Drought Monitor was the first web-based integrated drought monitoring platform and combines multi-sources information including space and ground observations as well as expert advice. Information is presented as static maps, where users can access precomputed drought conditions for different regions. There is no access to the raw data and no direct control over the influences of the parameters involved in the computation of the drought maps (ad-hoc analysis) (Lawrimore et al. Citation2002; Svoboda et al. Citation2002).
In Asia, there is no existing web-based DEWS, but the National Climate Center (NCC) of the China Meteorological Administration (CMA) produces daily drought reports and maps of China (Hao et al. Citation2014; Kim et al. Citation2010). On a global level, the FAO’s Global Information and Early Warning System on food and agriculture (GIEWS) provides monthly briefing reports on regions affected by natural hazards including droughts (Minamiguchi Citation2005). The Standardized Precipitation-Evapotranspiration Index (SPEI) based Global Drought Monitor system offers near real-time information on drought condition at a global scale. Furthermore, there is the conceptual framework for a Global Drought Early Warning System (GDEWS), which is a bottom-up approach aiming to merge above mentioned national and continental systems into global coverage (Brewer and Heim Citation2011). The current implementation of this framework is the Global Drought Monitoring Portal (GDMP) by the United States National Centers for Environmental Information (NCEI) (Heim and Brewer Citation2012).
The Earth Observation Monitor system provides a web-based protocol to assess time series of Normalized Difference Vegetation Index (NDVI) and the Land Surface Temperature (LST) derived from MODIS observations (Eberle et al. Citation2013). No drought indicators are included and only long-term time series can be derived, but the system does provide access to a series of time series analysis algorithms, such as Timesat (Jönsson and Eklundh Citation2004), Breaks For Additive Season and Trend (BFAST) (Verbesselt et al. Citation2010) and Greenbrown (Forkel et al. Citation2013) for ad-hoc analysis. Hao et al. (Citation2014) argued that the aforementioned efforts are still inadequate and suggested that a drought monitoring and prediction system should integrate multiple drought-related variables. Furthermore, there is a significant gap for users to access ad-hoc analysis of existing and cutting-edge drought indices and there are still limited initiatives for the dissemination of raw data.
These ad-hoc analysis capabilities will require a closer link between different established scientific fields such as database development appropriate for data-intensive computing and sophisticated remote sensing techniques to increase the understanding of drought development. In this context, our aim is to develop a web-based quasi-real-time Global Drought Monitoring & Analysis Platform (Web-GDMAP) with the following objectives:
Construct a web-based integrated global drought monitoring and analysis platform to retrieve, analyze and co-validate the meteorological-, agricultural and hydrological drought stages.
Adopt solely Open Source solutions, OGC and W3C standards where Earth observation data is hosted on a private cloud deployment model.
Demonstrate tools that are able to present pre-calculated near real-time drought-related data products and can calculate time series (1D), maps (2D) and temporal area analysis (3D) on the fly as virtual data products.
2. Data and indicators
Generally, droughts cause a chain reaction through precipitation, runoff, soil moisture, evapotranspiration, and ground water. Consequently, the variations in the hydrological cycle can affect vegetation, land surface temperature, and surface albedo. Fortunately, all these mentioned elements are observable, especially most of them can be observed by satellite sensors. We aimed at integrating all these information sources into one system including provision of user-friendly analysis and visualization operations. lists all datasets that are being, or planned to be, included in the system. The possible data sources, links and corresponding references are also provided. All datasets are translated to the WGS84 ellipsoid identified as the EPSG:4326 projection before ingesting the data as regular data cubes in the array database management system as discussed in Section 3.2.
Table 2. Drought-related datasets integrated in the platform.
The system uses the elements from the different available datasets to develop ad-hoc processing services that can compute numerous drought indicators (). The elements of the drought indicators are briefly discussed here. The Precipitation Anomaly Percentage (PAP) is solely based on precipitation. Temperate Condition Index (TCI) and Normalized Temperature Anomaly Index (NTAI) are based on LST. Vegetation Condition Index (VCI) and Normalized Vegetation Anomaly Index (NVAI) are based on the NDVI. Vegetation Health Index (VHI) is a combination of TCI and VCI and the Normalized Drought Anomaly Index (NDAI) is a combination of NTAI and NVAI. The Evapotranspiration Deficit Index (EDI) is estimated using a pixel-wise comparison of the actual ET and potential ET, where both elements were computed using a hybrid remote sensing based evapotranspiration model developed by Hu and Jia (Citation2015). The EDI can be used as a measure for plant stress which is calculated as the difference between potential ET and actual ET. The potential ET is a modified version of the actual ET, where the canopy resistance is replaced by the minimum canopy resistance that does not include the root zone soil moisture stress, i.e. it applies to well-watered conditions.
Table 3. Drought indicators available in the platform.
3. System architecture
The platform includes five distinctive components separated over both the client- and server-side. The client-side is the actual front-end of the developed platform and provides a user-intuitive graphical user interface (GUI) to monitor, process and analyze drought-related Earth observation data. presents an overview of the different components on both the client-side and server-side. In the figure, the interaction between the components is divided into internal and external requests (orange and purple lines respectively) and the response (green lines).
Figure 1. Overview of the data service architecture with the different components of both the client- and server-side.
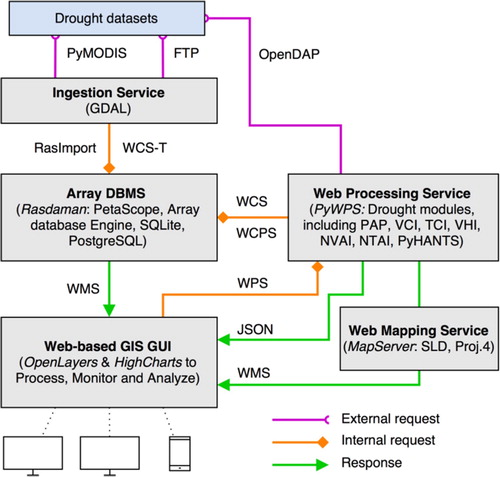
3.1. Ingestion service
The ingestion-service component functions as a bridge between raw datasets and the array Database Management System (array DBMS). PyMODIS (Delucchi and Neteler Citation2013) is adopted to retrieve MODIS HDF/XML files. The RasImport tool and Web Coverage Service-Transactional (WCS-T) (Baumann Citation2016) are used to import or update retrieved multi-dimensional (meta)data into the array DBMS. To introduce consistency among the ingested datasets, Geospatial Data Abstraction Library (GDAL/OGR contributors Citation2018) (GDAL) was used for conversion and transformation of different raster geospatial formats. All the raw datasets involved in the system were automatically retrieved from their online source and ingested in the array DBMS using a regular tiling scheme.
3.2. Array-DBMS
The component response for the array database management system was configured by adopting Rasdaman (Baumann Citation2018), which allows for storing and querying massive multi-dimensional arrays. It exists out of two components, namely the Petascope component and the multi-dimensional big-data analytics engine. The Petascope component provides service interfaces interaction using OGC standards, while the big-data analytics engine is the core that manages how multi-dimensional arrays are stored, requested and served. The Rasdaman core uses SQLite to store the arrays as binary large objects (BLOBs) and uses PostgreSQL to store the metadata essential for requesting and ingesting Earth observation data. Data coverage requests from Rasdaman are possible through the Web Coverage Service (WCS) and Web Coverage Processing Service (WCPS), where the latter one is used for ad-hoc filtering and processing of multi-dimensional coverage data.
3.3. Web processing and mapping service
The system components responsible for access to numerous developed modules are published as Web Processing Services (WPS) through PyWPS (Čepický and de Sousa Citation2016). These modules include the computation of numerous drought indices, but also include tools to analyze and co-validate the virtual data products describing the drought events. The adoption of PyWPS provides flawless integration with the developed modules as both were written in Python. The modules can request, for example, coverage data using WCS or WCPS from the Array DBMS Rasdaman to compute different drought indices for a single location over time (1D), a specific spatial region (2D) or multi-temporal spatial area (3D).
The system component responsible for publishing the spatial datasets as WMS layers is MapServer (Vatsavai et al. Citation2006). It supports on the fly change of map projections through the PROJ.4 Cartographic Projections library (PROJ contributors Citation2018) and uses Styled Layer Descriptor (SLD) to extend the WMS standard by providing access to legend symbols and coloring.
3.4. WebGIS GUI
The system component that is visible to the client is the user-intuitive GUI, which mainly includes three kinds of operations:
Time series (1-D) retrieving and visualization. Users can retrieve long-term time series over selected pixels or region for one or several data set at the same time and plot them together. The drought indices which are not precomputed are calculated ad-hoc. In addition, the retrieved time series can be downloaded in PNG or CSV format.
Spatial map (2-D) retrieving and visualization. Users can retrieve regional images over selected AoIs from the data server. The drought indices which are not precomputed are calculated on the fly as virtual data products.
Data dissemination operations. Users can order and download any raw data set from the data server as well as virtual data products such as ad-hoc computed drought indices.
For the first two operations, based on parameter settings, each WPS request is sent to the server-side triggering the corresponding modules. The results are served in JSON format for 1-D time-series or as a WMS layer for 2-D spatial areas and presented in HighChart and OpenLayers respectively. OpenLayers is an open-source initiated virtual globe build in JavaScript and supports mapping OGC WMS. HighChart uses JavaScript configuration syntax to enable creation of interactive charts by adopting W3C standard JSON for data serialization of Linked Data.
4. Case studies based on the platform
Since drought is a slow-onset natural hazard, it is highly beneficial towards impact mitigation to detect drought in early stages. With (near) real-time information for risk assessments and response recommendation, the preparedness towards droughts can be increased and mitigation measurements can be implemented. In this context, some application examples are provided based on the developed Web-GDMAP.
4.1. Time-series analysis of the drought event of 2008 in Sichuan, China
The system can provide time series based drought analysis, where users can set a location by clicking on the map and select the date period. The time series of raw dataset then can be retrieved from server-side Rasdaman database with WCS services. Then time series of drought indicators can be calculated by the WPS service on the server-side. The calculation results are sent to client (or front) side for visualization.
Sichuan is a province in the southwestern of China with abundant natural resources, but one of the provinces with the most serious drought-flood disasters in the Yangtze River basin (Huang et al. Citation2014, Citation2017). presents the time series of several drought indicators in the period from January 2008 to January 2009 in Xiaojin county, Sichuan province (102°27′E; 30°51′N). The PAP ((a)) present values reaching −10% and −15% for June and July 2008 indicating a lack of precipitation in these months in comparison to the precipitation in the same period of the last decades. This trend continues in the VCI and NVAI between July, August and September where the VCI present zero values, meaning it is the driest period over the VCI observations available.
Figure 2. Screenshot of the platform showing several time series of drought indices corresponding to the retrieved pixel.
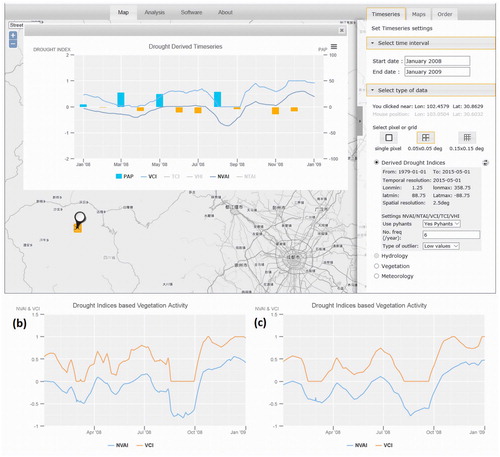
The NVAI reaches the lowest point in August with a value of −0.75, indicating a severe vegetation stress before the vegetation stress stabilize. The vegetation recovers from September 2008 and onwards as is apparent by the increased VCI and NVAI.
4.2. Map monitoring of the drought event of 2010 in Inner-Mongolia, China
The system provides regional drought condition mapping services. Users can set an analysis area and choose preferred drought indicators. All these information then will be sent to corresponding WPS service on the back-end server. The regional drought indicators will be calculated accordingly and the resulted image is sent back as a WMS published layer to client browsers.
Inner Mongolia is a province in North China which is considered to have the highest trend of warming in China (Guo et al. Citation2013). Since 2000, there has been an increasing frequency of droughts with a drop of over 70 per cent of the water supplies in 2010 (Wang and Zhang Citation2012). presents the NDAI result for a semiarid region located between 103°24′E–127°30′E and 35°6′N –47°42'N that is predominantly covered by sparse vegetation and rainfed croplands for the beginning of August 2010. The NDAI categorize drought in several classes, where large parts of Inner-Mongolia, Shanxi and the west of Hebei provinces are affected by extreme and severe drought conditions (i.e. NDAI values below −0.25), but where Liaoning province presents conditions corresponding to normal to above average wet (i.e. NDAI values above +0.15).
Figure 3. Screenshot of the platform showing (a) the NDAI indicator within the Web-GDMAP; (b) the disseminated NTAI indicator; (c) the disseminated EDI indicator for August 2010 in Northern China.
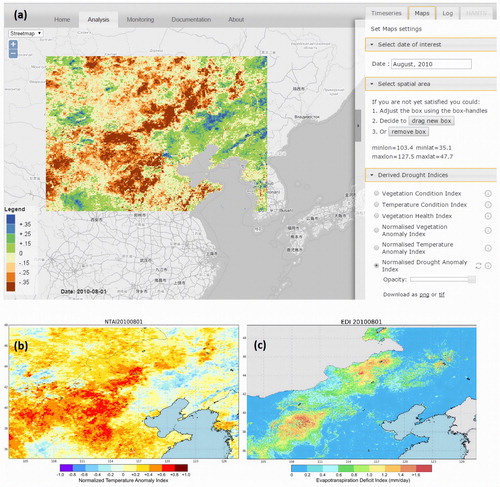
For the same region, the NTAI ((b)) and EDI ((c)) were also derived from the platform to co-validate drought indicators side-by-side. The NDAI showed a distinctive drought region, which is further confirmed by the NTAI, with high values covering a large area. The area with severe drought according to NTAI is larger than the area of NDAI suggesting that solar radiation in this region is not the predominant factor for vegetation growth and the area also depend on water conditions as factor for limiting vegetation growth. This is partly confirmed with the EDI, which presents a more compact region with increased plant water stress through high evapotranspiration deficits (i.e. >1.0 mm/day).
4.3. County-level drought alert for July 2014 in Jiyuan county, Henan province, China
Web-GDMAP also provides access to regional drought statistics on multiple administrative levels. Central China’s Henan province is one of the largest grain production areas in China and was struck by a severe summer drought in 2014 affecting and damaging 30 million hectares of agricultural land (Lu, Jia, and Zhou Citation2015). presented the drought statistics for Jiyuan county in Henan province ((a)). For this county the fractional area of NDAI over this county is computed for 4 succeeding observations, namely 25th May, 10th and 26th June, 12th and 28th July in 2014 ((b)) and 2015 ((c)).
Figure 4. Screenshot of the platform showing (a) Jiyuan county in Henan province; (b) presents the fractional area of NDAI over multiple observations in May–July 2014; (c) presents the fractional area of NDAI over multiple observations in May–July 2015.
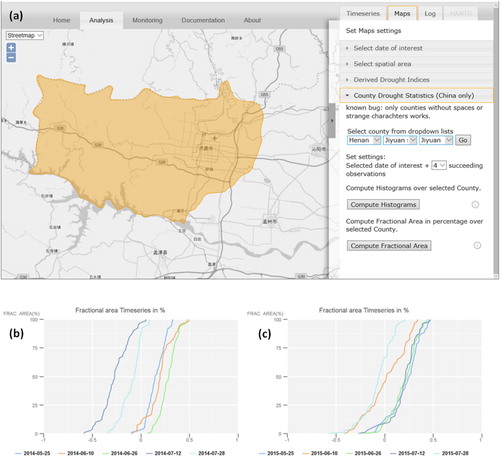
The fractional area statistic describes the cumulative distribution of the NDAI and provides insight into drought evolution. In the first three periods, 25th May, 10th and 26th June in 2014 ((b)), most of NDAI value were above zero. In the period between 26th June and 12th July 2014 the drought is evolving with increasing negative NDAI values. The vegetation seems to recover as the fractional area of NDAI on 28th July is going in positive direction. Additional, the fractional area is compared against the same period in 2015 ((c)). The fractional area presents a pattern without severe droughts conditions. During 25th May, 26th June and 12 July 2015 the NDAI values are mostly positive and the periods of 10th June and 28th July 2015 suggest a slight vegetation stress with an increase of negative NDAI values.
5. Discussion
The results present a sophisticated approach to use open source software for presenting the data using a web-based accessible drought portal and to perform ad-hoc analysis on vast amount of satellite-based imagery. Provision of and web-based access to detailed drought information is a process that is started with initiatives such as the U.S. Drought Monitor (Svoboda et al. Citation2002) and the European Drought Observatory (Niemeyer et al. Citation2009). With this research, we have aimed to explore new approaches to present insight into the development of complex national hazard.
Considering that there is no single drought indicator that can describe a drought as is, and as the human perception of drought can differ from the occurrence of drought in a natural hydrological system (Van Loon et al. Citation2016; Bachmair et al. Citation2016), we have to anticipate in development of drought early warning systems to incorporate human perception of ground-based drought observations in order to evaluate space derived drought indicators (Hoek Citation2016, 168).
Cloud-computing providers also provide platforms, such as Google Earth Engine, that have the ability to provide planetary-scale Earth science data and analysis (Gorelick et al. Citation2017). This platform has proven to be very successful in per-pixel and finite neighborhood operations through efficient distribution of computations across the abundance of low-end servers in the datacenters of these providers.
Limiting factors for usage of these platforms is firstly the aspect of being closed-source. The API calls are collected in chain and send to the server-side where propriety source codes execute these, albeit efficient. Second, users must adhere to the license agreement by the data provider and often solely educational or research usage is free of charge, not forgetting the right of unilateral modification or amendments of this agreement by the provider. Third, operational accessibility of these platforms is not guaranteed across the globe and fourth, installation of these engines on a local supercomputing center is not possible.
Therefore the presented conceptual framework in this study takes a different approach in which it adopts solely open-source components and adhere to OGC standards to establish an engine aiming on efficient computation of operations on a single medium- to low-end server without the need or accessibility of/to warehouse-scale machines, where the presented architecture does provide in the ability to be integrated in local supercomputing centers.
In the comparison of the currently known web-based drought monitoring initiatives (), we argued that both the dissemination of raw data and ad-hoc analysis is a limiting aspect of multiple web-based drought monitoring initiatives. In this research, we found out that adoption of an array database management system including integration of OGC standards enables ad-hoc analysis within a web-based drought monitoring initiative. Reiterating that ad-hoc analysis is the opposite of presenting pre-computed analysis results and in this regards is affected by a trade-off between speed of computation and storage of pre-computed products.
The dissemination of raw data as a resultant of the ad-hoc analysis enables options for data serialization of Linked Data. WCS-access or HTTP/FTP access to Cloud Optimized Geotiffs (COG) of ad-hoc computed results provides options for initiatives that integrate remote processing services to compute new information.
For example, one might have access to raw high-resolution imagery on server 1 and connect this in an automated manner to a processing service containing an open-access filtering procedure on server 2 where the results would be used to compute a drought index on server 3 that is presented within a WebGIS GUI on server 4. In reality, this is not yet common practice as this also introduce a reliability of connectivity between servers that often cannot be guaranteed.
Future works will focus on integrating more hydrological elements listed in . Inclusion of more hydrological elements will provide deeper insight into the drought development and can provide more comprehensive drought information. We also plan to integrate data products from the Land, Atmosphere Near real-time Capability for EOS (LANCE) for near real-time processing system as it provides imagery within 3.5 h of observation and will improve the application of real-time drought monitoring.
6. Conclusions
This work presented Web-GDMAP as a conceptual framework that can be established as a new platform for global drought monitoring and analysis using satellite observations. The platform provides ad-hoc drought condition analysis and near real-time drought monitoring. A series of drought indicators, including the PAP, TCI, VCI, VHI NTAI, NVAI and NDAI, are implemented in the platform. Besides, Evapotranspiration Deficit Index (EDI) based on ET product produced by the ETMonitor is included.
The adopted system architecture is based upon open-source software and open standards released under the Open Geospatial Consortium. Research towards integrating geospatial open-source software and standards is important in order to foster the transition towards cloud-based computing and analysis on remotely sensed datasets. The integration of open source virtual globes such as Open Streetmap and adoption of OGC standards such as WCS, WMS, WPS within the Web-GDMAP, do provides public access and instantaneous visualization of the derived drought indicators and makes interlinkage of the ad-hoc processing services possible. With adoption of Rasdaman as array DBMS for numerous large datasets, the system reveals the possibility and advantage to manage drought relevant datasets.
Next versions of Web-GDMAP will include improved accessibility of visualization of temporal changes in regions of interest. Also the computation of drought statistics should be expanded to integrate the administrative regions of total world instead of China only as of moment of writing. The concept, protocols, hardware support and other software engineering specifications is carried out to make the ad-hoc computation, instantaneous visualization and analysis of drought indicators using satellite observations in a web-based environment a reality for the drought community.
Disclosure statement
No potential conflict of interest was reported by the authors.
Additional information
Funding
Related Research Data
References
- AghaKouchak, A., A. Farahmand, F. S. Melton, J. Teixeira, M. C. Anderson, Brian D. Wardlow, and C. R. Hain. 2015. “Remote Sensing of Drought: Progress, Challenges and Opportunities.” Reviews of Geophysics 53 (2): 452–480. doi: 10.1002/2014RG000456
- Bachmair, Sophie, Kerstin Stahl, Kevin Collins, Jamie Hannaford, Mike Acreman, Mark Svoboda, Cody Knutson, et al. 2016. “Drought Indicators Revisited: The Need for a Wider Consideration of Environment and Society.” Wiley Interdisciplinary Reviews: Water 3 (4): 516–536. doi:10.1002/wat2.1154.
- Baumann, Peter. 2016. OGC 13-057R1 – WCS Extension – Transaction. Open Geospatial Consortium. http://docs.opengeospatial.org/is/13-057r1/13-057r1.html.
- Baumann, Peter. 2018. Rasdaman – Raster Data Manager. Large-scale Scientific Information Services research group. doi:10.5281/zenodo.1163021.
- Becker-Reshef, Inbal, Chris Justice, Mark Sullivan, Eric Vermote, Compton Tucker, Assaf Anyamba, Jen Small, et al. 2010. “Monitoring Global Croplands with Coarse Resolution Earth Observations: The Global Agriculture Monitoring (GLAM) Project.” Remote Sensing 2 (6): 1589–1609. doi:10.3390/rs2061589.
- Beguería, Santiago, Sergio M. Vicente-Serrano, Fergus Reig, and Borja Latorre. 2013. “Standardized Precipitation Evapotranspiration Index (SPEI) Revisited: Parameter Fitting, Evapotranspiration Models, Tools, Datasets and Drought Monitoring.” International Journal of Climatology 34 (10): 3001–3023. doi:10.1002/joc.3887.
- Brewer, Michael J., and Richard R. Heim. 2011. “International Drought Workshop Series.” Bulletin of the American Meteorological Society 92 (7): E29–E31. doi:10.1175/2011BAMS3172.1.
- Delucchi, L., and M. G. Neteler. 2013. “PyModis: The Python Library for MODIS Data.” http://www.pymodis.org/.
- Deng, M., L. Di, W. Han, A. Yagci, and C. Peng. 2011. “The Development of a Web-service-based On-demand Global Agriculture Drought Information System.” AGU Fall Meeting Abstracts 52 (December): NH52A-08.
- Dorigo, W. A., W. Wagner, R. Hohensinn, S. Hahn, C. Paulik, A. Xaver, A. Gruber, et al. 2011. “The International Soil Moisture Network: A Data Hosting Facility for Global in situ Soil Moisture Measurements.” Hydrology and Earth System Sciences 15 (5): 1675–1698. doi:10.5194/hess-15-1675-2011.
- Eberle, Jonas, Siegfried Clausnitzer, Christian Hüttich, and Christiane Schmullius. 2013. “Multi-source Data Processing Middleware for Land Monitoring Within a Web-based Spatial Data Infrastructure for Siberia.” ISPRS International Journal of Geo-information 2 (3): 553–576. doi:10.3390/ijgi2030553.
- Čepický, Jáchym, and Luís Moreira de Sousa. 2016. “New Implementation of OGC Web Processing Service in Python Programming Language. PyWPS-4 and Issues We are Facing with Processing of Large Raster Data Using OGC WPS.” ISPRS – International Archives of the Photogrammetry, Remote Sensing and Spatial Information Sciences XLI-B7 (June): 927–30. doi:10.5194/isprs-archives-XLI-B7-927-2016.
- Forkel, Matthias, Nuno Carvalhais, Jan Verbesselt, Miguel D. Mahecha, Christopher S. R. Neigh, and Markus Reichstein. 2013. “Trend Change Detection in NDVI Time Series: Effects of Inter-annual Variability and Methodology.” Remote Sensing 5 (5): 2113–2144. doi:10.3390/rs5052113.
- GDAL/OGR Contributors. 2018. GDAL/OGR Geospatial Data Abstraction Software Library. Open Source Geospatial Foundation. http://gdal.org.
- Gorelick, Noel, Matt Hancher, Mike Dixon, Simon Ilyushchenko, David Thau, and Rebecca Moore. 2017. “Google Earth Engine: Planetary-scale Geospatial Analysis for Everyone.” Remote Sensing of Environment, Big Remotely Sensed Data: Tools, Applications and Experiences 202 (December): 18–27. doi:10.1016/j.rse.2017.06.031.
- Guo, Wen-Li, Shi Hong-Bo, Ma Jing-Jin, Zhang Ying-Juan, Wang Ji, Shu Wen-Jun, and Zhang Zi-Yin. 2013. “Basic Features of Climate Change in North China During 1961–2010.” Advances in Climate Change Research 4 (2): 73–83. doi:10.3724/SP.J.1248.2013.073.
- Hannaford, Jamie, Kevin Collins, Sophie Haines, and Lucy J. Barker. 2018. “Enhancing Drought Monitoring and Early Warning for the United Kingdom Through Stakeholder Coinquiries.” Weather, Climate, and Society 11 (1): 49–63. doi:10.1175/WCAS-D-18-0042.1.
- Hao, Zengchao, Amir AghaKouchak, Navid Nakhjiri, and Alireza Farahmand. 2014. “Global Integrated Drought Monitoring and Prediction System.” Scientific Data 1 (March): 140001. doi:10.1038/sdata.2014.1.
- Hao, Zengchao, Xing Yuan, Youlong Xia, Fanghua Hao, and Vijay P. Singh. 2017. “An Overview of Drought Monitoring and Prediction Systems at Regional and Global Scales.” Bulletin of the American Meteorological Society 98 (9): 1879–1896. doi:10.1175/BAMS-D-15-00149.1.
- Heim, Richard R. 2002. “A Review of Twentieth-century Drought Indices Used in the United States.” Bulletin of the American Meteorological Society 83 (8): 1149–1166. doi:10.1175/1520-0477-83.8.1149.
- Heim, Richard R., and Michael J. Brewer. 2012. “The Global Drought Monitor Portal: The Foundation for a Global Drought Information System.” Earth Interactions 16 (15): 1–28. doi:10.1175/2012EI000446.1.
- Hoek, Mattijn van. 2016. “Drought Monitoring from Space: A Focus on Indicators, Early Detection and Development of a Web-Based Integrated Portal.” PhD thesis, Chinese Academy of Sciences.
- Hoolst, Roel Van, Herman Eerens, Dominique Haesen, Antoine Royer, Lieven Bydekerke, Oscar Rojas, Yanyun Li, and Paul Racionzer. 2016. “FAO’s AVHRR-based Agricultural Stress Index System (ASIS) for Global Drought Monitoring.” International Journal of Remote Sensing 37 (2): 418–439. doi:10.1080/01431161.2015.1126378.
- Hu, Guangcheng, and Li Jia. 2015. “Monitoring of Evapotranspiration in a Semi-arid Inland River Basin by Combining Microwave and Optical Remote Sensing Observations.” Remote Sensing 7 (3): 3056–3087. doi:10.3390/rs70303056.
- Huang, Jin, Xin Chen, Yan Xue, Jie Lin, and Jinchi Zhang. 2017. “Changing Characteristics of Wet/Dry Spells During 1961–2008 in Sichuan Province, Southwest China.” Theoretical and Applied Climatology 127 (1): 129–141. doi:10.1007/s00704-015-1621-9.
- Huang, Jin, Shanlei Sun, Yan Xue, Jinjian Li, and Jinchi Zhang. 2014. “Spatial and Temporal Variability of Precipitation and Dryness/Wetness During 1961–2008 in Sichuan Province, West China.” Water Resources Management 28 (6): 1655–1670. doi:10.1007/s11269-014-0572-8.
- Huete, A., K. Didan, T. Miura, E. P. Rodriguez, X. Gao, and L. G. Ferreira. 2002. “Overview of the Radiometric and Biophysical Performance of the MODIS Vegetation Indices.” Remote Sensing of Environment, The Moderate Resolution Imaging Spectroradiometer (MODIS): A New Generation of Land Surface Monitoring 83 (1): 195–213. doi:10.1016/S0034-4257(02)00096-2.
- Huffman, George J., Robert F. Adler, David T. Bolvin, and Guojun Gu. 2009. “Improving the Global Precipitation Record: GPCP Version 2.1.” Geophysical Research Letters 36 (17). doi:10.1029/2009GL040000.
- Huffman, George J., David T. Bolvin, Eric J. Nelkin, David B. Wolff, Robert F. Adler, Guojun Gu, Yang Hong, Kenneth P. Bowman, and Erich F. Stocker. 2007. “The TRMM Multisatellite Precipitation Analysis (TMPA): Quasi-global, Multiyear, Combined-sensor Precipitation Estimates at Fine Scales.” Journal of Hydrometeorology 8 (1): 38–55. doi:10.1175/JHM560.1.
- Iglesias, Ana, Micha Werner, Rodrigo Maia, Luis Garrote, and Washington Nyabeze. 2014. “Implementing Drought Early Warning Systems: Policy Lessons and Future Needs.” EGU General Assembly 2014, held 27 April–2 May, 2014 in Vienna, Austria, 16: 16687. http://adsabs.harvard.edu/abs/2014EGUGA..1616687I.
- Jia, Li, Guangcheng Hu, Jie Zhou, and Massimo Menenti. 2012. “Assessing the Sensitivity of Two New Indicators of Vegetation Response to Water Availability for Drought Monitoring.” Land Surface Remote Sensing 8524: 85241A. International Society for Optics and Photonics. doi:10.1117/12.977416.
- Jin, Yufang, Crystal B. Schaaf, Curtis E. Woodcock, Feng Gao, Xiaowen Li, Alan H. Strahler, Wolfgang Lucht, and Shunlin Liang. 2003. “Consistency of MODIS Surface Bidirectional Reflectance Distribution Function and Albedo Retrievals: 2. Validation.” Journal of Geophysical Research: Atmospheres 108 (D5). doi:10.1029/2002JD002804.
- Jönsson, Per, and Lars Eklundh. 2004. “TIMESAT – a Program for Analyzing Time-series of Satellite Sensor Data.” Computers & Geosciences 30 (8): 833–845. doi:10.1016/j.cageo.2004.05.006.
- Kim, Do-Woo, Jae-Won Choi, Ji-Sun Lee, and Hi-Ryong Byun. 2010. “Impact of Climate Change on the East Asia Droughts.” Advances in Geosciences 16. Atmospheric Science (AS), May. doi:10.1142/9789812838100_0015.
- Kogan, F. N. 1995. “Application of Vegetation Index and Brightness Temperature for Drought Detection.” Advances in Space Research 15 (11): 91–100. doi:10.1016/0273-1177(95)00079-T.
- Lawrimore, Jay, Richard R. Heim, Mark Svoboda, Val Swail, and Phil J. Englehart. 2002. “Beginning a New Era of Drought Monitoring Across North America.” Bulletin of the American Meteorological Society 83 (8): 1191–1192. doi:10.1175/1520-0477-83.8.1191.
- Liu, J., X. Zhan, C. Hain, J. Yin, L. Fang, Z. Li, and L. Zhao. 2016. “NOAA Soil Moisture Operational Product System (SMOPS) and Its Validations.” IEEE International Geoscience and Remote Sensing Symposium (IGARSS), 3477–3480. doi:10.1109/IGARSS.2016.7729899.
- Lu, Jing, Li Jia, and Jie Zhou. 2015. “Characterization of 2014 Summer Drought over Henan Province Using Remotely Sensed Data.” International Conference on Intelligent Earth Observing and Applications, 980812. doi:10.1117/12.2207829.
- Minamiguchi, Naoki. 2005. “The Application of Geospatial and Disaster Information for Food Insecurity and Agricultural Drought Monitoring and Assessment by the FAO GIEWS and Asia FIVIMS.” Workshop on Reducing Food Insecurity Associated with Natural Disasters in Asia and the Pacific 27: 28.
- Mishra, Ashok K., and Vijay P. Singh. 2010. “A Review of Drought Concepts.” Journal of Hydrology 391 (1): 202–216. doi:10.1016/j.jhydrol.2010.07.012.
- Niemeyer, S., A. de Jager, B. Kurnik, G. Laguardia, D. Magni, O. Nitcheva, S. Rossi, and C. Weissteiner. 2009. “Current State of Development of the European Drought Observatory.” EGU General Assembly 2009, held 19–24 April, 2009 in Vienna, Austria, 11: 12802. http://adsabs.harvard.edu/abs/2009EGUGA..1112802N.
- Pozzi, Will, Justin Sheffield, Robert Stefanski, Douglas Cripe, Roger Pulwarty, Jürgen V. Vogt, Richard R. Heim, et al. 2013. “Toward Global Drought Early Warning Capability: Expanding International Cooperation for the Development of a Framework for Monitoring and Forecasting.” Bulletin of the American Meteorological Society 94 (6): 776–785. doi:10.1175/BAMS-D-11-00176.1.
- PROJ Contributors. 2018. PROJ Coordinate Transformation Software Library. Open Source Geospatial Foundation. https://proj4.org/.
- Sheffield, Justin, Eric F. Wood, Nathaniel Chaney, Kaiyu Guan, Sara Sadri, Xing Yuan, Luke Olang, et al. 2013. “A Drought Monitoring and Forecasting System for Sub-Sahara African Water Resources and Food Security.” Bulletin of the American Meteorological Society 95 (6): 861–882. doi:10.1175/BAMS-D-12-00124.1.
- Stephenson, Nathan. 1998. “Actual Evapotranspiration and Deficit: Biologically Meaningful Correlates of Vegetation Distribution Across Spatial Scales.” Journal of Biogeography 25 (5): 855–870. doi:10.1046/j.1365-2699.1998.00233.x.
- Svoboda, Mark, Doug LeComte, Mike Hayes, Richard Heim, Karin Gleason, Jim Angel, Brad Rippey, et al. 2002. “The Drought Monitor.” Bulletin of the American Meteorological Society 83 (8): 1181–1190. doi:10.1175/1520-0477-83.8.1181.
- Van Loon, A. F., K. Stahl, G. Di Baldassarre, J. Clark, S. Rangecroft, N. Wanders, T. Gleeson, et al. 2016. “Drought in a Human-modified World: Reframing Drought Definitions, Understanding, and Analysis Approaches.” Hydrology and Earth System Sciences 20 (9): 3631–3650. doi:10.5194/hess-20-3631-2016.
- Vatsavai, Ranga Raju, Shashi Shekhar, Thomas E. Burk, and Stephen Lime. 2006. “UMN-MapServer: A High-performance, Interoperable, and Open Source Web Mapping and Geo-Spatial Analysis System.” Proceedings of the 4th International Conference on Geographic Information Science, 400–417. Berlin: Springer-Verlag. GIScience’06. doi:10.1007/11863939_26.
- Verbesselt, Jan, Rob Hyndman, Glenn Newnham, and Darius Culvenor. 2010. “Detecting Trend and Seasonal Changes in Satellite Image Time Series.” Remote Sensing of Environment 114 (1): 106–115. doi:10.1016/j.rse.2009.08.014.
- Wan, Zhengming. 2008. “New Refinements and Validation of the MODIS Land-surface Temperature/Emissivity Products.” Remote Sensing of Environment 112 (1): 59–74. doi:10.1016/j.rse.2006.06.026.
- Wang, Xiaoyi, and Qian Zhang. 2012. “Climate Variability, Change of Land Use and Vulnerability in Pastoral Society: A Case from Inner Mongolia.” Text Summer 2012. doi:10.3167/np.2012.160107.
- Weiying, Chen, Xiao Qianguang, and Sheng Yongwei. 1994. “Application of the Anomaly Vegetation Index to Monitoring Heavy Drought in 1992.” Remote Sensing of Environment 9 (2): 106–112.
- Wilhite, Donald A. 2007. “Understanding the Complex Impacts of Drought: A Key to Enhancing Drought Mitigation and Preparedness.” Water Resources Management 21: 763–774. doi: 10.1007/s11269-006-9076-5
- Wilhite, Donald A., and Michael H. Glantz. 1985. “Understanding: The Drought Phenomenon: The Role of Definitions.” Water International 10 (3): 111–120. doi:10.1080/02508068508686328.
- Wilhite, Donald A., M. V. K. Sivakumar, and Deborah A. Wood. 2000. “Early Warning Systems for Drought Preparedness and Drought Management.” Proceedings of an Expert Group Meeting Held in Lisbon, Portugal. Vol. 57.