
 ?Mathematical formulae have been encoded as MathML and are displayed in this HTML version using MathJax in order to improve their display. Uncheck the box to turn MathJax off. This feature requires Javascript. Click on a formula to zoom.
ABSTRACT
Groundwater assists farmers to irrigate crops for fulfilling the crop-water requirement. Indian agriculture system is characterized by three cropping seasons known as Kharif (monsoon), Rabi (post-monsoon) and summer (pre-monsoon). In tropical countries like India, monitoring cropping practices using optical remote sensing during Kharif and Rabi seasons is constraint due to the cloud cover, which can be well addressed by microwave remote sensing. In the proposed research, the strength of C-band polarimetric Synthetic Aperture Radar (SAR) time series images were evaluated to classify groundwater irrigated croplands for the Kharif and Rabi cropping seasons of the year 2013. The present study was performed in the Berambadi experimental watershed of Kabini river basin, southern peninsular India. A total of fifteen polarimetric variables were estimated includes four backscattering coefficients (HH, HV, VH, VV) and eleven polarimetric indices for all Radarsat-2 SAR images. The cumulative temporal sum (seasonal and dual-season) of these parameters was supervised classified using Support Vector Machine (SVM) classifier with intensive ground observation samples. Classification results using the best equation (highest accuracy and kappa) shows that the Kharif, Rabi and irrigated double croplands are respectively 9.58 km2 (20.6%), 16.14 km2 (34.7%) and 6.22 km2 (13.4%) with a kappa coefficient respectively 0.84, 0.74 and 0.94.
1. Introduction
Groundwater is the world's largest distributed source of high-quality freshwater (Taylor et al. Citation2013). About 70% of this available freshwater is being used to cultivate approximately 18% agricultural croplands which provides 40% of global food production (Llamas and Martínez-Santos Citation2005; Thenkabail et al. Citation2008; Salmon et al. Citation2015; Ambika, Wardlow, and Mishra Citation2016; Sharma et al. Citation2018). The intensive use of groundwater for the irrigation purposed leads to freshwater scarcity in the form of quality and quantity (Agarwal et al. Citation2000; Fishman et al. Citation2011; Sriramulu et al. Citation2016). Overexploitation of the freshwater resources is becoming a big challenge for food security and it requires adaptation to changing climate conditions for better crop-water management (Lobell et al. Citation2008; Meiyappan et al. Citation2014; Wood et al. Citation2014; Feola et al. Citation2015; Ruiz et al. Citation2016; Ruiz and Sekhar Citation2016).
A significant portion of the Indian population depends on the agriculture for their livelihoods (Krishna Kumar et al. Citation2004; Roy et al. Citation2015). The variability and uncertainty of in Indian summer monsoon (Kharif season) rainfall (Krishna Kumar et al. Citation2004; Mishra et al. Citation2012; Paul et al. Citation2016) force farmers to use irrigation in order to protect their crops. As per the Ministry of Water Resources (MoWR) Government of India, per capita freshwater availability in 2012 has declined from 1545 m3 (Census 2001) to 1816 m3 (Census 2011) (Amarasinghe et al. Citation2004). The main cause of this declining of freshwater availability was due to the high demand in three prominent sectors, (i) irrigation purposes, (ii) domestic uses and (iii) industrial purposes. Hence to secure water-food-energy and to sustain in diverse climatic conditions, suitable agriculture policy is the need of the hour (Barik et al. Citation2016).
Microwave remote sensing is a potential alternative to optical remote sensing for land surface monitoring. The synthetic aperture radar (SAR) images are widely used for the monitoring of agricultural land, natural vegetation, surface soil moisture, surface soil roughness, irrigation, lineament detection, flood, and surface water monitoring (Ulaby, Bradley, and Dobson Citation1979; Brisco et al. Citation2008; Corgne et al. Citation2010; Fieuzal et al. Citation2011; Kornelsen and Coulibaly Citation2013; Tomer et al. Citation2015; Baghdadi and Zribi Citation2016; Betbeder et al. Citation2016; Bargiel Citation2017; Steele-Dunne et al. Citation2017). In tropical countries like India, monitoring cropping practices using optical remote sensing during Kharif and Rabi seasons is constraint due to the cloud cover, which can be well addressed by microwave remote sensing. Time series images of C-band SAR quad-polarimetric backscattering coefficients and polarimetric ratios are sensitive to temporal changes of agricultural practices (Susan Moran et al. Citation2012; Yonezawa et al. Citation2012; Jiao et al. Citation2014; Sharma et al. Citation2016; Canisius et al. Citation2018). Polarimetric parameters can be divided broadly into two sections of absolute and relative parameters (Kim et al. Citation2014). The backscattering coefficients and eigenvalues are the part of absolute polarimetric parameters, and polarimetric indices are part of relevant polarimetric parameters (Kim et al. Citation2014; Bhattacharya et al. Citation2015; Surendar et al. Citation2015; Kiran and Anjaneyulu Citation2016; Shukla et al. Citation2018). SAR signals are highly sensitive to the vegetation water content (VWC), vegetation structure, surface soil moisture and surface soil roughness (Blaes, Vanhalle, and Defourny Citation2005; Baup et al. Citation2007; Gherboudj et al. Citation2011; Baghdadi et al. Citation2012; Zribi et al. Citation2013; Kim et al. Citation2014; Baghdadi et al. Citation2015; Das and Paul Citation2015; Gorrab et al. Citation2015; Tomer et al. Citation2015; Di Martino et al. Citation2016; Sharma et al. Citation2016; El Hajj et al. Citation2018; Zhao et al. Citation2018). The polarimetric indices formed with various combinations of polarization (HH, HV, VH, VV) can discriminate land use and land cover phenology (Blaes, Vanhalle, and Defourny Citation2005; Torbick et al. Citation2017; Yusoff et al. Citation2017).
Machine learning is an alternative approach for the satellite image classification to assists agronomy, forestry, hydrology, climatology, and other LULC studies. The remote sensing community widely adopts the SVM classifier due to its robustness and high accuracy classification outputs (Guidici and Clark Citation2017). Support vector machine (SVM) classifier is well known for the ability to classify various land use and land cover types with a limited number of training samples and being used widely by the researchers (Lardeux et al. Citation2009; Mountrakis, Im, and Ogole Citation2011; Pedregosa, Weiss, and Brucher Citation2011; Maghsoudi, Collins, and Leckie Citation2013; Sharma et al. Citation2016). SVM classifier is well applied for the SAR polarimetric images with limited but precise training data (Lardeux et al. Citation2009; Mountrakis, Im, and Ogole Citation2011). Being a non-parametric classifier SVM is more effective for noise reduction from the images, it is appropriate for nonlinear and/or empirical mixture modeling (Mountrakis, Im, and Ogole Citation2011).
In the present study, in which only groundwater irrigation is considered, irrigated croplands for two concurrent cropping seasons (Kharif and Rabi) are classified using polarimetric Radarsat-2 time series images. The twenty-four days interval Radarsat-2 images for both cropping seasons were analyzed using SVM classifier with precise training samples collected from the field. It was observed that irrigated double croplands could be well classified using Radarsat-2 time series images.
2. Materials and methods
2.1. Study area
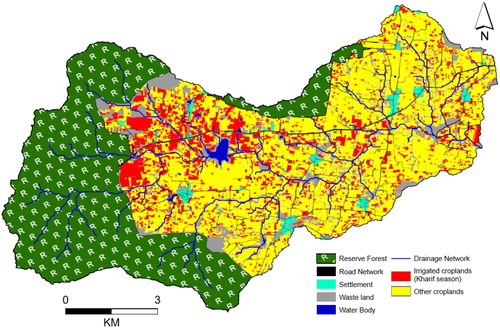
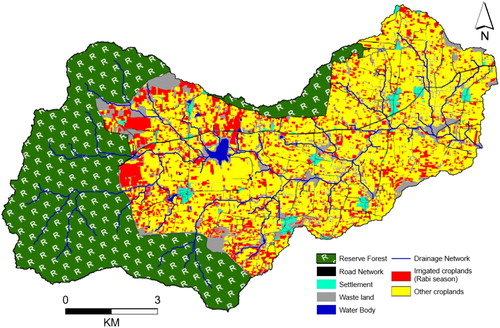
The study was carried out at Berambadi watershed (area = 89 km2) is a part of Kabini river basin in South India () (Sekhar and Ruiz Citation2010; Ruiz et al. Citation2016). The Berambadi watershed is well equipped with real-time ground-based equipments such as weather stations, flux tower, hydra-probes (soil moisture monitoring at various soil depths), COSMOS (COsmic-ray Soil Moisture Observing System), and rain gauges (Tomer et al. Citation2015; Barik et al. Citation2016; Eswar, Sekhar, and Bhattacharya Citation2016; Sekhar et al. Citation2016). Berambadi watershed is also a calibration site for various satellite missions like Radarsat-2 (Tomer et al. Citation2015), SMOS (Tomer et al. Citation2016) and RISAT-1 under the ongoing project called Assimilation of Multi-satellite at a Berambadi watershed for Hydrology And land Surface experiments (AMBHAS) (Mangiarotti et al. Citation2016; Sekhar et al. Citation2016; Tomer et al. Citation2016; Sharma et al. Citation2018). The watershed lies in the tropical sub-humid climate zone with 800 mm annual rainfall and 1100 mm annual PET (potential evapotranspiration) (Sekhar et al. Citation2011; Eswar, Sekhar, and Bhattacharya Citation2016). The rainfall in the watershed shows high inter-annual variability (Sekhar et al. Citation2011; Subash et al. Citation2018). Southwest (SW) and Northeast (NE) monsoon seasons are assisting farmers to grow non-irrigated crops during respectively Kharif and Rabi cropping seasons. Groundwater irrigation is fulfilling the crop water requirement partially or fully for the irrigated crops (Robert et al. Citation2017; Sriramulu et al. Citation2017; Sharma et al. Citation2018).
Figure 1. Study area and ground observation locations.
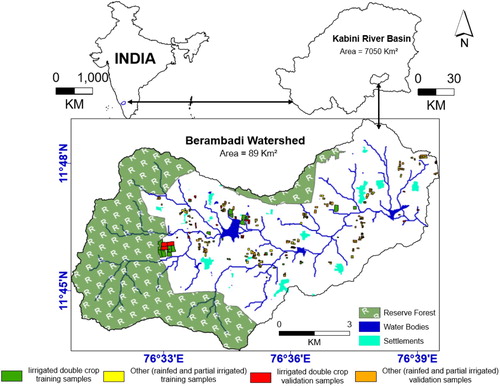
The Berambadi watershed is having three main cropping seasons, known as monsoon (Kharif), post-monsoon (Rabi) and summer (pre-monsoon) season. The main land use and land cover in the watershed include agricultural cropland (52%), reserve forest (35%), and other land use and land cover categories (13%) viz., wastelands, water bodies, settlements and road networks. According to local cropping practices, Kharif cropping season starts in mid-May and ends in mid-September, Rabi season begins in mid-September and ends in mid-January and summer season starts in mid-January and ends in mid-May. In Kharif cropping season major crops are non-irrigated like sunflower, maize, marigold, sorghum, finger millet, and country beans. In the absence of rainfall, farmers with groundwater irrigation facility are partially irrigating crops as based on the groundwater availability. Cash crops like turmeric, onion, beetroot, chili, sugarcane, and banana are irrigated crops of the Kharif season (Mangiarotti et al. Citation2018). Onion and beetroot crops are of the three-month life cycle, turmeric and chili are of eight-month and banana, and sugarcane are of twelve-month cropping duration. Farmers are deciding the crops to be cultivated in the Kharif season based on groundwater status and the onset of monsoon. Rabi cropping season also has non-irrigated and irrigated crops. The major non-irrigated crops cultivate during NE monsoon are chickpea, maize, horse gram, groundnut, and country beans. During the Rabi season also, in the absence of rainfall, farmers with groundwater irrigation facility partially irrigating the crops based on the groundwater availability.
Crops like solar beans, garlic, tomato, beetroot, cabbage, turmeric, sugarcane, and banana need irrigation. Summer cropping season comprises of 100% irrigated cash crops. The major summer crops in the watershed are cabbage, beetroot, onion, vegetables, watermelon, sugarcane, and banana (Sharma et al. Citation2018). In Berambadi watershed groundwater is the only source of irrigation, due to unavailability of canals and restriction to pump water from the water bodies (tanks). The dug wells and open wells almost disappear in the Berambadi watershed due to the groundwater level is approx. 30 m from the surface (Sekhar et al. Citation2016). Farmers are using drip, sprinkler, or furrow irrigation techniques based on the individual financial condition, availability of borewells, groundwater yield and the support from the government.
The soil type for the Berambadi watershed was classified in seven broad categories at 1:50 k scale by the national bureau of soil survey and land use planning (NBSS-LUP). The main soil type (soil texture) comprises clay, clay loam, sandy clay, sandy clay loam, loamy sand, and sandy loam (Tomer et al. Citation2015; Sreelash et al. Citation2017).
2.2. Satellite images
Radarsat-2 is an active SAR (synthetic aperture radar) microwave satellite with a payload of C-band (frequency = 5.4 GHz) (MacDonald Dettwiler and Associates Ltd. Citation2014). Nine Radarsat-2 satellite quad pol (HH, HV, VH, VV) images at fine-quad (FQ6) mode were acquired for the period from June 2013 to December 2013 (). The quad pol images consist of four polarization combinations (quad pol) includes horizontal transmission & horizontal receiving (HH pol), horizontal transmission & vertical receiving (HV pol), vertical transmission & vertical receiving (VV pol) and vertical transmission & horizontal receiving (VH pol). The low incidence angle (∼25°) with 5.3 GHz frequency antenna (C-band SAR) is one of the ideal conditions to estimate surface soil moisture (Zribi et al. Citation2014; Tomer et al. Citation2015). Low incidence angle has the least attenuation with the crop canopy, and the backscattering coefficient is mainly representing the surface soil humidity (Ulaby Citation1975; Srivastava et al. Citation2009). The ground and azimuth resolutions for all acquired images were respectively 10.9 and 4.7 m. More characteristics of the satellite images were presented in .
Table 1. Characteristics and dates of acquired Radarsat-2 satellite images.
2.3. Ground data
A ground survey was carried out during Kharif and Rabi cropping seasons to collect field data. A total of 301 samples were collected which include 74 samples for irrigated croplands and 227 samples for others category includes rainfed or partially irrigate fields (). Ground control campaign was conducted for the Kharif and Rabi cropping seasons on the day of Radarsat-2 satellite passes. The intensively irrigated parcels represent long duration (eight months or more) irrigated crops (viz. banana, sugarcane, turmeric, and plantations) or irrigated crops during two consecutive cropping seasons for the Kharif and Rabi (viz. beetroot, cabbage, garlic, onion, watermelon, etc.). The other cropland includes either partially irrigated in the absence of rainfall or cultivation under only in rainfed condition for both cropping seasons. The summer cropping season is not included in the analysis due to non-availability of Radarsat-2 dataset. The data collected on crop type, irrigation type (drip, sprinkler or furrow) and groundwater level measurement for the better understanding the cropping practices in the watershed. The randomly selected calibration and validation samples of irrigated and other croplands were presented in four categories ():
irrigated double crop training samples (groundwater irrigated cropland samples (performed irrigation in Kharif and Rabi cropping seasons) used to train SVM classifier),
other (rainfed and partial irrigated) training samples (the rainfed in both cropping seasons or partial irrigated cropland samples (performed irrigation activity in the absence of rainfall according to groundwater availability) used to train SVM classifier),
irrigated double crop validation samples (groundwater irrigated cropland samples (performed irrigation in Kharif and Rabi cropping seasons) used for the validation of SVM classified output and,
other (rainfed and partial irrigated) validation samples (the rainfed in both cropping seasons or partial irrigated cropland samples (performed irrigation activity in the absence of rainfall according to groundwater availability) used for the validation of SVM classified output).
Agricultural parcels of the Berambadi watershed were manually digitized using google earth image of the year 2012 and updated using 1.5 m spatial resolution SPOT-6 (Satellite Pour l’Observation de la Terre) satellite image (Sharma et al. Citation2018). Total 18,500 agricultural parcels were identified in the Berambadi watershed out of the total approximately 19,600 parcels. It was noticed that the majority of agricultural parcels were of approximately 0.2 ha area.
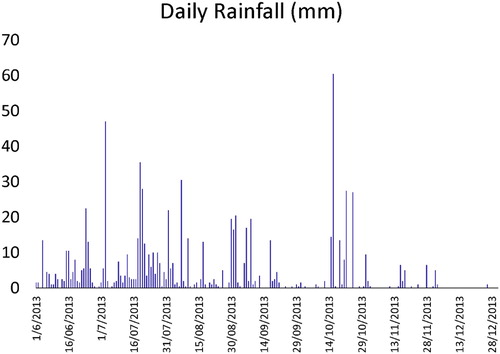
Berambadi watershed is having a high number of rainy days during southwest monsoon (Kharif cropping season) compare to the northeast monsoon (Rabi cropping season) (). The daily rainfall data was observed during the Radarsat-2 satellite data acquisition period. In the year 2013, total rainfall during Kharif and Rabi cropping seasons were respectively 602.5 and 227.5 mm.
Figure 2. Daily rainfall of the Berambadi watershed for Radarsat-2 pass duration.
2.4. Image pre-processing
Image pre-processing consists of radiometric calibration, speckle filtering and geometric correction (Battude et al. Citation2014). The radiometric calibration was done for all Radarsat-2 images to extract backscattering coefficients σ◦HH, σ◦HV, σ◦VH and σ◦VV (Betbeder et al. Citation2014) according to the equation (a) and (b).(a)
(a) where Ks represents to the calibration constant, DN is the digital number of each pixel (the amplitude of backscattering signal), NEBN is represented to the noise equivalent beta naught, and θ is the incidence angle to the surface. The backscattering coefficient for all four (HH, HV, VH, VV) was estimated in decibels (dB) using equation b.
(b)
(b)
The Lee sigma speckle filter (Lee Citation1983; Lee et al. Citation2009; Duguay et al. Citation2016) with 4 look intensity, 5 × 5 window size, sigma = 0.9, and target window 3 × 3 was used to reduce speckle noise. The improved Lee sigma speckle filter's characteristics were quantitatively evaluated and validated with SAR images (Lee et al. Citation2009).
All SAR images were geocoded using 3 s SRTM (shuttle radar topographic mission) DEM (digital elevation model). After geocoding all SAR images were geometrically corrected with ground survey locations with UTM (Universal Transverse Mercator) projection and 43rd Zone of North hemisphere.
2.5. Image processing
2.5.1. Polarimetric parameters estimation
On the basis of the current state of the art, total 11 polarization indices (PI's) using polarimetric backscattering coefficients (σ◦HH, σ◦HV, σ◦VH, and σ◦VV) and individually all four backscattering coefficients (σ◦HH, σ◦HV, σ◦VH, and σ◦VV) () were calculated for all nine Radarsat-2 images acquisition dates () during Kharif and Rabi cropping seasons. These PI's are representing various combinations of polarimetric backscatter coefficients.
Figure 3. Image processing workflow.
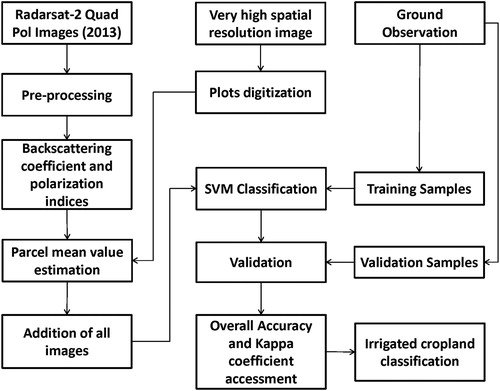
The parcels mean values of various polarimetric indices and backscattering coefficients were calculated using digitized agricultural parcel boundaries for all nine acquisition dates (9 dates * 15 indices = 145 outputs). To classify groundwater irrigated double croplands the parcel scale cumulative sums output (1) were calculated from the time series images (during Kharif and Rabi cropping seasons). This double cropping season cumulative sum was estimated for all four backscattering coefficients and eleven polarimetric indices (1–15).
(1)
(1)
Equations (1) till (4) are representing the polarimetric backscattering coefficients and the (1) till (15) are representing the various polarization indices.
The proposed cumulative backscattering coefficients and polarization indices are:(2)
(2)
(3)
(3)
(4)
(4)
(5)
(5)
(6)
(6)
(7)
(7)
(8)
(8)
(9)
(9)
(10)
(10)
(11)
(11)
(12)
(12)
(13)
(13)
(14)
(14)
(15)
(15)
Backscattering coefficients (1–4) were used for the soil moisture and crop classification (Susan Moran et al. Citation2012; Betbeder et al. Citation2014; Yusoff et al. Citation2017; Canisius et al. Citation2018). The co-polarized correlation coefficient (ρvvhh) represents the correlation between co-polarized channels like HH and VV. (7) (Betbeder et al. Citation2014), (8) (Canisius et al. Citation2018), (10) (Susan Moran et al. Citation2012), (12) (Haldar et al. Citation2016) and (15) (Gherboudj et al. Citation2011) are computed with co-polarized backscattering coefficients for various crops and soil moisture studies. De-polarization () (9) calculated using VH and VV backscaterring coefficients (F T Ulaby, Dobson, and Brunfeldt Citation1983; Gherboudj et al. Citation2011) which is used for agro-hydrological applications and to calibrate water-cloud model (Gherboudj et al. Citation2011). The cross-polarized indices like (5) and (6) (Canisius et al. Citation2018), (11) and (14) (Kim et al. Citation2012; Canisius et al. Citation2018) and (13) (Haldar et al. Citation2016) have also been used widely to understand the crop phenology and the surface soil moisture.
2.5.2. SVM classification
A Support Vector Machine (SVM) is a supervised non-parametric discriminative statistical learning classifier (Li, Jiao, and Hao Citation2007). SVM classifier performs supervised classification, in which SVM discriminates training samples with multidimensional hyperplanes in the feature space (Mavroforakis and Theodoridis Citation2006). The scikit-learn library (Pedregosa, Weiss, and Brucher Citation2011) was used to perform SVM supervised classification. Out of total 301 ground observed samples, randomly selected 50% samples were used for the training (supervised learning) and remaining 50% samples used for the validation of classified output.
2.5.3. Classification validation and accuracy assessment
The individual cumulative sum for all 15 polarimetric indices were fed to the SVM classifier with intense ground observed training samples and followed with validation of SVM classification outputs by remaining ground observed samples (). The validation of classification outputs was performed by confusion matrix, user's accuracy, producer's accuracy, overall accuracy and kappa coefficients estimation (Olofsson et al. Citation2013; Gumma et al. Citation2016; Yan and Roy Citation2016). The polarimetric parameter with highest classification accuracy and kappa coefficient for the irrigated double crop classification is further used to classify seasonally (Kharif and Rabi individually) irrigated croplands.
3. Results
Irrigated double cropland for the Kharif and Rabi cropping seasons were classified using SVM classifier. Total fifteen classified outputs were generated using indices mentioned above (four backscattering coefficients and eleven polarization indices). These classified outputs were representing parcels which were under irrigation for the two consecutive cropping seasons (Kharif and Rabi seasons). These classified irrigated cropland outputs were calibrated and validated using respectively 149, and 152 ground observed sampling parcels. The classified outputs were validated by calculating producer's accuracy, user's accuracy, overall classification accuracy and kappa coefficient with the confusion matrix () (Foody et al. Citation2006; Gumma et al. Citation2016). The SVM classification calibration and validation were performed at pixel scale (5 m spatial resolution), and the confusion matrix was generated in percentage (Hill et al. Citation2005; Gao et al. Citation2018).
Table 2. The table presents confusion matrix, user's accuracy, producer's accuracy, overall classification accuracy (OA), and the kappa coefficient for all SVM classified outputs from various polarization indices. Where a and b represent respectively irrigated double-croplands (irrigated in Kharif and Rabi cropping seasons) and other (partial groundwater irrigation during or rainfed) croplands.
Validation of the classification output was performed by dividing samples into two categories known as:
irrigated double crop (irrigated parcels during both Kharif and Rabi cropping seasons) and
the other croplands (rainfed croplands during both Kharif and Rabi cropping seasons and partial irrigation in the absence of rainfall according to the groundwater availability).
Out of fifteen classified outputs from the above mention equations for irrigated double crop classification, five classified outputs (1, 3, 8, 12, and 15) has a zero kappa coefficient and 62.6% classification accuracy. These five classifications outputs were able to classify other croplands precisely but not able to classify irrigated double crop. The precise classification of other croplands and not able to classify irrigated double crop satisfies the validation for only one category. For these (five equations 1, 3, 8, 12, and 15) classified outputs the precise classification of the other cropland category bags the classification accuracy of 62.6%, but the irrigated double croplands were not classified precisely in these outputs, which makes kappa accuracy 0%.
The kappa classification accuracy for the six classified outputs (5, 6, 7, 11, 13, and 14) were less than 70%, and for two classification outputs (2 and 4) the kappa classification accuracies were more than 70% but less than 80%. Only (9) and (10) classified the irrigated double crop and other croplands precisely with a kappa classification accuracy respectively 93.9% (OA = 97.2%) and 93.3% (OA = 96.9%) (). The errors of omission (producer's accuracy) and errors of commission (user's accuracy) for highest kappa classification accuracy output (9) were respectively for the irrigated double crop 0.94 and 0.98, whereas for other croplands respectively 0.99% and 0.97% were estimated (Lunetta et al. Citation2006; Thenkabail et al. Citation2008; Dheeravath et al. Citation2010; Du et al. Citation2013; Yan and Roy Citation2014) were also respectively highest for the (9) and (10).
3.1. Irrigated double cropland classification
The dual season (Kharif and Rabi cropping seasons) irrigated cropland is classified using equation with the highest kappa coefficient and overall classification accuracy (). The (9) represents the cumulative sum of the difference between VH and VV backscattering coefficients. The proposed research shows that the dual season cumulative sum from (9) (subtraction between cross-polarized backscattering coefficient and co-polarised backscattering coefficient) is performing irrigated double cropland classification with the highest overall classification accuracy and kappa coefficient. Total area estimated using (9) under dual season (Kharif and Rabi cropping seasons) irrigation is 6.22 km2 and this irrigated double cropland area is 13.4% of the total cropland area in Berambadi watershed.
Figure 4. Spatial distribution of dual-irrigation in the Berambadi watershed in 2013. The other croplands are partially groundwater irrigated in the absence of rainfall or grown under only rainfed condition.
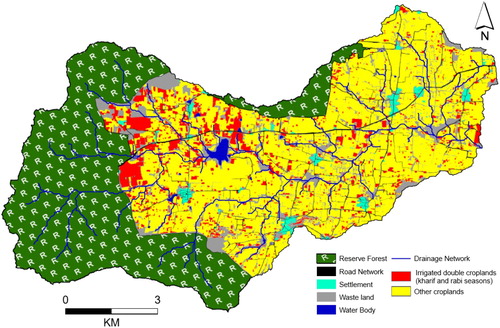
The overall classification accuracy and kappa coefficient for the classification output using (9) are respectively 97.2% and 0.94 (). The user's accuracy and producer's accuracy for the irrigated double cropland (a) estimated respectively 0.98 and 0.94 (). For the other croplands (b) user's accuracy and producer's accuracy were estimated respectively 0.97 and 0.99. The (9) bags the highest overall classification accuracy, kappa coefficient, user accuracy, and producer accuracy, with highest diagonal value (97.3%) ().
Table 3. Total irrigated area and classification accuracy for the dual-irrigation practices in the Berambadi watershed. Where a and b are representing respectively irrigated croplands and other (rainfed and fallow) croplands.
3.2. Kharif cropping season irrigated cropland classification
The spatial distribution of irrigated croplands in the Berambadi watershed for the kharif cropping season is presented in . As the (9) bags the highest overall classification accuracy, kappa coefficient, user accuracy and producer accuracy for the irrigated double cropland identification, the same equation is used to classify Kharif season irrigated cropland. The cumulative sum of (9) outcomes for the all Kharif season four Radarsat-2 SAR images () was performed SVM classification with the same training and validation samples () to generate classification output and the accuracy assessment. It was noticed from the classification output () that the high concentration of the Kharif season irrigated cropland is in the North-West (NW) region of the watershed. The NW region of the watershed is in the upstream which is between reserve forest and the biggest waterbody of the Berambadi watershed.
Figure 5. Spatial distribution of Kharif cropping season irrigated croplands. The other croplands are partially groundwater irrigated in the absence of rainfall or grown under only rainfed condition.
The total irrigation area under Kharif cropping season is 10.1 km2 and approximately 21.7% area of the total cropland. The overall classification accuracy and kappa coefficient for the Kharif irrigated cropland classification are respectively 91.4% and 0.82 (). The user's accuracy and producer's accuracy for the Kharif season irrigated cropland (a) estimated respectively 0.85 and 0.94 (). For the other croplands (b) user's accuracy and producer's accuracy were estimated respectively 0.96 and 0.9.
Table 4. Total irrigated area and classification accuracy for the Kharif cropping season. Where a and b are representing respectively irrigated croplands and other (rainfed and fallow) croplands.
3.3. Rabi cropping season irrigated cropland classification
The Rabi cropping season spatial distribution of irrigated croplands in the Berambadi watershed is presented in . As the (9) bags the highest overall classification accuracy, kappa coefficient, user accuracy and producer accuracy for the irrigated double cropland identification. The same equation is used to classify Rabi season irrigated cropland classification. The cumulative sum of (9) outcomes for the all Rabi season five Radarsat-2 SAR images () was undergone with SVM classification with the same training and validation samples () to generate classification output and the accuracy assessment. The Rabi cropping season irrigated cropland is spread in all parts of the Berambadi watershed (). The NW, and the west region of the watershed is in the upstream of the Berambadi watershed are respectively having big irrigated parcels.
Figure 6. Spatial distribution of Rabi cropping season irrigated croplands. The other croplands are partially groundwater irrigated in the absence of rainfall or grown under only rainfed condition.
The total area under Rabi season irrigation is 10.5 km2 and approx. 22.6% area of the total cropland in the watershed. The overall classification accuracy and kappa coefficient for the Rabi irrigated cropland classification are respectively 90.4% and 0.79 (). The user's accuracy and producer's accuracy for the Rabi season irrigated cropland (a) estimated respectively 0.88 and 0.86 (). Rabi season other croplands (b) user's accuracy and producer's accuracy were estimated respectively 0.92 and 0.94.
Table 5. Total irrigated area and classification accuracy for the Rabi cropping season.
4. Discussion
In this study, the main objective was to evaluate the strength of C-band polarimetric SAR time series images to identify groundwater irrigated croplands. For that purpose, we classified polarimetric indices and backscattering coefficients calculated from Radarsat-2 quad-pol SAR images using SVM classifier.
4.1. Advantages of Radarsat-2 quad pol SAR images for mapping irrigated cropland
The Berambadi watershed is mostly covered with clouds during Kharif and Rabi cropping seasons; the microwave remote sensing is the only available solution to map the spatial distribution of irrigated croplands in the watershed (Mangiarotti et al. Citation2018). Microwaves remote sensing uses respectively longer wavelengths (2.7 mm to 1.2 m) than optical wavelengths (0.435–12.5 µm) (https://landsat.usgs.gov/what-are-band-designations-landsat-satellites) which are not sensitive to atmospheric conditions (clouds, aerosols, etc.) (Ouchi Citation2013; Hosseini et al. Citation2015; Karthikeyan et al. Citation2017). The Sentinel-1 is also a C-band SAR satellite with 12 days interval freely available data products (https://sentinel.esa.int/web/sentinel/user-guides/sentinel-1-sar). Due to two main reasons, the Radarsat-2 data was used for the present study, (i) the unavailability of Sentinel-1 satellite images during the study period and (ii) Radarsat-2 is a quad pol satellite whereas Sentinel-1satellite is dual-pol (Engelbrecht et al. Citation2017). Nevertheless, the study can be extended using freely available Sentinel-1 timeseries images for all three cropping seasons (Kharif, Rabi, and summer) and intra-annual analysis.
4.2. Selection of the polarimetric indices and backscattering coefficients for irrigated cropland mapping
The use of single polarimetric backscattering coefficient for crop monitoring or irrigated cropland monitoring is quite limited (Blaes et al. Citation2006). Radarsat-2 satellite products are comprising of four polarizations, which assists for multiple polarimetric combinations or polarimetric indices (Yang et al. Citation2017). The widely recognized polarimetric backscattering coefficients and polarimetric indices for crop and soil parameters monitoring were reviewed and implemented to identify seasonal irrigated croplands (Yonezawa et al. Citation2012; Li and Lampropoulos Citation2016). The best index (9) to identify dual cropping season groundwater irrigated croplands is identified with the highest overall classification accuracy (97.2%) and kappa coefficient (0.94). The same equation (9) is further implemented to classify Kharif and Rabi cropping season groundwater irrigated croplands. For the Kharif cropping season, the overall classification accuracy and kappa coefficients were respectively 91.4% and 0.82. Whereas for the Rabi cropping season the overall classification accuracy and kappa coefficients were respectively 90.4% and 0.79.
The study can further extend to monitor partially irrigated croplands and individual crops using Radarsat-2 quad pol SAR polarimetric decomposition and hybrid decomposition algorithms (Hajnsek et al. Citation2009; Jagdhuber et al. Citation2013; Jagdhuber, Hajnsek, and Papathanassiou Citation2015; Wang, Magagi, and Goïta Citation2018). The best informative variable can be identified using Principal Component Analysis (PCA), Analysis of Covariance (ANCOVA) or Random Forest (RF) tree algorithms.
4.3. Selection of the image classifier
The proposed study used SVM machine learning classifier to identify irrigated croplands. The Guidici et al. (Guidici and Clark Citation2017) study presented relative study to classify land cover classification using two machine learning classifiers (RF and SVM) and one deep learning classifier (Convolution Neural Network) and it was noticed that that SVM and CNN classifiers are performing reasonably higher with kappa classification accuracy 88%. The present study at Berambadi watershed can further extend to monitor partially irrigated croplands and individual crops using other machine learning or deep learning algorithms like RF classifiers (Ma et al. Citation2017), Convolution Neural Network (CNN) (Maggiori et al. Citation2017; Zhang Citation2018), chaos global modeling (Mangiarotti et al. Citation2018), sub-pixel analysis (Jain et al. Citation2013), etc. The improved irrigated cropland classification algorithm can further assist to monitor the cropping system in small size parcel with different cropping management practices characterized watersheds.
4.4. Methodological considerations and study area complexity
In the Berambadi watershed majority of farmers are fully dependent on Kharif and Rabi cropping seasons. Farmers with borewell facility and good borewell yield are cultivating crops which require long term irrigation (e.g. turmeric, banana and sugarcane). Others are growing short duration irrigated cash crops (e.g. onion, garlic, beetroot, etc.) or non-irrigated crops (e.g. marigold, sunflower, maize, etc.). Very few farmers with good groundwater yield are growing water-intensive long duration crops (e.g. banana and sugarcane).
The spatial distribution of intensive groundwater irrigation in the Berambadi watershed (Sekhar et al. Citation2016) for the two main cropping season can be identified from the present study. The classified irrigated double croplands are majorly occupying with turmeric, sugarcane, banana, dual-season irrigated vegetables (e.g. onion, garlic, beetroot, chili, tomato, etc.), and the plantations. In the Berambadi watershed, the groundwater is recharging from the rainfall during SW and NE monsoons and declining after the Rabi cropping season (Maréchal et al. Citation2010). After recharging during SW and NE monsoons, groundwater table becomes shallow from the mid of Kharif season till the end of the Rabi cropping season. With the high possibility to supply water through borewells during these two cropping seasons enables the farmers to irrigate their crops which are comparably not possible during the summer season. Only farmers with multiple borewell facilities and shallow groundwater level are adapting long duration annual crops (Sharma et al. Citation2018). The depth of the groundwater from the surface in the watershed for the year 2013 was approximately between 15 and 30 m (Sekhar et al. Citation2016).
In the year 2010, the World Bank has notified that in India approximately 36% (581*103 km2) of the total agricultural croplands (160 * 104 km2) are reliably irrigating. In the Karnataka state, the total groundwater irrigated area is approx. 10% (https://en.wikipedia.org/wiki/Irrigation_in_India). The proposed study shows that the dual cropping season groundwater irrigated croplands are approx. 13.4%, and for the individual Kharif and Rabi cropping season total irrigated areas are respectively 21.7% and 22.6%. The study can extend for the summer cropping season irrigated cropland monitoring.
Excessive use of groundwater in the downstream areas of the watershed, the upstream of the watershed has shallow groundwater level with a comparison to the downstream (Sriramulu et al. Citation2016; Sharma et al. Citation2018). Moreover, the downstream groundwater is highly contaminated with a high amount of nitrate (Sriramulu et al. Citation2016). As the groundwater table become shallow in the upstream, farmers are started growing long duration irrigated crops. The situation can further lead to groundwater depletion and contamination in the upstream region too. The methodology used in this study could be applied at regional or national scales using freely available Sentinel-1 datasets for seasonal or annual irrigated cropland monitoring.
5. Conclusion
Our study demonstrated the potential of using time series of Radarsat-2 quad-pol data to identify irrigated croplands in the context of south India. This constitutes an important advance, as Kharif and Rabi cropping seasons are very difficult to monitor with optical satellite imagery due to quasi-permanent cloud cover during the South West and North East monsoon. The SVM classifier has been proved to be a potential candidate in order to classify irrigated double crop with 97.2% overall classification and 93.9% kappa classification accuracies. The result shows 13.4% croplands are cultivating irrigated double crops with intensive groundwater irrigation. However, due to the small parcel size (less than 0.5 ha), the high diversity of crop types and crop management practices in the watershed, crop classification remains a challenging task.
The study brought out the uneven spatial distribution of irrigated double crop areas in the watershed. It is an important input for understanding the interactions between groundwater dynamics and cropping systems. This information retrieved will be crucial for constraining groundwater models such as the one being used in the Berambadi watershed, which will allow recommending suitable practices that need to be adopted by the farmers to ensure the sustainability of their farming systems. Indeed, socio-economic sustainability and food security of this region depends on the judicious use of the groundwater and planning the cropping sequence with optimal utilization of groundwater resources in critical to reaching this goal.
Acknowledgments
Authors would like to thank IISc-Bengaluru and LETG-Rennes for facilitating the research. Authors also would like to thank farmers of the Berambadi watershed for their kind cooperation. Authors also thank the anonymous reviewers for constructive comments and suggestions.
Disclosure statement
No potential conflict of interest was reported by the authors.
ORCID
Amit Kumar Sharma http://orcid.org/0000-0001-6964-999X
Additional information
Funding
References
- Agarwal, Anil, Ramesh Bhatia, Marian S. delos Angeles, Ivan Chéret, Sonia Davila-Poblete, Malin Falkenmark, Fernando Gonzalez Villarreal, Torkil Jønch-Clausen, et al. 2000. Integrated Water Resources Management. Stockholm: Global Water Partnership.
- Amarasinghe, Upali, Bharat R Sharma, Noel Aloysius, Christopher Scott, Vladimir Smakhtin, and Charlotte De Fraiture. 2004. “Spatial Variation in Water Supply and Demand across River Basins of India.” Water. doi:10.3910/2009.084.
- Ambika, A. K., B. Wardlow, and V. Mishra. 2016. “Data Descriptor: Remotely Sensed High Resolution Irrigated Area Mapping in India for 2000 to 2015.” Scientific Data 3 (160118): 1–14. doi:10.1038/sdata.2016.118.
- Baghdadi, N., R. Cresson, M. El Hajj, R. Ludwig, and I. La Jeunesse. 2012. “Estimation of Soil Parameters over Bare Agriculture Areas from C-Band Polarimetric SAR Data Using Neural Networks.” Hydrology and Earth System Sciences 16 (6): 1607–1621. doi:10.5194/hess-16-1607-2012.
- Baghdadi, Nicolas, and Mehrez Zribi. 2016. “Characterization of Soil Surface Properties Using Radar Remote Sensing.” Land Surface Remote Sensing in Continental Hydrology, 1–39. doi:10.1016/B978-1-78548-104-8.50001-2.
- Baghdadi, Nicolas, Mehrez Zribi, Simonetta Paloscia, Niko Verhoest, Hans Lievens, Frederic Baup, and Francesco Mattia. 2015. “Semi-Empirical Calibration of the Integral Equation Model for Co-Polarized L-Band Backscattering.” Remote Sensing 7 (10): 13626–13640. doi:10.3390/rs71013626.
- Bargiel, Damian. 2017. “A New Method for Crop Classification Combining Time Series of Radar Images and Crop Phenology Information.” Remote Sensing of Environment 198: 369–383. doi:10.1016/j.rse.2017.06.022.
- Barik, Beas, Subimal Ghosh, A. Saheer Sahana, Amey Pathak, Muddu Sekhar, A. Saheer Sahana, Amey Pathak, and Muddu Sekhar. 2016. “Water Food Energy Nexus: Changing Scenarios in India during Recent Decades.” Hydrology and Earth System Sciences Discussions 21 (December): 1–30. doi:10.5194/hess-2016-647.
- Battude, M., D. Morin, S. Laurence, S. Valero, C. Marais Sicre, J.-F. Dejoux, M. Huc, et al. 2014. “Cartography of Irrigated Crops and Estimation of Biophysical Variables with High Spatial and Temporal Resolution Images.” GV2M: Global Vegetation Monitoring and Modeling 1. https://colloque6.inra.fr/gv2m/Oral-Sessions.
- Baup, F., E. Mougin, P. de Rosnay, F. Timouk, and I. Chênerie. 2007. “Surface Soil Moisture Estimation over the AMMA Sahelian Site in Mali Using ENVISAT/ASAR Data.” Remote Sensing of Environment 109 (4): 473–481. doi:10.1016/j.rse.2007.01.015.
- Betbeder, Julie, Thomas Corpetti, Samuel Corgne, Laurence Hubert-Moy, Sébastien Rapinel, Thomas Corpetti, Eric Pottier, Samuel Corgne, and Laurence Hubert-Moy. 2014. “Multitemporal Classification of TerraSAR-X Data for Wetland Vegetation Mapping.” Journal of Applied Remote Sensing 8 (083648): 1–16. doi:10.1117/1.JRS.8.083648.
- Betbeder, Julie, Remy Fieuzal, Yannick Philippets, Laurent Ferro-Famil, and Frederic Baup. 2016. “Contribution of Multitemporal Polarimetric Synthetic Aperture Radar Data for Monitoring Winter Wheat and Rapeseed Crops.” Journal of Applied Remote Sensing 10 (2): 026020. doi:10.1117/1.JRS.10.026020.
- Bhattacharya, Avik, Arnab Muhuri, Shaunak De, Surendar Manickam, and Alejandro C. Frery. 2015. “Modifying the Yamaguchi Four-Component Decomposition Scattering Powers Using a Stochastic Distance.” IEEE Journal of Selected Topics in Applied Earth Observations and Remote Sensing 8 (7): 3497–3506. doi:10.1109/JSTARS.2015.2420683.
- Blaes, Xavier, Pierre Defourny, Urs Wegmüller, Senior Member, Andrea Della Vecchia, Leila Guerriero, Paolo Ferrazzoli, and Senior Member. 2006. “C-Band Polarimetric Indexes for Maize Monitoring Based on a Validated Radiative Transfer Model.” IEEE Transactions on Geoscience and Remote Sensing 44 (4): 791–800.
- Blaes, X., L. Vanhalle, and P. Defourny. 2005. “Efficiency of Crop Identification Based on Optical and SAR Image Time Series.” Remote Sensing of Environment 96 (3–4): 352–365. doi:10.1016/j.rse.2005.03.010.
- Brisco, B., R. Touzi, J. J. van der Sanden, F. Charbonneau, T. J. Pultz, and M. D’Iorio. 2008. “Water Resource Applications with Radarsat-2 – A Preview.” International Journal of Digital Earth 1 (1): 130–147. doi:10.1080/17538940701782577.
- Canisius, Francis, Jiali Shang, Jiangui Liu, Xiaodong Huang, Baoluo Ma, Xianfeng Jiao, Xiaoyuan Geng, John M. Kovacs, and Dan Walters. 2018. “Tracking Crop Phenological Development Using Multi-Temporal Polarimetric Radarsat-2 Data.” Remote Sensing of Environment 210: 508–518. doi:10.1016/j.rse.2017.07.031.
- Corgne, Samuel, Ramata Magagi, Michel Yergeau, and Daouda Sylla. 2010. “An Integrated Approach to Hydro-Geological Lineament Mapping of a Semi-Arid Region of West Africa Using Radarsat-1 and GIS.” Remote Sensing of Environment 114 (9): 1863–1875. doi:10.1016/j.rse.2010.03.004.
- Das, Kousik, and Prabir Kumar Paul. 2015. “Soil Moisture Retrieval Model by Using RISAT-1, C-Band Data in Tropical Dry and Sub-Humid Zone of Bankura District of India.” Egyptian Journal of Remote Sensing and Space Science 18 (2): 297–310. doi:10.1016/j.ejrs.2015.09.004.
- Dheeravath, V., P. S. Thenkabail, G. Chandrakantha, P. Noojipady, G. P. O. Reddy, C. M. Biradar, M. K. Gumma, and M. Velpuri. 2010. “Irrigated Areas of India Derived Using MODIS 500 m Time Series for the Years 2001–2003.” ISPRS Journal of Photogrammetry and Remote Sensing 65: 42–59. doi:10.1016/j.isprsjprs.2009.08.004.
- Di Martino, Gerardo, Antonio Iodice, Antonio Natale, and Daniele Riccio. 2016. “Polarimetric Two-Scale Two-Component Model for the Retrieval of Soil Moisture under Moderate Vegetation via L-Band SAR Data.” IEEE Transactions on Geoscience and Remote Sensing 54 (4): 2470–2491. doi:10.1109/TGRS.2015.2502425.
- Du, Peijun, Sicong Liu, Junshi Xia, and Yindi Zhao. 2013. “Information Fusion Techniques for Change Detection from Multi-Temporal Remote Sensing Images.” Information Fusion 14 (1): 19–27. doi:10.1016/j.inffus.2012.05.003.
- Duguay, Yannick, Monique Bernier, Esther Lévesque, and Florent Domine. 2016. “Land Cover Classification in SubArctic Regions Using Fully Polarimetric RADARSAT-2 Data.” Remote Sensing 8 (9): 697. doi:10.3390/rs8090697.
- El Hajj, Mohammad, Nicolas Baghdadi, Mehrez Zribi, Nemesio Rodríguez-Fernández, Jean Wigneron, Amen Al-Yaari, Ahmad Al Bitar, Clément Albergel, and Jean-Christophe Calvet. 2018. “Evaluation of SMOS, SMAP, ASCAT and Sentinel-1 Soil Moisture Products at Sites in Southwestern France.” Remote Sensing 10 (4): 569. doi:10.3390/rs10040569.
- Engelbrecht, Jeanine, Andre Theron, Lufuno Vhengani, and Jaco Kemp. 2017. “A Simple Normalized Difference Approach to Burnt Area Mapping Using Multi-Polarisation C-Band SAR.” Remote Sensing 9 (8): 9–11. doi:10.3390/rs9080764.
- Eswar, R., M. Sekhar, and B. K. Bhattacharya. 2016. “Disaggregation of LST over India: Comparative Analysis of Different Vegetation Indices.” International Journal of Remote Sensing 37 (5): 1035–1054. doi:10.1080/01431161.2016.1145363.
- Feola, Giuseppe, Amy M. Lerner, Meha Jain, Marvin Joseph F. Montefrio, and Kimberly A. Nicholas. 2015. “Researching Farmer Behaviour in Climate Change Adaptation and Sustainable Agriculture: Lessons Learned from Five Case Studies.” Journal of Rural Studies 39: 74–84. doi:10.1016/j.jrurstud.2015.03.009.
- Fieuzal, R., B. Duchemin, L. Jarlan, M. Zribi, F. Baup, O. Merlin, O. Hagolle, and J. Garatuza-Payan. 2011. “Combined Use of Optical and Radar Satellite Data for the Monitoring of Irrigation and Soil Moisture of Wheat Crops.” Hydrology and Earth System Sciences 15 (4): 1117–1129. doi:10.5194/hess-15-1117-2011.
- Fishman, Ram Mukul, Tobias Siegfried, Pradeep Raj, Vijay Modi, and Upmanu Lall. 2011. “Over-Extraction from Shallow Bedrock versus Deep Alluvial Aquifers: Reliability versus Sustainability Considerations for India’s Groundwater Irrigation.” Water Resources Research 47: 1–15. doi:10.1029/2011WR010617.
- Foody, Giles M., Ajay Mathur, Carolina Sanchez-Hernandez, and Doreen S. Boyd. 2006. “Training Set Size Requirements for the Classification of a Specific Class.” Remote Sensing of Environment 104 (1): 1–14. doi:10.1016/j.rse.2006.03.004.
- Gao, Qi, Mehrez Zribi, Maria Escorihuela, Nicolas Baghdadi, and Pere Segui. 2018. “Irrigation Mapping Using Sentinel-1 Time Series at Field Scale.” Remote Sensing 10 (9): 1495. doi:10.3390/rs10091495.
- Gherboudj, Imen, Ramata Magagi, Aaron A. Berg, and Brenda Toth. 2011. “Soil Moisture Retrieval over Agricultural Fields from Multi-Polarized and Multi-Angular RADARSAT-2 SAR Data.” Remote Sensing of Environment 115 (1): 33–43. doi:10.1016/j.rse.2010.07.011.
- Gorrab, Azza, Mehrez Zribi, Nicolas Baghdadi, Bernard Mougenot, and Zohra Lili Chabaane. 2015. “Potential of X-Band TerraSAR-X and COSMO-SkyMed SAR Data for the Assessment of Physical Soil Parameters.” Remote Sensing 7 (1): 747–766. doi:10.3390/rs70100747.
- Guidici, Daniel, and Matthew L. Clark. 2017. “One-Dimensional Convolutional Neural Network Land-Cover Classification of Multi-Seasonal Hyperspectral Imagery in the San Francisco Bay Area, California.” Remote Sensing 9 (6). doi:10.3390/rs9060629.
- Gumma, Murali Krishna, Prasad S. Thenkabail, Pardharsadhi Teluguntla, Mahesh N. Rao, Irshad A. Mohammed, and Anthony M. Whitbread. 2016. “Mapping Rice-Fallow Cropland Areas for Short-Season Grain Legumes Intensification in South Asia Using MODIS 250m Time-Series Data.” International Journal of Digital Earth 9 (10): 981–1003. doi:10.1080/17538947.2016.1168489.
- Hajnsek, Irena, Thomas Jagdhuber, Helmut Schön, and Konstantinos Panagiotis Papathanassiou. 2009. “Potential of Estimating Soil Moisture under Vegetation Cover by Means of PolSAR.” IEEE Transactions on Geoscience and Remote Sensing 47 (2): 442–454. doi:10.1109/TGRS.2008.2009642.
- Haldar, Dipanwita, Pooja Rana, Manoj Yadav, R. S. Hooda, and Manab Chakraborty. 2016. “Time Series Analysis of Co-Polarization Phase Difference (PPD) for Winter Field Crops Using Polarimetric C-Band SAR Data.” International Journal of Remote Sensing 37 (16): 3753–3770. doi:10.1080/01431161.2016.1204024.
- Hill, Michael J., Catherine J. Ticehurst, Jong Sen Lee, Mitchell R. Grunes, Graham E. Donald, and David Henry. 2005. “Integration of Optical and Radar Classifications for Mapping Pasture Type in Western Australia.” IEEE Transactions on Geoscience and Remote Sensing 43 (7): 1665–1681. doi:10.1109/TGRS.2005.846868.
- Hosseini, Mehdi, Heather McNairn, Amine Merzouki, and Anna Pacheco. 2015. “Estimation of Leaf Area Index (LAI) in Corn and Soybeans Using Multi-Polarization C- and L-Band Radar Data.” Remote Sensing of Environment 170: 77–89. doi:10.1016/j.rse.2015.09.002.
- Jagdhuber, Thomas, Irena Hajnsek, Axel Bronstert, and Konstantinos Panagiotis Papathanassiou. 2013. “Soil Moisture Estimation under Low Vegetation Cover Using a Multi-Angular Polarimetric Decomposition.” IEEE Transactions on Geoscience and Remote Sensing 51 (4): 2201–2215. doi:10.1109/TGRS.2012.2209433.
- Jagdhuber, Thomas, Irena Hajnsek, and K. P. Papathanassiou. 2015. “An Iterative Generalized Hybrid Decomposition for Soil Moisture Retrieval under Vegetation Cover Using Fully Polarimetric SAR.” IEEE Journal of Selected Topics in Applied Earth Observations and Remote Sensing 8 (8): 3911–3922. doi:10.1109/JSTARS.2014.2371468.
- Jain, Meha, Pinki Mondal, Ruth S. DeFries, Christopher Small, and Gillian L. Galford. 2013. “Mapping Cropping Intensity of Smallholder Farms: A Comparison of Methods Using Multiple Sensors.” Remote Sensing of Environment 134: 210–223. doi:10.1016/j.rse.2013.02.029.
- Jiao, Xianfeng, John M. Kovacs, Jiali Shang, Heather Mcnairn, Dan Walters, Baoluo Ma, and Xiaoyuan Geng. 2014. “Object-Oriented Crop Mapping and Monitoring Using Multi-Temporal Polarimetric RADARSAT-2 Data.” ISPRS Journal of Photogrammetry and Remote Sensing 96: 38–46. doi:10.1016/j.isprsjprs.2014.06.014.
- Karthikeyan, L., Ming Pan, Niko Wanders, D. Nagesh Kumar, and Eric F. Wood. 2017. “Four Decades of Microwave Satellite Soil Moisture Observations: Part 1. A Review of Retrieval Algorithms.” Advances in Water Resources 109: 106–120. doi:10.1016/j.advwatres.2017.09.006.
- Kim, Yihyun, Thomas Jackson, Rajat Bindlish, Sukyoung Hong, Gunho Jung, and Kyuongdo Lee. 2014. “Retrieval of Wheat Growth Parameters with Radar Vegetation Indices.” IEEE Geoscience and Remote Sensing Letters 11 (4): 808–812. doi:10.1109/LGRS.2013.2279255.
- Kim, Yihyun, Thomas Jackson, Rajat Bindlish, Hoonyol Lee, and Sukyoung Hong. 2012. “Radar Vegetation Indices for Estimating the Vegetation Water Content of Rice and Soybean Radar Vegetation Indices for Estimating the Vegetation Water Content of Rice and Soybean.” IEEE Geoscience and Remote Sensing Letters 9 (4): 564–568.
- Kim, Seung Bum, Mahta Moghaddam, Leung Tsang, Mariko Burgin, Xiaolan Xu, and Eni G. Njoku. 2014. “Models of L-Band Radar Backscattering Coefficients over Global Terrain for Soil Moisture Retrieval.” IEEE Transactions on Geoscience and Remote Sensing 52 (2): 1381–1396. doi:10.1109/TGRS.2013.2250980.
- Kiran, Dasari, and L. Anjaneyulu. 2016. “Eigen Value and Eigen Vector Based Decomposition and Wishart Supervised Classification on Fully Polarimetric SAR Data.” Indian Journal of Science and Technology 9 (S1): 1–6. doi:10.17485/ijst/2016/v9iS1/107927.
- Kornelsen, Kurt C., and Paulin Coulibaly. 2013. “Advances in Soil Moisture Retrieval from Synthetic Aperture Radar and Hydrological Applications.” Journal of Hydrology. doi:10.1016/j.jhydrol.2012.10.044.
- Krishna Kumar, K., K. Rupa Kumar, R. G. Ashrit, N. R. Deshpande, and J. W. Hansen. 2004. “Climate Impacts on Indian Agriculture.” International Journal of Climatology 24 (11): 1375–1393. doi:10.1002/joc.1081.
- Lardeux, Cédric, Pierre Louis Frison, Céline Tison, Jean Claude Souyris, Benoît Stoll, Bénédicte Fruneau, and Jean Paul Rudant. 2009. “Support Vector Machine for Multifrequency SAR Polarimetric Data Classification.” IEEE Transactions on Geoscience and Remote Sensing 47 (12): 4143–4152. doi:10.1109/TGRS.2009.2023908.
- Lee, Jong Sen. 1983. “Digital Image Smoothing and the Sigma Filter.” Computer Vision, Graphics, and Image Processing 24 (2): 255–269. doi:10.1016/0734-189X(83)90047-6.
- Lee, Jong Sen, Jen Hung Wen, Thomas L. Ainsworth, Kun Shan Chen, and Abel J. Chen. 2009. “Improved Sigma Filter for Speckle Filtering of SAR Imagery.” IEEE Transactions on Geoscience and Remote Sensing 47 (1): 202–213. doi:10.1109/TGRS.2008.2002881.
- Li, Qing, Licheng Jiao, and Yingjuan Hao. 2007. “Adaptive Simplification of Solution for Support Vector Machine.” Pattern Recognition 40 (3): 972–980. doi:10.1016/j.patcog.2006.07.005.
- Li, Yifeng, and George Lampropoulos. 2016. “RADARSAT-2 and TerraSAR-X Polarimetric Data for Crop Growth Stages Estimation.” International Geoscience and Remote Sensing Symposium (IGARSS), 4510–4513. doi:10.1109/IGARSS.2016.7730176.
- Llamas, M. R., and P. Martínez-Santos. 2005. “Intensive Groundwater Use: Silent Revolution and Potential Source of Social Conflicts.” Journal of Water Resources 131: 337–341. doi:10.1061/(ASCE)0733-9496(2005)131:5(337).
- Lobell, D. P., M. B. Burke, C. Tebaldi, M. D. Mastrandrea, W. P. Falcon, and R. L. Naylor. 2008. “Prioritizing Climate Change Adaptation Needs for Food Security in 2030.” Science 319 (2008): 607–610. doi:10.1126/science.1152339.
- Lunetta, Ross S, Joseph F Knight, Jayantha Ediriwickrema, John G Lyon, and L. Dorsey Worthy. 2006. “Land-Cover Change Detection Using Multi-Temporal MODIS NDVI Data.” Remote Sensing of Environment. doi:10.1016/j.rse.2006.06.018.
- Ma, Lei, Manchun Li, Xiaoxue Ma, Liang Cheng, Peijun Du, and Yongxue Liu. 2017. “A Review of Supervised Object-Based Land-Cover Image Classification.” ISPRS Journal of Photogrammetry and Remote Sensing 130: 277–293. doi:10.1016/j.isprsjprs.2017.06.001.
- MacDonald Dettwiler and Associates Ltd. 2014. “RADARSAT-2 Product Description,” no. 1: 1–39.
- Maggiori, Emmanuel, Yuliya Tarabalka, Guillaume Charpiat, and Pierre Alliez. 2017. “Convolutional Neural Networks for Large-Scale Remote-Sensing Image Classification.” IEEE Transactions on Geoscience and Remote Sensing 55 (2): 645–657. doi:10.1109/TGRS.2016.2612821.
- Maghsoudi, Yasser, Michael J. Collins, and Donald G. Leckie. 2013. “Radarsat-2 Polarimetric SAR Data for Boreal Forest Classification Using SVM and a Wrapper Feature Selector.” IEEE Journal of Selected Topics in Applied Earth Observations and Remote Sensing 6 (3): 1531–1538. doi:10.1109/JSTARS.2013.2259219.
- Mangiarotti, S., A. K. Sharma, S. Corgne, L. Hubert-Moy, L. Ruiz, M. Sekhar, and Y. Kerr. 2018. “Can the Global Modeling Technique Be Used for Crop Classification?” Chaos, Solitons and Fractals 106: 363–378. doi:10.1016/j.chaos.2017.12.003.
- Mangiarotti, S., A. K. Sharma, M. Sekhar, S. Corgne, L. Ruiz, and Y. Kerr. 2016. “Chaos Modeling Applied to Crops Classification (Berambadi Basin, South of India).” Rencontre Du Non-Lińeaire 2016, 76801.
- Maréchal, Jean Christophe, Jean Michel Vouillamoz, M. S. Mohan Kumar, and Benoit Dewandel. 2010. “Estimating Aquifer Thickness Using Multiple Pumping Tests.” Hydrogeology Journal 18 (8): 1787–1796. doi:10.1007/s10040-010-0664-3.
- Mavroforakis, Michael E, and Sergios Theodoridis. 2006. “A Geometric Approach to Support Vector Machine (SVM) Classification.” IEEE Transactions on Neural Networks 17 (3): 671–682. doi:10.1109/TNN.2006.873281.
- Meiyappan, Prasanth, Michael Dalton, Brian C. O’Neill, and Atul K. Jain. 2014. “Spatial Modeling of Agricultural Land Use Change at Global Scale.” Ecological Modelling 291: 152–174. doi:10.1016/j.ecolmodel.2014.07.027.
- Mishra, Vimal, Brian V Smoliak, Dennis P Lettenmaier, and John M Wallace. 2012. “A Prominent Pattern of Year-to-Year Variability in Indian Summer Monsoon Rainfall.” Proceedings of the National Academy of Sciences 109 (19): 7213–7217. doi:10.1073/pnas.1119150109.
- Mountrakis, Giorgos, Jungho Im, and Caesar Ogole. 2011. “Support Vector Machines in Remote Sensing: A Review.” ISPRS Journal of Photogrammetry and Remote Sensing 66 (3): 247–259. doi:10.1016/j.isprsjprs.2010.11.001.
- Olofsson, Pontus, Giles M. Foody, Stephen V. Stehman, and Curtis E. Woodcock. 2013. “Making Better Use of Accuracy Data in Land Change Studies: Estimating Accuracy and Area and Quantifying Uncertainty Using Stratified Estimation.” Remote Sensing of Environment 129: 122–131. doi:10.1016/j.rse.2012.10.031.
- Ouchi, Kazuo. 2013. “Recent Trend and Advance of Synthetic Aperture Radar with Selected Topics.” Remote Sensing 5 (2): 716–807. doi:10.3390/rs5020716.
- Paul, Supantha, Subimal Ghosh, Robert Oglesby, Amey Pathak, Anita Chandrasekharan, and R. A. A. J. Ramsankaran. 2016. “Weakening of Indian Summer Monsoon Rainfall Due to Changes in Land Use Land Cover.” Scientific Reports 6 (32177): 1–10. doi:10.1038/srep32177.
- Pedregosa, Fabian, Ron Weiss, and Matthieu Brucher. 2011. “Scikit-Learn: Machine Learning in Python.” Journal of Machine Learning Research 12: 2825–2830.
- Robert, Marion, Alban Thomas, Muddu Sekhar, Shrinivas Badiger, Laurent Ruiz, Magali Willaume, Delphine Leenhardt, and Jacques Eric Bergez. 2017. “Farm Typology in the Berambadi Watershed (India): Farming Systems Are Determined by Farm Size and Access to Groundwater.” Water (Switzerland) 9 (1): 1–21. doi:10.3390/w9010051.
- Roy, P. S., M. D. Behera, M. S. R. Murthy, Arijit Roy, Sarnam Singh, S. P. S. Kushwaha, C. S. Jha, et al. 2015. “New Vegetation Type Map of India Prepared Using Satellite Remote Sensing: Comparison with Global Vegetation Maps and Utilities.” International Journal of Applied Earth Observation and Geoinformation 39: 142–159. doi:10.1016/j.jag.2015.03.003.
- Ruiz, L., and M. Sekhar. 2016. “Accompanying the Adaptation of Irrigated Agriculture to Climate Change Table of Contents.” ANR, 1–30.
- Ruiz, L., M. Sekhar, A. Thomas, S. Badiger, J. E. Bergez, S. Buis, S. Corgne, J. Riotte, H. Raynal, and S. Bandhyopadhya. 2016. “Adaptation of Irrigated Agriculture to Climate Change: Trans- Disciplinary Modelling of a Watershed in South India.” Agricultural Systems, 137–138. doi:10.5194/piahs-366-137-2015.
- Salmon, J., Meghan Meghan, Mark A. Friedl, Steve Frolking, Dominik Wisser, and Ellen M. Douglas. 2015. “Global Rain-Fed, Irrigated, and Paddy Croplands: A New High Resolution Map Derived from Remote Sensing, Crop Inventories and Climate Data.” International Journal of Applied Earth Observation and Geoinformation 38: 321–334. doi:10.1016/j.jag.2015.01.014.
- Sekhar, M., Y. Javeed, S. Bandyopadhyay, S. Mangiarotti, P. Mazzega, M. Sekhar, Y. Javeed, et al. 2011. “Groundwater Management Practices and Emerging Challenges: Lessons from a Case Study in the Karnataka State of South India.” In Groundwater Management Practices, edited by Angelos N. Findikakis and Kuniaki Sato, 1–26. Boca Raton, FL: CRC Press. doi:10.1201/b11062.
- Sekhar, M., J. Riotte, L. Ruiz, P. Jouquet, and J. J. Braun. 2016. “Influences of Climate and Agriculture on Water and Biogeochemical Cycles: Kabini Critical Zone Observatory.” Proceedings of the Indian National Science Academy 82 (3): 833–846. doi:10.16943/ptinsa/2016/48488.
- Sekhar, M., and L. Ruiz. 2010. “IFCPAR/CEFIPRA PROJECT – Adaptation of Irrigated Agriculture to Climate CHAnge (AICHA): Project Proposal.” IFCPAR/CEFIPRA, 1–108.
- Sharma, A. K., L. Hubert-Moy, J. Betbeder, L. Ruiz, M. Sekhar, and S. Corgne. 2016. “Crop Identification Using Time Series of Landsat-8 and Radarsat-2 Images: Application in a Groundwater Irrigated Region, South India.” ESA-SP Volume 740 1: 103. doi:ISBN: 978-92-9221-305-3.
- Sharma, A. K., L. Hubert-Moy, Buvaneshwari Sriramulu, Muddu Sekhar, L. Ruiz, Soumya Bandyopadhyay, and Samuel Corgne. 2018. “Irrigation History Estimation Using Multitemporal Landsat Satellite Images: Application to an Intensive Groundwater Irrigated Agricultural Watershed in India.” Remote Sensing 10 (6), 893. doi:10.3390/rs10060893.
- Shukla, Gaurav, Rahul Dev Garg, Pradeep Kumar, Hari Shanker Srivastava, and Pradeep Kumar Garg. 2018. “Using Multi-Source Data and Decision Tree Classification in Mapping Vegetation Diversity.” Spatial Information Research. doi:10.1007/s41324-018-0200-4.
- Sreelash, K., Samuel Buis, M. Sekhar, Laurent Ruiz, Sat Kumar Tomer, and Martine Guérif. 2017. “Estimation of Available Water Capacity Components of Two-Layered Soils Using Crop Model Inversion: Effect of Crop Type and Water Regime.” Journal of Hydrology 546: 166–178. doi:10.1016/j.jhydrol.2016.12.049.
- Sriramulu, Buvaneshwari, Jean Riotte, Laurent Ruiz, Muddu Sekhar, and Amit Kumar Sharma. 2017. “Impacts of Land-Use and Soil Properties on Groundwater Quality in the Hard Rock Aquifer of an Irrigated Catchment: The Berambadi (Southern India).” 19th EGU General Assembly, EGU2017, Proceedings from the Conference Held 23-28 April, 2017 in Vienna, Austria, p. 18884.
- Sriramulu, Buvaneshwari, Jean Riotte, M. Sekhar, M. S. Mohan Kumar, Amit Kumar, Jean Louis, Stephane Audry, et al. 2016. “Groundwater Resource Vulnerability and Spatial Variability of Nitrate Contamination: Insights from High Density Tubewell Monitoring in a Hard Rock Aquifer.” Science of the Total Environment. doi:10.1016/j.scitotenv.2016.11.017.
- Srivastava, Hari Shanker, Parul Patel, Yamini Sharma, and Ranganath R. Navalgund. 2009. “Large-Area Soil Moisture Estimation Using Multi-Incidence-Angle RADARSAT-1 SAR Data.” IEEE Transactions on Geoscience and Remote Sensing 47 (8): 2528–2535. doi:10.1109/TGRS.2009.2018448.
- Steele-Dunne, Susan C., Heather McNairn, Alejandro Monsivais-Huertero, Jasmeet Judge, Pang Wei Liu, and Kostas Papathanassiou. 2017. “Radar Remote Sensing of Agricultural Canopies: A Review.” IEEE Journal of Selected Topics in Applied Earth Observations and Remote Sensing 10 (5): 2249–2273. doi:10.1109/JSTARS.2016.2639043.
- Subash, Y., M. Sekhar, K. Tomer, S. and K, and A. Sharma. 2018. “A Framework for Assessment of Climate Change Impacts on Groundwater System Formations.” Sustainable Water Resources Management 375–397. doi:10.1061/9780784414767.
- Surendar, M., A. Bhattacharya, G. Singh, and G. Venkataraman. 2015. “Estimation of Snow Density Using Full-Polarimetric Synthetic Aperture Radar (SAR) Data.” Physics and Chemistry of the Earth, Parts A/B/C 83-84: 156–165. doi:10.1016/j.pce.2015.07.001.
- Susan Moran, M., Luis Alonso, Jose F. Moreno, Maria Pilar Cendrero Mateo, D. Fernando De La Cruz, and Amelia Montoro. 2012. “A RADARSAT-2 Quad-Polarized Time Series for Monitoring Crop and Soil Conditions in Barrax, Spain.” IEEE Transactions on Geoscience and Remote Sensing 50 (4): 1057–1070. doi:10.1109/TGRS.2011.2166080.
- Taylor, Richard G., Bridget Scanlon, Petra Döll, Matt Rodell, Rens Van Beek, Yoshihide Wada, Laurent Longuevergne, et al. 2013. “Ground Water and Climate Change.” Nature Climate Change 3 (4): 322–329. doi:10.1038/nclimate1744.
- Thenkabail, P., C. M. Biradar, P. Noojipady, V. Dheeravath, Y. J. Li, M. Velpuri, G. P. O. Reddy, et al. 2008. “A Global Irrigated Area Map (GIAM) Using Remote Sensing at the End of the Last Millennium.” Water Management. doi:10.13140/RG.2.1.4945.0087.
- Tomer, Sat, Ahmad Al Bitar, Muddu Sekhar, Mehrez Zribi, Soumya Bandyopadhyay, and Yann Kerr. 2016. “MAPSM: A Spatio-Temporal Algorithm for Merging Soil Moisture from Active and Passive Microwave Remote Sensing.” Remote Sensing 8 (12): 990. doi:10.3390/rs8120990.
- Tomer, Sat Kumar, Ahmad Al Bitar, Muddu Sekhar, Mehrez Zribi, S. Bandyopadhyay, K. Sreelash, A. K. Sharma, Samuel Corgne, and Yann Kerr. 2015. “Retrieval and Multi-Scale Validation of Soil Moisture from Multi-Temporal SAR Data in a Semi-Arid Tropical Region.” Remote Sensing 7: 8128–8153. doi:10.3390/rs70608128.
- Torbick, Nathan, Diya Chowdhury, William Salas, and Jiaguo Qi. 2017. “Monitoring Rice Agriculture across Myanmar Using Time Series Sentinel-1 Assisted by Landsat-8 and PALSAR-2.” Remote Sensing 9 (2): 1–22. doi:10.3390/rs90201019.
- Ulaby, Fawwaz T. 1975. “Radar Response to Vegetation.” IEEE Transactions on Antennas and Propagation 23 (1): 36–45. doi:10.1109/TAP.1975.1140999.
- Ulaby, Fawwaz T., Gerald A. Bradley, and Myron C. Dobson. 1979. “Microwave Backscatter Dependence on Surface Roughness, Soil Moisture, and Soil Texture: Part II–Vegetation-Covered Soil.” IEEE Transactions on Geoscience Electronics 17 (2): 33–40. doi:10.1109/TGE.1979.294626.
- Ulaby, F. T., M. C. Dobson, and D. R. Brunfeldt. 1983. “Improvement of Moisture Estimation Accuracy of Vegetation-Covered Soil by Combined Active/Passive Microwave Remote Sensing.” IEEE Transactions on Geoscience and Remote Sensing 21 (3): 300–307. doi:10.1109/TGRS.1983.350557.
- Wang, Hongquan, Ramata Magagi, and Kalifa Goïta. 2018. “Potential of a Two-Component Polarimetric Decomposition at C-Band for Soil Moisture Retrieval over Agricultural Fields.” Remote Sensing of Environment 217 (January): 38–51. doi:10.1016/j.rse.2018.08.003.
- Wood, Stephen A., Amir S. Jina, Meha Jain, Patti Kristjanson, and Ruth S. DeFries. 2014. “Smallholder Farmer Cropping Decisions Related to Climate Variability across Multiple Regions.” Global Environmental Change 25 (1): 163–172. doi:10.1016/j.gloenvcha.2013.12.011.
- Yan, L., and D. P. Roy. 2014. “Automated Crop Field Extraction from Multi-Temporal Web Enabled Landsat Data.” Remote Sensing of Environment 144: 42–64. doi:10.1016/j.rse.2014.01.006.
- Yan, L., and D. P. Roy. 2016. “Conterminous United States Crop Field Size Quantification from Multi-Temporal Landsat Data.” Remote Sensing of Environment 172: 67–86. doi:10.1016/j.rse.2015.10.034.
- Yang, Zhi, Yun Shao, Kun Li, Qingbo Liu, Long Liu, and Brian Brisco. 2017. “An Improved Scheme for Rice Phenology Estimation Based on Time-Series Multispectral HJ-1A/B and Polarimetric RADARSAT-2 Data.” Remote Sensing of Environment 195: 184–201. doi:10.1016/j.rse.2017.04.016.
- Yonezawa, Chinatsu, Masahiro Negishi, Kenta Azuma, Manabu Watanabe, Naoki Ishitsuka, Shigeo Ogawa, and Genya Saito. 2012. “Growth Monitoring and Classification of Rice Fields Using Multitemporal RADARSAT-2 Full-Polarimetric Data.” International Journal of Remote Sensing 33 (18): 5696–5711. doi:10.1080/01431161.2012.665194.
- Yusoff, Noryusdiana Mohamad, Farrah Melissa Muharam, Wataru Takeuchi, Soni Darmawan, and Muhamad Hafiz Abd Razak. 2017. “Phenology and Classification of Abandoned Agricultural Land Based on ALOS-1 and 2 PALSAR Multi-Temporal Measurements.” International Journal of Digital Earth 10 (2): 155–174. doi:10.1080/17538947.2016.1216615.
- Zhang, Ce. 2018. “Deep Learning for Land Cover and Land Use Classification.” Lancaster Environment Centre, Lancaster University.
- Zhao, Wei, Nilda Sánchez, Hui Lu, and Ainong Li. 2018. “A Spatial Downscaling Approach for the SMAP Passive Surface Soil Moisture Product Using Random Forest Regression.” Journal of Hydrology 563 (April): 1009–1024. doi:10.1016/j.jhydrol.2018.06.081.
- Zribi, M., A. Gorrab, N. Baghdadi, Z. Lili-Chabaane, and B. Mougenot. 2014. “Influence of Radar Frequency on the Relationship between Bare Surface Soil Moisture Vertical Profile and Radar Backscatter.” IEEE Geoscience and Remote Sensing Letters 11 (4): 848–852. doi:10.1109/LGRS.2013.2279893.
- Zribi, Mehrez, Azza Gorrab, Nicolas Baghdadi, Zohra Lili-Chabaane, Bernard Mougenot, and Gilles Boulet. 2013. “Radar Frequency Effect on the Relationship between Surface Soil Moisture Vertical Profile and Radar Backscatter.” Geophysical Research Abstracts EGU General Assembly 15 (4): 2013–11104.