
ABSTRACT
For evaluating the progresses towards achieving the Sustainable Development Goals (SDGs), a global indicator framework was developed by the UN Inter-Agency and Expert Group on Sustainable Development Goals Indicators. In this paper, we propose an improved methodology and a set of workflows for calculating SDGs indicators. The main improvements consist of using moderate and high spatial resolution satellite data and state-of-the-art deep learning methodology for land cover classification and for assessing land productivity. Within the European Network for Observing our Changing Planet (ERA-PLANET), three SDGs indicators are calculated. In this research, harmonized Landsat and Sentinel-2 data are analyzed and used for land productivity analysis and yield assessment, as well as Landsat 8, Sentinel-2 and Sentinel-1 time series are utilized for crop mapping. We calculate for the whole territory of Ukraine SDG indicators: 15.1.1 – ‘Forest area as proportion of total land area’; 15.3.1 – ‘Proportion of land that is degraded over total land area’; and 2.4.1 – ‘Proportion of agricultural area under productive and sustainable agriculture’. Workflows for calculating these indicators were implemented in a Virtual Laboratory Platform. We conclude that newly available high-resolution remote sensing products can significantly improve our capacity to assess several SDGs indicators through dedicated workflows.
1. Introduction
Since 2015, the community forming the Group on Earth Observation (GEO) has begun to support and implement projects for the development of the Global Earth Observation System of Systems (GEOSS). GEOSS points to a large collection of in-situ and satellite measurements and acts as the largest access point for in-situ and satellite measurements for monitoring the state of the Earth (Giuliani et al. Citation2017; Nativi et al. Citation2015). This approach offers a single Internet access point for users seeking data, imagery and analytical software packages relevant to all parts of the globe (Nativi et al. Citation2014).
The ERA-PLANET Horizon 2020 project ‘The European Network for Observing our Changing Planet’ is a contribution of the European Community for addressing the objectives of international agreements such as the Sustainable Development Goals (SDGs), the Paris Agreement on Climate and the Sendai Framework for Disaster Risk Reduction (Aitsi-Selmi et al. Citation2015). One of the four strands, GEOEssential, of the project is focusing on Resource Efficiency and Environmental Management. Within this strand, Earth observation (EO) data are used for monitoring resource efficiency utilization, as well as for assessing the progress towards achieving SDGs. The main task of our research in this project is to contribute to SDG on agriculture aiming at: end hunger, achieve food security and improved nutrition, promote sustainable agriculture aimed at ensuring sustainable food production systems and implementing resilient agricultural practices. Other SDGs aim at protection, restoration and promotion of sustainable use of earth ecosystems, sustainable forests management, and combating desertification. To reach these goals, specific targets have been set: ensuring the conservation, restoration and sustainable use of inland freshwater ecosystems and their services; combating desertification by 2020; restoration of degraded lands by 2030. In order to evaluate, how far we are from achieving these goals, a global indicator framework was developed by the Inter-Agency and Expert Group on SDG Indicators (IAEG-SDGs). So far, the list includes 232 indicators, on which a general agreement has been reached. In this paper, we focus on three particular indicators, namely:
2.4.1. Proportion of agricultural area under productive and sustainable agriculture;
15.1.1 Forest area as proportion of total land area; and
15.3.1 Proportion of land that is degraded over total land area.
Within the Global Support Program, a pilot project was set up by the UN Committee on Combating Desertification and the Security Assistance Program with the aim of reaching Land Degradation Neutrality (LDN). The goal of LDN is to maintain or enhance the natural capital of the land and associated land-based ecosystem services. Land cover change, land productivity dynamics (LPD) and organic carbon stock are selected as sub indicators for the indicator 15.3.1. Land cover changes evaluated based on ESA’s Climate Change Initiative (CCI) Land Cover dataset (https://www.esa-landcover-cci.org/?q=node/175) and EC Joint Research Centre’s (JRC) LPD dataset (Ivits and Cherlet Citation2013) are used as default sources for land productivity assessment. The main problems associated with these datasets are coarse spatial resolution and lower accuracy compared to regional based products.
Therefore, this study aims to fill the above-mentioned gap by improving the calculation of the SDG indicators through the use of moderate and high spatial resolution data. The main goal is to apply and improve the methodologies, which were used for generating global products with coarse spatial resolution data, to higher spatial resolution data, which will be better suited for regional products and applications. For calculating the selected SDG indicators, we use a food-water-energy nexus approach based on satellite data, in-situ data, vegetation indices (VIs) and meteorological data. Since global land cover products have lower accuracy for Ukraine compared to regional products (Kussul et al. Citation2017a), we use regional land cover maps with high spatial resolution based on Landsat 8, Sentinel-2 and Sentinel-1 data. These regional land cover maps were produced using the state-of-the-art methodology based on deep learning approach (Kussul et al. Citation2014; Kussul et al. Citation2012). We also propose a new improved methodology for calculating a land productivity map based on high spatial resolution satellite data.
2. Method
2.1. Workflows for calculating SDG indicators
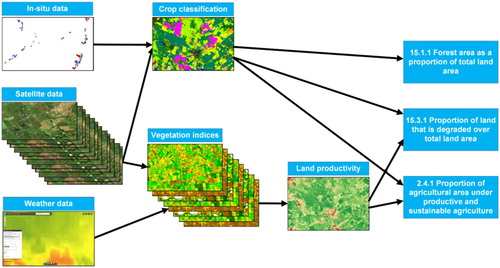
From the list of 232 SDG indicators, we present a general workflow for calculating three selected SDGs indicators as shown in .
Figure 1. Workflow for calculating Sustainable Development Goals indicators 15.1.1, 15.3.1 and 2.4.1.
GEOEssential ERA-Planet project is focused on the development of workflows for Essential Variables (EVs) monitoring and SDG estimation using RS data within nexus approach (Lehmann et al. Citation2019). This nexus approach is considering environmental system as model constructed from food, water and energy components and relationships between them (Biggs et al. Citation2015). Thus, EVs can often belong to more than one nexus approach component. Within the project, the list of EVs for food-water-energy nexus approach was created and described in deliverable 6.1 ‘Description of Food Water Energy EVs’ (McCallum et al. Citation2019). Workflows for indicators 15.1.1, 15.3.1 and 2.4.1 based on EVs () related to food, water, energy nexus approach were developed.
Figure 2. Food, water, energy Essential Variables that are used in SDG indicator 15.1.1, 15.3.1, 2.4.1 workflows.
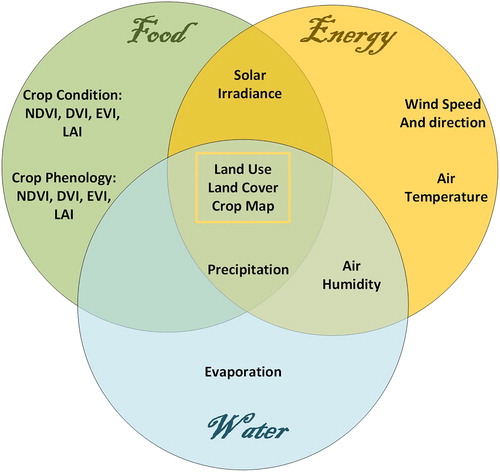
EVs from the food security domain include crop area and crop type represented by crop classification map, crop condition assessment and crop phenology characterized by vegetation indices (VIs) as such as NDVI, DVI, EVI (Kogan et al. Citation2013), and biophysical parameters such as leaf area index (LAI) (Shelestov et al. Citation2017a). For better estimation of crop condition and crop phenology with the use of VI, weather data that relate to Water and Energy Essential Variables are valuable. Water and Energy Essential Variables include precipitation, evaporation, surface air temperature, solar surface irradiation, humidity, and wind speed. These agrometeorological parameters are essential for VI modeling and enhancement of satellite-based estimation of crop productivity.
2.2. Workflow for calculating indicator 15.3.1
The indicator ‘15.3.1 Proportion of land that is degraded over total land area’ is a binary, degraded/not degraded, quantification based on the analysis of available data for sub-indicators to be validated and reported by national authorities (namely, Trends in Land Cover, Land Productivity and Carbon Stocks). This indicator is based on statistical principal ‘One Out, All Out’ on evaluation of changes in the sub-indicator (https://unstats.un.org/sdgs/metadata/files/Metadata-15-03-01.pdf) (Cowie et al. Citation2018). This principle means that we have three types of changes in the sub-indicators, which are depicted as positive or improving, negative or declining and sustainable or unchanging. If one of the sub-indicators has negative changes for some area, then this area has negative productivity.
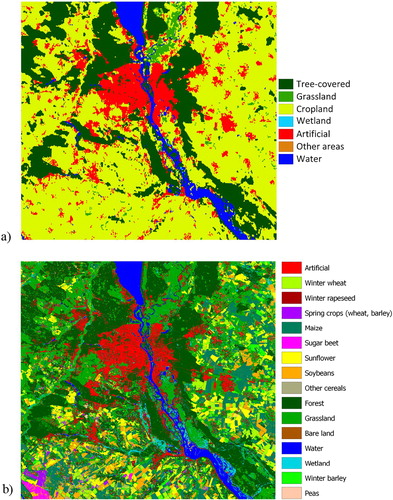
Our proposed methodology is based on a deep learning approach, in particular an ensemble of neural networks (Kussul et al. Citation2017b). At the core of the architecture are multilayer perceptrons (MLP), which are trained using different parameters and architectures (number of hidden layers), and form an ensemble, which outperforms any of the individual MLPs. The rectified linear unit (ReLU) function is used as the activation function for neurons in the hidden layers, and training of the MLPs is performed using a stochastic gradient-based optimizer proposed by Kingma and Ba (Citation2014). In order to avoid overfitting, an L2 regularization was used with regularization coefficient set to 0.1, and learning rate was set to 10−3. A committee of neural networks is used for providing crop classification and land cover maps for Ukraine using high spatial resolution Landsat 8, Sentinel-1 and Sentinel-2 imagery (Skakun et al. Citation2015; Kussul et al. Citation2016; Kussul et al. Citation2018; Ghazaryan et al. Citation2018) and appropriate in-situ data for 2000, 2010, 2016 and 2017 (Shelestov et al. Citation2017b; Skakun et al. Citation2016; Waldner et al. Citation2016). The spatial resolution of the resulting maps is 30 m for 2000 and 2010, and 10 m for 2016 and 2017 (). The overall accuracy is improved by more than 10% compared to ESA’s Climate Change Initiative Land Cover dataset; the kappa coefficient for ESA’s Climate Change Initiative Land Cover dataset is 0.75, while the kappa coefficient for our map is 0.9 (Kussul et al. Citation2017a). shows the difference between coarse-resolution ESA’s Climate Change Initiative Land Cover for 2015 and our high-resolution classification map for 2016 year in Kiev region.
Figure 3. Crop classification map at 10 m spatial resolution for Ukraine for 2017.
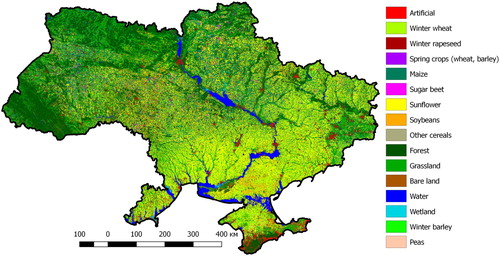
Figure 4. Visual comparison of the (a) 300m landcover ESA CCI-LC and with the (b) 10m crop classification map for Kiev.
2.3. The use of harmonized Landsat Sentinel 2 data for crop productivity and yield assessment
Crop productivity is an important parameter to monitor and assess land degradation that is usually defined as the production of organic matter during the photosynthesis process (Gitelson Citation2011). Current RS based estimates of crop productivity are based on the Monteith approach (Monteith Citation1972), which relates production to absorbed photosynthetic active radiation (APAR) and Light Use Efficiency (LUE) (Bandaru et al. Citation2013; Prince and Goward Citation1995). From crop production, crop yields can be estimated through the harvest index (HI), which provides a ratio between grain mass to aboveground biomass (He et al. Citation2018; Prince et al. Citation2001; Xin et al. Citation2015). It should be noted that crop production is usually accumulated over the growing season, and therefore, estimation of the crop productivity requires the use of high-temporal satellite data. Until recently, such requirement was mainly fulfilled with coarse spatial resolution data, for example Moderate Resolution Imaging Spectroradiometer (MODIS), which provides daily observations. With the availability of Landsat 8 and Sentinel-2 data, it becomes possible to provide data every 3–5 days (Li and Roy Citation2017).
A Normalized Difference Vegetation Index (NDVI) has usually served as a proxy for RS-based estimation of crop yields or fraction of Absorbed Photosynthetically Active Radiation (fAPAR) (López-Lozano et al. Citation2015; Shelestov et al. Citation2017a). However, when dealing with a moderate spatial resolution at 10-30 m saturation can occur for high biomass plants (Gitelson Citation2011). For example, Skakun et al. (Citation2017) showed that Landsat 8/Sentinel-2 derived NDVI saturated for winter wheat with yields >4 t/ha in Ukraine. Therefore, other indices should be tested to reduce the effect of saturation. Here, we use a combination of Landsat 8 and Sentinel-2 data to extract vegetation indices (VIs) and correlate VIs with crop yields with the aim to estimate crop production following the Monteith model and provide spatially explicit maps (Bandaru et al. Citation2013). Since Landsat 8 and Sentinel-2 exhibit some discrepancies in terms of geometry and radiometry, we use a NASA’s harmonized product called HLS (Harmonized Landsat Sentinel-2), which reduces differences between satellite’s sensors (Claverie et al. Citation2018). Spectral bands from HLS are used to calculate VIs such as NDVI, and difference vegetation index (DVI).
Since temperature is a primary factor affecting the rate of crop development, meteorological data are used as well. In particular, we calculate growing degree days (GDDs) to define the growing season for which accumulation of RS-derived VIs will take place (Bandaru et al. Citation2013). For GDD calculation, we use air temperature derived from NASA’s Modern-Era Retrospective analysis for Research and Applications (MERRA2) reanalysis data set (Molod et al. Citation2015). The data sets (daily averaged 2-meter air temperature) were extracted from the netCDF format, transformed to the geo-referenced raster, subset for study areas and linearly interpolated to the HLS 30 m spatial resolution. A quadratic function between VIs and GDD is used (De Beurs and Henebry Citation2004).
HLS-derived VIs are correlated with winter wheat yields at a regional scale (district) in Ukraine (Kirovohradska oblast). Crop yield statistics were collected from the Department of Agro-Industry Development of Kirovohrad State Administration. To derive VIs only over winter wheat fields, we used crop specific maps produced for Ukraine for 2016 and 2017 using Landsat 8, Sentinel-1 and Sentinel-2 data (Kussul et al. Citation2017b).
2.4. Workflow for calculating indicator 2.4.1
The indicator ‘2.4.1: Proportion of agricultural area under productive and sustainable agriculture’ can be calculated using the same methodology as proposed for indicator 15.3.1 calculation. This indicator is a ratio of agricultural area that has a positive productivity value to the total agricultural area by the rule ‘One Out, All Out’. For this indicator, we use the same sub-indicators as for indicator 15.3.1, but the area of interest is not the whole land area, but rather the agricultural (cultivated) land. For this indicator, the use of high spatial resolution satellite images is particularly important, since mixed pixels greatly affect the value of sub-indicator changes.
2.5. Workflow for calculating indicator 15.1.1
The indicator ‘15.1.1 Forest area as proportion of total land area’ is a ratio of all land area to forest area. We estimate total land area, removing water and wetland areas, using classification map, and then calculate this indicator as proportion of forest area to total land area.
2.6. Implementation of the SDG indicator’s workflows in the Virtual Laboratory
In the ECOPotential project (http://www.ecopotential-project.eu), several partners are responsible for generating heterogeneous resources such as satellite data, in-situ data, services, analysis and modeling tools, processing algorithms, models/workflows and models results. These resources need to be discoverable and accessible to all project partners as inputs for ecosystems and ecosystem services study, as well as to various categories of external users. To address these requirements, an interoperability framework, that was developed as a Virtual Laboratory (VLab: https://vlab.geodab.eu/), provides a web service-based access to the resources. VLab is a new efficient and perspective way for scientists to carry out research aimed at the use of large satellite and in-situ measurement data supplied by the GEOSS Platform. Using cloud computing resources, with direct access to data of the GEOSS Portal, VLab has the ability to introduce workflows to calculate and monitor essential variables of water, food and energy and, accordingly, to calculate SDGs indicators for different countries around the world. We use the VLab tool to calculate the indicator 2.4.1 and 15.3.1. The benefits of using VLab are an opportunity to implement complex workflows in a cloud platform with an easy access to data from GEOSS and other major data providers and the possibility of knowledge generation for ECOPotential storylines.
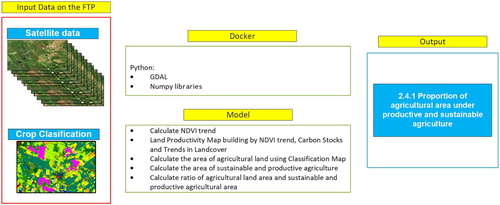
A workflow for indicator 2.4.1 calculation in VLab takes as an input a classification map with agricultural classes of land cover and a time series of satellite images for several years. Based on the time series of satellite images, we estimate an NDVI trend for these several years. Under the productivity in each pixel, we consider the slope of the trend line. Thus, our script calculates total agricultural land area and land area with positive productivity (sustainable and productive agriculture) based on crop classification map and productivity map. As an output, it gives the indicator 2.4.1 for the selected territory as a proportion of total agricultural land area to productive and sustainable agriculture ().
Figure 5. Workflow for indicator 2.4.1 implementation in VLab.
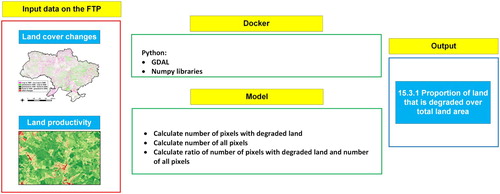
Implementation of the workflow for indicator 15.3.1 in VLab takes land cover change map and land productivity map as inputs, calculates area of productive land and total area of land, and outputs their ratio ().
Figure 6. Workflow for indicator 15.3.1 realisation in VLab.
Workflows are implemented as python scripts in the docker that can be imported in Vlab platform with further workflow launch. The SGD indicator 2.4.1 calculation workflow is available via GitHub (https://github.com/LeonidShumilo/Vlab_241). To run this workflow (available as a test model at the VLAB site), a VLAB-user should provide an input URL to download Landsat-8 and Sentinel-2 data jointly with classification map for the territory of interest. After data processing, the workflow will produce a text file with the value of SDG indicator 2.4.1 for the territory of interest.
The second workflow is implemented in a similar way and available via a GitHub repository (https://github.com/LeonidShumilo/Vlab1531). In this use case, a VLAB user should provide an input URL to download land cover change map and land productivity map. As an output, the workflow generates a text file with a value of the SDG indicator 15.3.1 for the territory of interest. The similar implementation for the SDG indicator 15.1.1 is available via GitHub repository (https://github.com/LeonidShumilo/Vlab1511).
3. Results
3.1. HLS for crop productivity and yield assessment
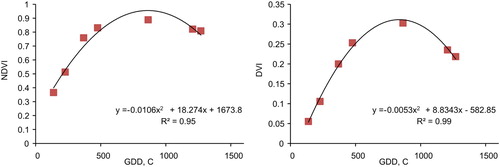
shows a quadratic relationship between NDVI and DVI against accumulated GDD for a winter wheat field. The peak of the crop growth is around 900°C in Ukraine, which corresponds to the previous study from MODIS data (Franch et al. Citation2015). Both relationships exhibit high coefficient of determination (R2), however NDVI quickly reaches the value around 0.8 (at around GDD = 500), and does not change that much until crop maturity stage.
Figure 7. Examples of VIs (NDVI and DVI) fitting versus accumulated GDD for a winter wheat field in 2017.
For each pixel identified as winter wheat, accumulated NDVI and DVI were calculated, averaged over administrative units (districts) and correlated with official statistics on yields. The derived relationships for 2016–2017 are shown in .
Figure 8. Relationship between accumulated NDVI and DVI against winter wheat yields for 2016 and 2017.
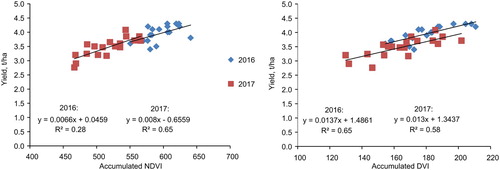
While for 2017, both approaches show good performance with R2 = 0.6–0.65, for 2016 the DVI-based approach outperformed the NDVI-based approach. Coefficients in the DVI regressions are more consistent (for both 2016 and 2017) which allows a more robust relationship retrieval for multiple years. Having these relationships in place, one can analyze winter wheat productivity through multiple years and monitor its changes.
3.2. SDGs indicators
Using the proposed workflow shown in , we calculated indicators 15.1.1, 15.3.1 and 2.4.1 for the territory of Ukraine. Forest and total land area values were derived from land cover maps for 2000, 2010 and 2016. Thus, indicator 15.1.1 was calculated as a proportion of forest and total land area for these years (). We could see the positive trend when using statistics data as well as with satellite data. It means that in Ukraine, forest plantations dominate deforestation.
Table 1. Forest area as a proportion of total land area by statistics and our classification maps in 2000, 2010 and 2016 years.
A land productivity map has been obtained using NDVI based on high-resolution Sentinel-2 and Landsat-8 satellite images for 2013–2017 years. In , a comparison of coarse resolution productivity map based on MODIS data and our high-resolution productivity map is shown for Ukraine territory for 2017. Using our high-resolution productivity map and crop classification map we calculated indicators 15.3.1 and 2.4.1 for territory of Ukraine for 2016 and 2017. Combined values of indicators 15.3.1 and 2.4.1 for 2016 and 2017 are shown in .
Figure 9. Comparison coarse resolution productivity map based on MODIS data and our high-resolution productivity map for Ukraine territory for the year 2017.
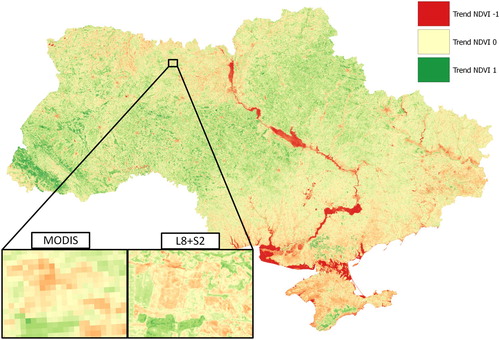
Table 2. Indicators 15.3.1 and 2.4.1 for territory of Ukraine for 2016 and 2017 years.
We can observe a positive dynamic in productivity growth for all land from 46.19% to 48.24% and for agricultural land from 37.6% to 42.8%, but the area with negative trend of vegetation index is still more than 29,046 thousand ha. The growth can be explained by the introduction of effective agricultural practices, the establishment of harvesting systems (Fileccia et al. Citation2014; Lesiv et al. Citation2018), but usually these actions are carried out in large agricultural lands or in fields belonging to large agricultural enterprises, so this large part of the land with a negative trend still exists. Particularly highlighted with the negative value of productivity, we find: Eastern Ukraine and Crimea due to the deterioration of the situation and problems with access to water; and Western Ukraine through deforestation. If we consider general growth, then, in addition to improving the conditions of agricultural land in Ukraine, there is a restoration of cut down forests, which provide improvement each year with a significant trend of vegetation. According to the State Agency for Forest Resources of Ukraine, 52.6 thousand hectares of forest was restored in 2016, and 53.2 thousand ha in 2017.
4. Conclusions
In this paper, we proposed an improved workflow based on satellite data, in-situ data, Essential Variables, vegetation indexes (VI) and meteorological data for calculating three SDG indicators ‘2.4.1 Proportion of agricultural area under productive and sustainable agriculture’, ‘15.1.1 Forest area as proportion of total land area’ and ‘15.3.1 Proportion of land that is degraded over total land area and indicator’. Within a pilot project of the UN Committee on Combating Desertification and the Security Assistance Program, a methodology for calculating index 15.3.1 was developed. It is based on ESA’s Climate Change Initiative Land Cover dataset and JRC LPD dataset. These datasets are global and therefore have coarse spatial resolution and not perfectly accurate. Thus, we used land covers provided by our deep learning methodology based on high spatial resolution imagery from Landsat, Sentinel-2 and Sentinel-1 for Ukraine territory. Quality and accuracy of such land covers are much higher than global ones (gain is approximately 10%). Also, in this study, we proposed a new methodology for generating a land productivity map using high spatial resolution Sentinel-2 and Landsat-8 data that allow us to calculate indicator 15.3.1 and other derivatives indicators 15.1.1 and 2.4.1 more precisely. We conclude that newly available high-resolution RS products can significantly improve our capacity to assess several SDGs indicators through dedicated workflows from data to indicators and through essential variables.
SDG indicators estimation for goal 15 ‘Life on land’ and goal 2 ‘Zero hunger’ are highly dependent on land cover data. The up-to-date land cover with high enough spatial and temporal resolution (at least on annual basis) is crucial for execution of corresponding workflow. In order to further scale the proposed approach to regional/global levels, training data are required that can be collected publicly from available datasets such as Open Street Maps with land cover information. Furthermore, opensource platforms with a possibility to download street-level imagery and global land cover products could be used for generating training datasets at a global scale. Another approach is to develop pretrained classification models using a wide range of agro-climatic conditions for land cover mapping on a global scale.
Disclosure statement
No potential conflict of interest was reported by the authors.
ORCID
Nataliia Kussul http://orcid.org/0000-0002-9704-9702
Mykola Lavreniuk http://orcid.org/0000-0003-2183-8833
Andrii Kolotii http://orcid.org/0000-0002-6972-4483
Sergii Skakun http://orcid.org/0000-0002-9039-0174
Additional information
Funding
References
- Aitsi-Selmi, A., S. Egawa, H. Sasaki, C. Wannous, and V. Murray. 2015. “The Sendai Framework for Disaster Risk Reduction: Renewing the Global Commitment to People’s Resilience, Health, and Well-being.” International Journal of Disaster Risk Science 6 (2): 164–176. doi: 10.1007/s13753-015-0050-9
- Bandaru, V., T. O. West, D. M. Ricciuto, and R. C. Izaurralde. 2013. “Estimating Crop Net Primary Production Using National Inventory Data and MODIS-derived Parameters.” ISPRS Journal of Photogrammetry and Remote Sensing 80: 61–71. doi: 10.1016/j.isprsjprs.2013.03.005
- Biggs, E. M., E. Bruce, B. Boruff, J. M. A. Duncan, J. Horsley, N. Pauli, K. McNeill, et al. 2015. “Sustainable Development and the Water–Energy–Food Nexus: A Perspective on Livelihoods.” Environmental Science & Policy 54: 389–397. doi: 10.1016/j.envsci.2015.08.002
- Claverie, M., J. Ju, J. G. Masek, J. L. Dungan, E. F. Vermote, J.-C. Roger, S. Skakun, and C. O. Justice. 2018. “The Harmonized Landsat and Sentinel-2 Surface Reflectance Data Set.” Remote Sensing of Environment 219: 145–161. doi: 10.1016/j.rse.2018.09.002
- Cowie, A. L., B. J. Orr, V. M. C. Sanchez, P. Chasek, N. D. Crossman, A. Erlewein, G. Louwagie, et al. 2018. “Land in Balance: The Scientific Conceptual Framework for Land Degradation Neutrality.” Environmental Science & Policy 79: 25–35. doi: 10.1016/j.envsci.2017.10.011
- De Beurs, K. M., and G. M. Henebry. 2004. “Land Surface Phenology, Climatic Variation, and Institutional Change: Analyzing Agricultural Land Cover Change in Kazakhstan.” Remote Sensing of Environment 89 (4): 497–509. doi: 10.1016/j.rse.2003.11.006
- Fileccia, T., M. Guadagni, V. Hovhera, and M. Bernoux. 2014. “Ukraine: Soil Fertility to Strengthen Climate Resilience.” Food and Agriculture Organization of the United Nations, Rome, Italy. http://www.fao.org/3/a-i3905e.pdf.
- Franch, B., E. F. Vermote, I. Becker-Reshef, M. Claverie, J. Huang, J. Zhang, C. Justice, and J. A. Sobrino. 2015. “Improving the Timeliness of Winter Wheat Production Forecast in the United States of America, Ukraine and China Using MODIS Data and NCAR Growing Degree Day Information.” Remote Sensing of Environment 161: 131–148. doi: 10.1016/j.rse.2015.02.014
- Ghazaryan, G., O. Dubovyk, F. Löw, M. Lavreniuk, A. Kolotii, J. Schellberg, and N. Kussul. 2018. “A Rule-based Approach for Crop Identification Using Multi-temporal and Multi-sensor Phenological Metrics.” European Journal of Remote Sensing 51 (1): 511–524. doi: 10.1080/22797254.2018.1455540
- Gitelson, A. A., 2011. “Remote Sensing Estimation of Crop Biophysical Characteristics at Various Scales.” In Hyperspectral Remote Sensing of Vegetation, edited by Prasad S. Thenkabail, John G. Lyon, Alfredo Huete, 329–358. Boca Raton, FL: CRC Press.
- Giuliani, G., P. Lacroix, Y. Guigoz, R. Roncella, L. Bigagli, M. Santoro, and A. Lehmann. 2017. “Bringing GEOSS Services into Practice: A Capacity Building Resource on Spatial Data Infrastructures (SDI).” Transactions in GIS 21 (4): 811–824. doi: 10.1111/tgis.12209
- He, M., J. S. Kimball, M. P. Maneta, B. D. Maxwell, A. Moreno, S. Beguería, and X. Wu. 2018. “Regional Crop Gross Primary Productivity and Yield Estimation Using Fused Landsat-MODIS Data.” Remote Sensing 10 (3), art. num. 372.
- Ivits, E., and M. Cherlet. 2013. “Land-productivity Dynamics Towards Integrated Assessment of Land Degradation at Global Scales.” Joint Research Centre (European Commission). European Union, doi:10.2788/59315.
- Kingma, D. P., and J. Ba. 2014. “Adam: A Method for Stochastic Optimization.” arXiv preprint arXiv:1412.6980.
- Kogan, F., N. Kussul, T. Adamenko, S. Skakun, O. Kravchenko, O. Kryvobok, A. Shelestov, A. Kolotii, O. Kussul, and A. Lavrenyuk. 2013. “Winter Wheat Yield Forecasting in Ukraine Based on Earth Observation, Meteorological Data and Biophysical Models.” International Journal of Applied Earth Observation and Geoinformation 23: 192–203. doi: 10.1016/j.jag.2013.01.002
- Kussul, N., A. Kolotii, A. Shelestov, B. Yailymov, and M. Lavreniuk. 2017a. “Land Degradation Estimation from Global and National Satellite based Datasets within UN Program.” In 9th IEEE International Conference on Intelligent Data Acquisition and Advanced Computing Systems: Technology and Applications (IDAACS) (Vol. 1, pp. 383–386).
- Kussul, N., M. Lavreniuk, A. Shelestov, and S. Skakun. 2018. “Crop Inventory at Regional Scale in Ukraine: Developing in Season and End of Season Crop Maps with Multi-temporal Optical and SAR Satellite Imagery.” European Journal of Remote Sensing 51 (1): 627–636. doi: 10.1080/22797254.2018.1454265
- Kussul, N., M. Lavreniuk, S. Skakun, and A. Shelestov. 2017b. “Deep Learning Classification of Land Cover and Crop Types Using Remote Sensing Data.” IEEE Geoscience and Remote Sensing Letters 14 (5): 778–782. doi: 10.1109/LGRS.2017.2681128
- Kussul, N., G. Lemoine, F. J. Gallego, S. Skakun, M. Lavreniuk, and A. Shelestov. 2016. “Parcel-based Crop Classification in Ukraine Using Landsat-8 Data and Sentinel-1A Data.” IEEE Journal of Selected Topics in Applied Earth Observations and Remote Sensing 9 (6): 2500–2508. doi: 10.1109/JSTARS.2016.2560141
- Kussul, N., S. Skakun, A. Shelestov, O. Kravchenko, F. J. Gallego, and O. Kussul. 2012. “Crop Area Estimation in Ukraine Using Satellite Data within the MARS Project.” 2012 IEEE International Geoscience and Remote Sensing Symposium: 3756–3759.
- Kussul, N., S. Skakun, A. Shelestov, and O. Kussul. 2014. “The Use of Satellite SAR Imagery to Crop Classification in Ukraine within JECAM Project.” 2014 IEEE Geoscience and Remote Sensing Symposium: 1497–1500.
- Lehmann, A., S. Nativi, P. Mazzetti, J. Maso, I. Serral, D. Spengler, A. Niamir, et al. 2019. “GEOEssential – Mainstreaming Workflows from Data Sources to Environment Policy Indicators with Essential Variables.” International Journal of Digital Earth. doi:10.1080/17538947.2019.1585977.
- Lesiv, M., D. Schepaschenko, E. Moltchanova, R. Bun, M. Dürauer, A. V. Prishchepov, and N. Kussul. 2018. “Spatial Distribution of Arable and Abandoned Land Across Former Soviet Union Countries.” Scientific Data 5, art num. 180056. doi: 10.1038/sdata.2018.56
- Li, J., and D. P. Roy. 2017. “A Global Analysis of Sentinel-2A, Sentinel-2B and Landsat-8 Data Revisit Intervals and Implications for Terrestrial Monitoring.” Remote Sensing 9 (9), art. num. 902. doi: 10.3390/rs9090903
- López-Lozano, R., G. Duveiller, L. Seguini, M. Meroni, S. García-Condado, J. Hooker, and B. Baruth. 2015. “Towards Regional Grain Yield Forecasting with 1 km-resolution EO Biophysical Products: Strengths and Limitations at Pan-European Level.” Agricultural and Forest Meteorology 206: 12–32. doi: 10.1016/j.agrformet.2015.02.021
- McCallum, I., S. Fritz, N. Kussul, A. Lehmann, J. Maso, C. Montzka, I. Serral, and D. Spengler. 2019. “Addressing the Food Water Energy Nexus with Earth Observation.” International Journal of Digital Earth.
- Molod, A., L. Takacs, M. Suarez, and J. Bacmeister. 2015. “Development of the GEOS-5 Atmospheric General Circulation Model: Evolution from MERRA to MERRA2.” Geoscientific Model Development 8 (5): 1339–1356. doi: 10.5194/gmd-8-1339-2015
- Monteith, J. L. 1972. “Solar Radiation and Productivity in Tropical Ecosystems.” The Journal of Applied Ecology 9 (3): 747–766. doi: 10.2307/2401901
- Nativi, S., P. Mazzetti, M. Craglia, and N. Pirrone. 2014. “The GEOSS Solution for Enabling Data Interoperability and Integrative Research.” Environmental Science and Pollution Research 21 (6): 4177–4192. doi: 10.1007/s11356-013-2264-y
- Nativi, S., P. Mazzetti, M. Santoro, F. Papeschi, M. Craglia, and O. Ochiai. 2015. “Big Data Challenges in Building the Global Earth Observation System of Systems.” Environmental Modelling & Software 68: 1–26. doi: 10.1016/j.envsoft.2015.01.017
- Prince, S. D., and S. N. Goward. 1995. “Global Primary Production: A Remote Sensing Approach.” Journal of Biogeography 22 (4–5): 815–835. doi: 10.2307/2845983
- Prince, S. D., J. Haskett, M. Steininger, H. Strand, and R. Wright. 2001. “Net Primary Production of US Midwest Croplands from Agricultural Harvest Yield Data.” Ecological Applications 11 (4): 1194–1205. doi: 10.1890/1051-0761(2001)011[1194:NPPOUS]2.0.CO;2
- Shelestov, A., A. Kolotii, S. Skakun, B. Baruth, R. Lopez Lozano, and B. Yailymov. 2017a. “Biophysical Parameters Mapping Within the SPOT-5 Take 5 Initiative.” European Journal of Remote Sensing 50 (1): 300–309. doi: 10.1080/22797254.2017.1324743
- Shelestov, A., M. Lavreniuk, N. Kussul, A. Novikov, and S. Skakun. 2017b. “Exploring Google Earth Engine Platform for Big Data Processing: Classification of Multi-temporal Satellite Imagery for Crop Mapping.” Frontiers in Earth Science 5: 17. doi: 10.3389/feart.2017.00017
- Skakun, S., N. Kussul, A. Shelestov, and O. Kussul. 2015. “The Use of Satellite Data for Agriculture Drought Risk Quantification in Ukraine.” Geomatics, Natural Hazards and Risk 7 (3): 901–917. doi: 10.1080/19475705.2015.1016555
- Skakun, S., N. Kussul, A. Shelestov, M. Lavreniuk, and O. Kussul. 2016. “Efficiency Assessment of Multitemporal C-Band Radarsat-2 Intensity and Landsat-8 Surface Reflectance Satellite Imagery for Crop Classification in Ukraine.” IEEE Journal of Selected Topics in Applied Earth Observations and Remote Sensing 9 (8): 3712–3719. doi: 10.1109/JSTARS.2015.2454297
- Skakun, S., E. Vermote, J.-C. Roger, and B. Franch. 2017. “Combined Use of Landsat-8 and Sentinel-2A Images for Winter Crop Mapping and Winter Wheat Yield Assessment at Regional Scale.” AIMS Geosciences 3 (2): 163–186. doi: 10.3934/geosci.2017.2.163
- Waldner, F., D. De Abelleyra, S. R. Verón, M. Zhang, B. Wu, D. Plotnikov, S. Bartalev, et al. 2016. “Towards a Set of Agrosystem-specific Cropland Mapping Methods to Address the Global Cropland Diversity.” International Journal of Remote Sensing 37 (14): 3196–3231. doi: 10.1080/01431161.2016.1194545
- Xin, Q., M. Broich, A. E. Suyker, L. Yu, and P. Gong. 2015. “Multi-scale Evaluation of Light use Efficiency in MODIS Gross Primary Productivity for Croplands in the Midwestern United States.” Agricultural and Forest Meteorology 201: 111–119. doi: 10.1016/j.agrformet.2014.11.004