
 ?Mathematical formulae have been encoded as MathML and are displayed in this HTML version using MathJax in order to improve their display. Uncheck the box to turn MathJax off. This feature requires Javascript. Click on a formula to zoom.
ABSTRACT
Within this survey we describe the conceptual architecture of the infrastructure to measure PM2.5/PM10 concentration in the atmosphere over the Kyiv city using modern monitoring instruments. We define the requirements for information tools and network for informing Kyiv city community on the state of PM pollutions that will be created. This infrastructure will provide long-term PM2.5/PM10 observations that could be included in the AirBase network. The comprehensive review of in-situ and satellite measurements of PM2.5/PM10 is provided as well as the description current state-of-the-art for Air Quality monitoring with intelligent sensors and systems in Ukraine as-awhole and in Kyiv in particular. It is proposed to apply the concept of essential variables (EVs) used in Earth Observation to identify the variables that should be measured in priority when designing, deploying and maintaining observation systems. In this study we use and validate the global air quality products from Copernicus Atmosphere Monitoring Service obtained from modeling by GEOS-Chem model and other sources. The influence of PM and aerosols on a human health is estimated in terms of possible diseases and dangerous concentrations.
1. Introduction
The ambition of H2020 ERA-PLANET SMURBS project is to improve the quality of life of citizens and enhance cities’ resilience with respect to air pollution and both natural and manmade disasters, through a chain of ‘smart urban solutions’, that aim at long-standing impacts on health and newly rising environmental pressures. Cities need to identify their vulnerabilities, and support policies to shield citizens and mitigate impacts of urbanization using in-situ and space-borne Earth Observation (EO), in conjunction with other observational platforms. The other relevant ERA-PLANET project is GEOEssential (Lehmann et al. Citation2019). This project concentrates on estimation of sustainable development goals (SDGs) with essential variables (EVs) as well as on as on information technologies for their estimation (Skakun et al. Citation2015; Kussul et al. Citation2017a; Shelestov et al. Citation2017a).
It is well-known, that existing smart cities do not fully exploit the capacities provided by EO (Kussul et al. Citation2017b; Shelestov et al. Citation2017b). It is especially true with air pollution, from which researchers have revealed a wide array of health effects: respiratory diseases (including asthma and changes in lung function), cardiovascular diseases, adverse pregnancy outcomes, and even death. In 2013, the World Health Organization (WHO) concluded that outdoor air pollution is carcinogen to humans. A high level of air pollution in Ukraine was confirmed in a list where it ranks in ninth place due to a high level of industrial and transport pollution.
Kyiv is selected as one of the pilot cities for technologies development and validation within the SMURBS project. This experience will be further expanded to other cities in Europe. One of the important roles of Ukrainian input into the project is on GEOSS-related technological solutions, and the establishment of the Ukrainian research area in the domain of EO (Kussul et al. Citation2012; Kussul et al. Citation2014; Kussul et al. Citation2016). In this paper the review of the first phase implementation of the project is presented. Experts from different Ukrainian research organizations and representatives of the Kyiv city administration carry out the project.
2. Main pollutants and their impact on human health and society
The quality of air and measurements of air pollution parameters is one of the priorities of the ERA-PLANET SMURBS project and is of primary importance for Ukraine.
In our study, we have compared Copernicus services data with measurements of the Central Geophysical Observatory (CGO, the responsible body for air quality measurements in Kyiv City) and other available in-situ data sources. The quality of the outdoor air is estimated by air quality index (AQI), which is used by governmental agencies in order to inform citizens on current air pollution level. If the index increases, a significant part of the population will face serious health consequences. Every country has its own AQIs according to different national standards.
Influence of air quality on human health was covered by numerous international programs and initiatives. For instance, the WHO and the Climate and Clean Air Coalition (CCAC) of the United Nations Environment Programme (UNEP) launched BreatheLife initiative.
According to the WHO, 91% of the world’s population breathes polluted air, which is one of the leading factors in the development of non-infectious diseases. In Ukraine, about 80% of the population lives in the high inhalation risk areas. Over the past 10 years, an increase in the incidence of cancer cases, respiratory diseases, circulatory system diseases, birth defects and diseases of the nervous system associated with air pollution have been noted. According to the WHO study, 25,834 people (123 deaths per 100,000 population) died from air pollution during 2012 in Ukraine (WHO Citation2016).
Emissions from different transport modes, the burning of fossil fuels, industrial production, forest fires, aerosol use and radiation are fare some of the main causes of air pollution.
It is rather difficult to assess a general tendency of the morbidity levels of the population of Ukraine by the statistical data, because it is connected with the deterioration of social-economic situation, the annexation of the Crimea and the performance of anti-terrorist operation in the east of Ukraine since 2014, partially in Donetsk and Luhansk regions (where the highest pollution’s level was observed). But in the last 10 years, the growth of the incidence of oncological, respiratory, circulation system diseases, birth defects has been registered. In 2015, a number of cases of diseases have been recorded for the first time for a 100,000 population: cancer – 859 cases, circulation system diseases – 4321 cases; respiratory diseases – 27,796 cases; birth defects – 113 cases; diseases of nervous system – 1513 cases, diseases of endocrine system – 945 cases (http://www.ukrstat.gov.ua). World Bank experts have shown that losses from air pollution in Ukraine are the cause of 22,000 additional deaths per year, which is 4% of GDP . The sources of the liberate gases emissions and substances that are toxic for human beings. The most harmful emissions are: tropospheric ozone (O3), sulfur dioxide (SO2), nitrogen dioxide (NO2), benzo(a)pyrene (BaP) and suspended particulate matter (PM).
Traffic pollution is connected with a fast increase in the number of vehicles. It highlights a topicality of the problem of health issues in populations residing in technologically loaded regions.
As an alternative of monitoring activity, as it was mentioned in the frames of the EU program ‘Year of Air’ (2013) of the WHO European Office, the assessment of ambient air pollution was recommended to be performed on the basis of models of the surface layer of the atmosphere. This was confirmed in the Review of EVIdence on Health Aspects of Air Pollution (project REVIHAAP) and the Health Risks of Air Pollution in Europe (project HRAPIE), as well as in the EU Directive 2008/50/EU.
As practical approach, the implementation survey is considered for modeling of the influence of PM on human nervous system aiming the estimation of the effect of air quality on human health.
Ukraine was recognized as a major source of aerosols and other pollutants of the atmosphere associated with industry, transport, agriculture as well as wildfires and dust storms (Birmili et al. Citation2008; Sciare et al. Citation2008; Bovchaliuk Citation2013b; Galytska et al. Citation2018). Until recently the atmosphere pollution over Ukraine by aerosols was mainly studied using remote sensing (RS) techniques and modeling (Danylevsky et al. Citation2011; Milinevsky et al. Citation2014; Miatselskaya et al. Citation2016; Milinevsky and Danylevsky Citation2018). Aerosol particle sources were identified by analyses of the air mass back trajectories statistic (Kabashnikov et al. Citation2014). The RS techniques determine the total content of the aerosol particles in the atmosphere column and their optical properties and radiative effects. Particles size distribution averaged in the total atmosphere column is estimated through inversion of the RS data (e.g. Danylevsky et al. Citation2011). However, these methods give little information about the air pollution by PM at ground level. On the other hand, extrapolation of the data obtained from the studies conducted in other countries (e.g. Birmili et al. Citation2008; Sciare et al. Citation2008) allows recognizing Ukraine as the most polluted country in Europe. Measurements of the mean value an archaic regulatory measure of total suspended particles (TSP) which are performed by the CGO in Ukrainian cities, gave the TSP equal to 120 μg/m3 with peak values reaching 1800 μg/m3 in 2016. For example, in Kyiv city, daily mean TSP values vary from 100 to 200 μg/m3 (http://www.cgo.kiev.ua). It means that some Ukrainian cities can be considered as the most air-polluted cities in Europe. Therefore, the implementation of PM measurements in Ukraine and in particular in Kyiv, with the appropriate techniques and an information network, is an important step toward the control of air pollution.
European Environment Agency (EEA) collects particulate matter (PM2.5/PM10) concentration data from monitoring stations in 15 countries to the AirBase database (http://acm.eionet.europa.eu/databases/airbase/) that comprises air quality data throughout Europe, from which the map of annual mean PM2.5/PM10 concentrations in Europe are created without covering the Ukrainian territory. The standards of the Environmental Protection Agency of the United States are applied to European PM10 and PM2.5 concentrations. The daily averaged PM2.5 standard was equal to 35 μg/m3 in 2006, and later, in 2012, the standard annual value of PM2.5 equal to 12 μg/m3 was applied.
In Ukraine, the State Hydro Meteorological Service (SHMS) is a main body engaged in ambient air quality monitoring. Currently, the collection and processing of information are provided based on the routine laboratory methods that do not allow to make operative management decisions, and is inconvenient for statistical analyses. Only 60% of chemical substances are monitored, the other substances are ignored by the regulators. For instance, the monitoring of PM10, PM2.5 and surface ozone has not been implemented yet.
3. EVs for air quality estimation and quality of life
Air quality estimation is a key factor for several SDGs (ECOSOC Citation2017): SDG 3 – Ensure healthy lives and promote well-being for all at all ages; SDG 11 – Make cities and human settlements inclusive, safe, resilient and sustainable; and SDG 12 – Ensure sustainable consumption and production patterns; and SDG 13 – Take urgent action to combat climate change and its impacts.
For monitoring the progresses in sustainable development, it was proposed to apply the concept of EVs (e.g. Lehmann et al. Citation2019) used in EO Communities to identify those variables that are important and should have priority in designing, deploying and maintaining observation systems and ensuring the availability of data and products.
The development of sets of EVs in most Societal Benefit Areas (SBAs – Agriculture, Biodiversity, Climate, Disasters, Ecosystems, Energy, Health, Water, and Weather) and thematic areas – Citizen Science, Human Settlements, Oceans, and Solid Earth Science, is a community processes leading to an agreement on what is essential for this goals of the community (Bombelli et al. Citation2015). While there are many differences across the communities in the details of the criteria, methodologies, and processes used to develop sets of EVs, there is also a considerable common core across the communities, particularly those with a more advanced discussion. Concerning inter-community differences of criteria, in particular, the feasibility to measure the EVs in terms of cost, effort, and impact plays a different role in different communities. There is some level of overlap between the EVs determined by different communities (e.g. Climate and Water), and there is a potential to develop an integrated set of EVs common to several or all SBAs, which then could be complemented with SBA specific EVs. The SBAs with a more mature development of EV lists are Climate, Ocean and Biodiversity. The Water SBA is also maturing a set of EVs in GEOSS (Lawford Citation2014) that has many intersections with the Essential Climate Variables (ECV).
Discussion about a set of EVs for air quality estimation is still continuing (Bombelli et al. Citation2016). Such EAQVs could be part of Urban EVs and Health EVs. An analysis of air quality and its impacts on health, ecosystems, the built environment and the climate is presented in the report (EEA Citation2016). The latest findings and estimates on population exposure to the air pollutants with the greatest impacts on health in Europe, as well as an overview of the effects of air pollution on human health and on ecosystems are also considered (EEA Citation2016). To date, there is a set of basic air quality parameters coming from the ECV framework, consisting of the following pollutants: sulfur dioxide SO2, nitrogen dioxide NO2, ozone O3, carbon monoxide CO, particulate matter PM10 and PM2.5 (GEO Citation2010). Each of these pollutants has been identified by epidemiological studies as causal factor in human incidences or mortality. These pollutants are socially regulated by environmental laws in many countries around the world, meaning that is their emissions and ambient concentrations are subject to the mandatory standards (EC Citation2004, Citation2008; WHO Citation2006).
For Ukraine, the choice of EV in this area meets specific challenges attributed to current state of ground monitoring systems, as well as the underdevelopment of information systems using remote sensing data. Considering these circumstances, in discussions about the choice of EV, it is often proposed to use expected estimates, rather than measured parameters (several drafts of national level documents were studied within this research). Therefore, the assessment of gaps in the measured parameters and the applicability of the EV in the field of Health and the Environment are critical for human state.
One of the objectives of this work is to demonstrate the applicability of selected EV and remote sensing data for assessing the ecological situation in Kyiv. We intend not only to create information systems for the Kyiv smart city project, but also to substantiate the choice of EV at the national level. At the same time, this work attempts to expand the content of the one of the EV, namely particulate matter concentration, PM10 and PM 2.5. Section 5.5 is dedicated to the experimental study of toxic effects of ultrafine air pollution particulate matter, which result in a wide range of diseases. Special attention is paid to the risk of neurotoxicity, which is associated with the fact that fine and ultrafine air pollution particulate matter can reach the central nervous system during inhalation. Preliminary results suggest that monitoring of smaller particles (less than 100 nm in size) is probably necessary.
The implementation of project goals is based on both remote and in-situ data. The relevant remote data products represent global Multi-Angle Implementation of Atmospheric Correction (MAIAC) data products (http://lpdaac.usgs.gov). International networks of ground-based sun photometers, provides a continuous databases of aerosol measurements: AERONET (http://aeronet.gsfc.nasa.gov) and SKYNET (http://atmos2.cr.chiba-u.jp/skynet/) have been actively used to investigate the distribution of PM.
Correlations between optical aerosol depth (AOD) from MODIS and PM measured on the surface were analyzed for estimating the surface PM values from space for different regions (China, Europe, USA) (Vienneau et al. Citation2013; Dumitrache et al. Citation2016; Lee, Chatfield, and Strawa Citation2016; Segura et al. Citation2017). The trends of PM2.5 over different provinces of China from 2001 to 2015 were analyzed (Lin et al. Citation2018). The urban PM10 and PM2.5 concentrations over the London area, based on synergistic MERIS/AATSR aerosol observations, were estimated using land cover and morphology data (Beloconi, Kamarianakis, and Chrysoulakis Citation2016).
4. Methods
4.1. In-situ measurements of PM as EVs
The stationary monitoring station of PM10 and PM2.5 based at the O.M. Marzeiev Institute for Public Health located on the Eastern edge of the Kyiv city was used in this study. Sampling location meets the requirement of representativeness of the measurement point. Instrumental measurements of the PM10 and PM2.5 concentrations in ambient air are provided by the APDA-371 (HORIBA) analyzer that automatically measures airborne particulate concentration levels, using the industry-proven principle of beta ray attenuation. The stationary monitoring station provides automatic continuous measurements of PM10 and PM2.5 concentrations with hourly averaging and data transfer in online mode. Standard measurements of APDA-371 range between 0 and 1000 μg/m3.
The statistical analyses of the results were made with the STATISTICS software (https://en.freedownloadmanager.org/Windows-PC/STATISTICA.html). Meteorological parameters (wind speed and direction, temperature, humidity, air pressure) were recorded simultaneously using the meteorological sensor WS-600. Measurement was conducted at the height of 2 m from the horizontal roof surface of the monitoring station using the vertical sampler with the protection from atmospheric precipitation. The duration of the measurements is one year from 1 June 2017 till 31 May 2018. The obtained concentration data allow to calculate the AQI for PM10 and PM2.5 using the equationproposed by EPA (Citation2016). In this equation
is the index for pollutant p,
is the truncated concentration of pollutant p,
is the concentration breakpoint that is greater than or equal to
,
is the concentration breakpoint that is less than or equal to
,
is the AQI value corresponding to
,
is the AQI value corresponding to
.
4.2. Satellite products for PM as EVs measurements
Satellite data for Air Quality (AQ) include products: nitrogen dioxide (NO2), ozone (O3), sulfur dioxide (SO2), ammonia (NH3), methane (CH4), carbon monoxide (CO) and particulate matter (PM). These data are collected by NASA and NOAA satellites. These compositions are partially included in the list of EVs proposed by Bojinski et al. (Citation2014). Enhanced aerosol properties also could be extracted from satellite data (Dubovik et al. Citation2011).
Copernicus Atmosphere Monitoring Service (CAMS) has been developed for sharing data and processed information about the Earth’s surface, aerosols, ozone and other reactive gases, aiming to support policymakers, business and citizens with enhanced atmospheric environmental information. Satellite air quality products available for Kyiv are analyzed in .
Table 1. List of ongoing satellite products on atmospheric pollution available for the Kyiv region.
The new era of estimation of AQ from satellite data has been started after the launch of Sentinel-5P on the 13th of October 2017. The Sentinel-5P mission focuses on monitoring of trace gas concentrations and aerosols in the atmosphere to support operational services covering air quality near-real-time applications, air quality protocol monitoring and climate protocol monitoring. The main data products are O3, NO2, SO2, HCHO, CO, CH4 and aerosol optical depth with expected spatial resolution 7 × 7 km2. They are freely available since June 2018.
4.3. Methods for studying the influence of PM on the human nervous system
The experiments dedicated to study the influence of PM on the human nervous system are based on the following methods:
Isolation of rat brain nerve terminals (synaptosomes) (Borisova Citation2016; Borisova and Borysov Citation2016). The synaptosome preparations were obtained by differential and density gradient centrifugation of brain homogenate according to (Borisova Citation2014; Borisova et al. Citation2016).
Recording of the plasma membrane potential (Em) of rat brain nerve terminals. Measurements were performed using a potentiometric fluorescent dye rhodamine 6G (0.5 µM) at 528 and 551 nm of excitation and emission wavelengths, respectively, with a spectrofluorimeter Hitachi MPF-4 (Borisova Citation2013; Borisova Citation2019).
Analysis of water-suspended wood smoke aerosol preparations by dynamic light scattering (Borisova Citation2013). Water-suspended wood smoke aerosol preparations were analyzed by dynamic light scattering with a laser correlation spectrometer Zetasizer-3 (Malvern Instruments, UK), equipped with He–Ne laser LGN-111 (P = 25 mW, λ = 633 nm). Registration and statistical processing of laser scattered from water (n = 1.33) suspensions of particles were performed repeatedly for 60 s at +22°C with scattering angle 90°. Data were processed with computer software service PCS-Size mode v1.61. The laser correlation spectrometer was equipped with multi-computing correlator type 7032 ce.
5. Results and discussion
5.1. PM measurements in Kyiv city
5.1.1. Air quality evaluations by PM2.5/PM10 measurements
PM concentration is measured mainly in ground level air by in-situ technique with special equipment. RS techniques have also been developed for PM determination using aerosol optical depth (AOD) measurements by ground-based sun photometers and LIDAR’s (e.g. Schaap et al. Citation2009) and satellite instruments (e.g. Kacenelenbogen et al. Citation2006; van Donkelaar et al. Citation2011; Guo et al. Citation2016). The method relies on the empirical relationship between columnar AOD measured over certain site and PM concentration measured at the ground level. The first estimation of the PM matter pollution of the atmosphere over Ukraine was attempted by (Bovchaliuk Citation2013a). The monthly averaged PM2.5 concentration throughout Europe from AirBase data in the 2005–2013 period was compared to POLDER/PARASOL AOD measurements over Europe. The AOD versus PM2.5 relationship was determined and applied to the Ukrainian territory for 2007. Analysis of the AOD-V-PM2.5 relationship shown that PM2.5 concentration over 20 in-situ monitoring sites correlates with the POLDER AOD (865 nm) with correlation coefficient R ≈ 0.62 and RMS ≈ 3.26, and regression parameters were determined as follows PM2.5 (µg/m3) ≈ 9.6 + 73.4 * AOD (865 nm). The significant intercept in 9.6 µg/m3 can be explained by the usage of monthly mean AOD threshold 0.01 for PM2.5 assessment (Bovchaliuk Citation2013a). Therefore, with this method, only the PM2.5 values larger than 10.3 µg/m3 can be retrieved.
According to the results of (Bovchaliuk Citation2013a), the monthly averaged PM2.5 concentrations were less than 12 µg/m3 in the ground-level atmosphere over Europe during 2005–2013 period. However, values approximately 12–18 µg/m3 were determined in the industrial regions, especially in Poland, Northern Italy, and Romania. Over Ukraine, the largest PM2.5 data (55 µg/m3) have been observed during wildfire events in August 2010. These values are classified by EEA as unhealthy for sensitive groups. For example, similar levels of ground-based PM2.5 data to PARASOL AOD measurements were reported over China in (Guo et al. Citation2016). Using the much larger interval of PM2.5 values (3–1000 µg/m3) with mean 56 µg/m3, Guo et al. (Citation2016) retrieved correlation coefficient between PM2.5 and POLDERAOD data R = 0.57–0.64, which is close to those obtained by Bovchaliuk (Citation2013a).
In addition to permanent registration at the Marzeiev Institute for Public Health monitoring site, for preliminary evaluations of PM2.5/PM10 mass concentration in Kyiv and several other cities in Ukraine in the period from August 2016 to August 2017, we used laser monitor SDL607 for measurements. This inexpensive portable instrument has been compared with the PM2.5/PM10 HORIBA analyzer by simultaneous PM measurements and showed reasonable agreement. The results of the PM2.5/PM10 measurements in Kyiv, Kharkiv and Lviv cities showed that PM values during the cold period of a year are often higher than maximum permissible level according to EEA standards (25 μg/m3). On the average PM2.5 values in Kyiv city varied in different locations within 33–45 μg/m3, and PM10 values are within 29–71 μg/m3. The measurements performed in other cities of Ukraine in cold period exposed PM2.5 values in Lviv ranging between 11 and 38 μg/m3, and in Kharkiv between 10 and 120 μg/m3.
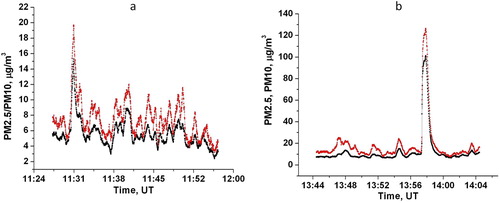
To determine the most contaminated areas in Kyiv city, the PM monitoring device (SDL607) was installed on the roof of a car and continuous measurements along city roads were made. Two examples of these transects are shown in . The spikes of PM2.5 contamination during measurements exceed background values from 15–20 μg/m3 to 85–100 μg/m3 in heavy traffic roads and traffic jam places.
Figure 1. Continuous recording of PM2.5 and PM10 measurements along streets: (a) intersections with heavy traffic streets in Kyiv (30 June 2017); (b) central part of the city and traffic jam at the Ring road (1 July 2017).
5.2. Validation of satellite products on PM with in-situ data
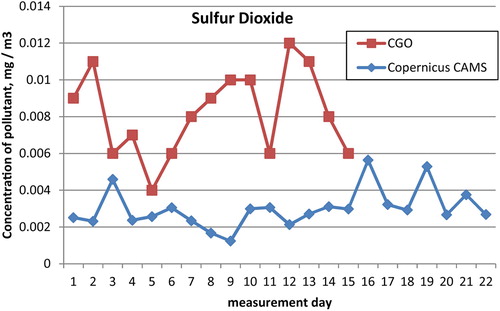
Using the measurements of the CGO in the 1–22 January period, the data provided by Copernicus services for the Kyiv city was analyzed. Nitrogen dioxide and sulfur dioxide concentrations in mg/m3 are shown in and .
Figure 2. Kyiv NO2 concentrations based on Copernicus data and CGO measurements.
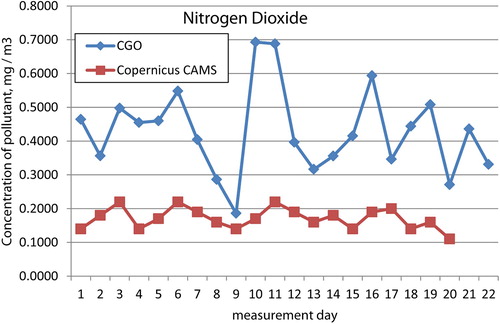
Figure 3. Kyiv SO2 concentrations based on Copernicus data and CGO measurements.
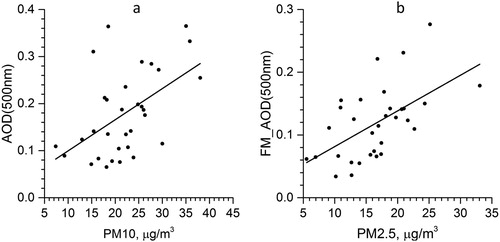
The comparison has been made to reveal and quantify the influence of the aerosol particles concentration in the near-ground air in the Kyiv city on the columnar aerosol content measured by AOD (Aerosol Optical Depth). The empirical relation between these parameters is used both to analyze atmosphere dynamics over the Kyiv city and to monitor the air pollution in the ground air by RS technique. Daily AOD (500 nm) Level 1.5 (see documentation on the AERONET site, https://aeronet.gsfc.nasa.gov/new_web/data.html) and daily averaged PM2.5 and PM10 measured with the laser monitor SDL607 in different locations at different time during daytime during transects campaign were compared. The measurements of the AOD and PM were performed during 32 days were selected for analysis between June and October 2017. The AERONET algorithm (O'Neill et al. Citation2003) determines AOD (500 nm) for total particles in the atmosphere column, and separately for fine mode (0.5–1.0 μm) and coarse mode (1.0–15 μm) particles. PM2.5 concentrations were compared with fine mode AOD (500 nm) and PM10 one with total AOD (500 nm) (). Linear regression equation AOD (500 nm) = a + b * PM was used to quantify the AOD – PM relations. Obtained parameters of the regression are:
Total AOD (500 nm) versus PM10: а = 0.03 ± 0.05; b = 0.007 ± 0.002, the Pearson’s correlation coefficient R ≈ 0.52, standard deviation of the points from regression line SD ≈ 0.08.
Fine mode AOD (500 nm) versus PM2.5: а = 0.025 ± 0.03; b = 0.006 ± 0.002, R ≈ 0.57, SD ≈ 0.05.
Figure 4. Comparison of the PM10 (a) and PM2.5 (b) concentrations to daily AOD (500 nm) Level 1.5 measured at Kyiv AERONET site during June–October 2017.
The results are very similar to those obtained in (Schaap et al. Citation2009) for sun photometers and PM measurements.
5.3. PM2.5 spatial and seasonal distributions using GEOS-Chem model
The global three-dimensional model GEOS-Chem is a tool for retrieval the distribution and transport of aerosols and other atmospheric components in the Earth’s atmosphere (Bey et al. Citation2001; Molod et al. Citation2012). The model operates on the data of arrival of chemical components and aerosols into the atmosphere, and also the meteorological data from the GEOS-5 system (Molod et al. Citation2012, Goddard Earth Observing System, see http://www.geos-chem.org/). NOx-hydrocarbon-aerosol were simulated with the model GEOS-Chem version v9.02 with a horizontal resolution of 4 × 5° and 47 vertical levels up to 80 km of altitude. Ninety-three trackers of advection with secondary organic aerosols were used based on 2010–2016 data and meteorological parameters for GEOS-5 (GEOS-fp).
In this section, we consider the distribution of the main types of aerosols determined as particulate matter PM2.5 retrieved using the GEOS-Chem model. For the simulations, the elementary spatial cells are 2° in latitude and 2.5° in longitude, within an area centered on Ukraine with geographical borders ranging between N40° – 60° and E20° – 40°. A total of 99 cells cover the territory of Ukraine, Belarus and several neighboring countries. The analysis was performed during January–December of 2016 on monthly basis. We analyze PM2.5 distribution and seasonality in the layer of 0–100 m altitude above the ground surface using plots for January, March, July and November, which characterize cold, warm and transitional seasons ().
Figure 5. The spatial distribution of PM2.5 concentration in μg/m3 (color scale below) in (a) January, (b) March, (c) July and (d) November 2016.
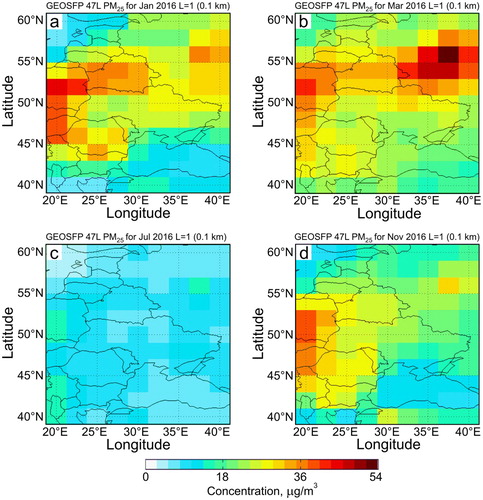
In the seasonal cycle, the maximum PM2.5 emission is observed in January–March, and the minimum – in July. The spatial dependence shows the largest PM2.5 values observed in the North and central Ukraine with visible maximum in Kyiv city region.
Very low PM2.5 contamination in the atmosphere over all regions is observed in summer month ((c)). Over Kyiv city area, maximum PM2.5 concentration is calculated in the cold season of the year. The difference between the concentrations in March and July over Kyiv city according to the model is about 20–25 μg/m3 monthly average in March and about 10 μg/m3 in July.
The lowest PM2.5 concentrations are revealed almost during all seasons over the Black Sea and the Baltic Seas. The largest PM2.5 concentration over the Black Sea appeared in March over the seas when the values are less than 20 μg/m3. The seasonality of PM2.5 values over Kyiv city region is associated with the heating period, when large amount of coal and oil is burnt. Therefore, these variations are explained by anthropogenic load.
5.4. Impact of PMs on health
The health effects of inhalable PM are well documented. They are due to exposure over both the short term (hours, days) and long term (months, years) and include: respiratory and cardiovascular morbidity, such as aggravation of asthma, respiratory symptoms and an increase in hospital admissions; mortality from cardiovascular and respiratory diseases and from lung cancer (WHO Citation2013).
We provide a number of the automated sites for the observation of ambient air quality and sample selection stations according to the requirements of the EU Directive 2008/50/EC (EC Citation2008).
In Ukraine, existing hygienic standards envisage the assessment of ambient air quality only under acute inhalation effects (maximum allowable (averaging period is 20 min) and average daily). It requires the elaboration and the adoption of annual criteria of air quality assessment. It is also necessary to approve the standards for PM10 and PM2.5 for their monitoring.
As we can see from , the annual concentrations of PM10/PM2.5 are at a level that does not exceed the boundary values, recommended by WHO and Directive 2008/50/EC. In the same time, number of days in a year with an excess of daily average concentration for PM10 – 53 days, for PM2.5 – 84 days. These concentrations can lead to adverse effects on human health.
Table 2. Measurement data and limit values РМ10/РМ2.5.
The calculated AQI for PM10/PM2.5 shows that the responsible pollutant is РМ2.5 ():
58% of 24-h РМ2.5 concentration related to moderate AQI Category could cause the development of respiratory symptoms of unusually sensitive individuals, exacerbation of cardiovascular and pulmonary pathology of people suffering from chronic diseases and adults (EPA Citation2016).
5.5% of 24-h РМ2.5 concentration was at the level that increases the probability of development respiratory symptoms of elderly people, children, and people of lower socioeconomic status; aggravation of heart or lung disease and premature mortality of people with heart or lung disease.
1.1% of 24-h РМ2.5 concentration was regarded as unhealthy and besides the increased aggravation of respiratory symptoms in sensitive groups, increase in the frequency of exacerbations of pulmonary and cardiovascular pathologies and premature mortality of people with this pathology, could cause development respiratory effects in general population.
Table 3. Air quality index.
5.5. Detection of harmful concentrations of PMs and their impact on health
The steps of experimental bio-toxicological part of this study were as follows: (1) synthesize in laboratory conditions and collect wood smoke aerosol samples; (2) define their spectral characteristics; (3) determine the size distribution with air quality monitoring device; (4) assess the average size of the PM in suspension using dynamic light scattering; (5) prepare water-suspended wood smoke aerosol preparations suitable for further biological toxicity experiments; and (6) assess toxicity of these smoke preparations studying their ability to disrupt the integrity of the plasma membrane of actively functioning biological objects (i.e. isolated rat cortex presynaptic nerve terminals (synaptosomes)). Efficiency of water suspending of the smoke particulate matter was approximately 60% and was calculated by taking into account that PM2.5 was 800 µg/m3 before and 500 µg/m3 after the suspending procedure.
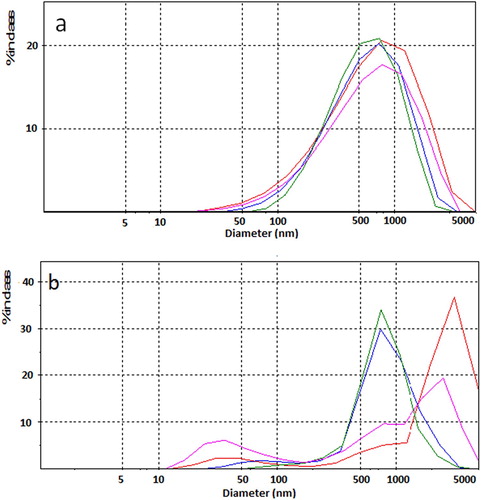
Analysis of the average size of the PM in water-suspended wood smoke aerosol preparations was performed by dynamic light scattering with the Zetasizer (Malvern Instruments, UK). Distribution of particles’ population by intensity ((a)) and volume ((b)) was assessed. Peak analysis by intensity revealed that particle suspension was stable in time with the overall mean of 809 nm. Peak analysis by volume showed particle heterogeneity in the aerosol samples. Three main particles’ populations were present in volume measurements with the average size of 53, 727 and 2211 nm.
Figure 6. Dynamic light-scattering histograms of water-suspended wood smoke aerosol preparations. Distribution of particle populations by intensity (a) and volume (b). Measurement was made during 1 min, sequentially marked in the histogram as lines 1–4.
The toxic effect of aerosol preparations was assessed by monitoring the parameter included in the Guidelines for Neurotoxicity Risk Assessment of US Environmental Protection Agency, 1998 (3.1.2. Animal Studies; 3.1.2.3. Neurochemical Endpoints of Neurotoxicity; 3.1.3.4. In Vitro Data in Neurotoxicology). Here, we show that if the dose of wood smoke particulate matter in the biological fluids even locally will exceed 40 µg/ml, the harmful biological effects can be expected. Water-suspended wood smoke aerosol preparations demonstrated toxic features disturbing the integrity of biological membranes and changing the plasma membrane potential (Em) that in turn can disturb the majority of membrane-associated functional processes in the cells. Therefore, the minimal dose of wood smoke particulate matter that can initiate harmful health effects was obtained.
These results should be consolidated in order to be used in environmental monitoring and modeling as EVs that can establish detailed relation of air quality with harmful health effects.
The experimental data obtained in this study can be considered in support of the recent paper review analysis accomplished in the frame of the H2020, ERA-PLANET SMURBS project and presented in (Borisova Citation2018; Borysov et al. Citation2018; Borisova Citation2019). It was underlined that PM2.5 air pollution was associated with a wide range of diseases, i.e. cardiovascular, pulmonary and neurological diseases including lowered cognitive function, autism, neurodegenerative disease, dementia in adults and stroke (Landrigan et al. Citation2018). Air pollution particulate matter can reach the central nervous system during inhalation and avoid the blood–brain barrier. So, the presence of abandoned carbon-containing particles in aerosols poses a potential toxicity risk to human health (Borisova Citation2018) and worldwide travelling air pollution particulate matter is now considered as a possible trigger factor for the development of a variety of cardiovascular, pulmonary and neurological pathologies.
6. Information technology and infrastructure for air quality EVs
Based on these results, new information technologies and infrastructure have been designed to streamline the production and management of air quality EVs.
6.1. Modern sensors development for the measurement of air quality EVs
There are several categories of low-cost sensors that are currently available: electrochemical sensors, metal oxide sensors, photo ionization detector, optical particle counters and optical sensors (e.g. Clements et al. Citation2017).
Electrochemical sensors are based on a chemical reaction between gases in the air and the electrode inside the sensor. In metal oxide sensor atmosphere gases react on the sensor surface and modify its resistance or conductivity. A photo ionization detector ionizes compounds and measures the resulting electrical current. Optical particle counters detect particulate pollutant by measuring the light scattered by particles. Optical sensors detect gases by measuring the absorption of infrared light.
Low-cost sensors include metal oxide sensors, some kind of electrochemical sensors, optical particle counters detect PM2.5 and PM10, and optical sensors for CO2.
For outdoor air quality monitoring we have developed a device measuring most of the indicators mentioned above. The structural diagram of this device is shown in .
Figure 7. Structural diagram for the proposed AQI measurement device.
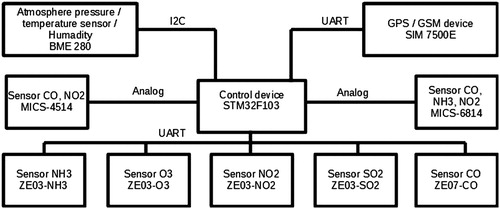
The best results can be obtained using electrochemical sensors (Clements et al. Citation2017). As follows from the figure, mainly electrochemical sensors are used in our system. Only for PM2.5 and PM10 we use optical particle counters and semiconductor sensors for CO, NO2 and NH3 additional measurements. This made the system relatively cheap with total price less than 1000$.
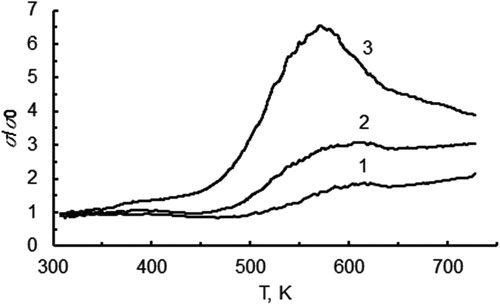
The main functionality of each metal oxide sensor is based on definite electrical dependencies. Thus, the MICS-4514 sensor, which we are using in our system typical temperature dependencies of the electrical conductivity at various CO concentrations in the air are shown in . When the temperature of the sample increases, its sensitivity is initially increased; however, at a temperature of about 550 K, the sensitivity decreases.
Figure 8. The MICS-4514 sensor’s temperature dependencies of the normalized electrical conductivity at CO concentrations in the air, ‰: 1–10; 2–50; 3–80.
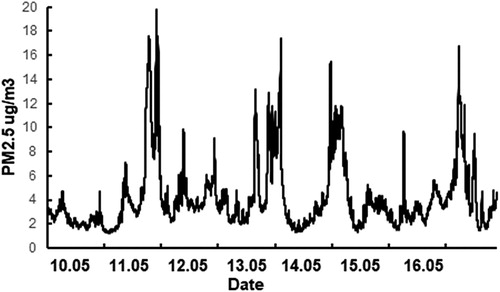
Similar characteristics are taken for all other sensors. Sensor data allows us to obtain air quality. For example, shows change of particulate matters up to 2.5 microns in size for several days. The obtained results are in a good agreement with the data of other sources.
Figure 9. Change density PM2.5 during a few days in May of year 2018.
The data quality is still the main problem of using low-cost air quality sensors. The review of these problems and the way to solve are discussed and proposed in (Clements et al. Citation2017).
6.2. GEO harmonized infrastructure for air quality EVs measurements
The proposed architecture is based on the following subsystems:
Data Collection (DC): this subsystem operates with data search and downloading routines with preparation of standardized data structure that serves as an input for the Data Processing Subsystem. It is planned that DC component will collect all publicly available satellite and in-situ data that are relevant to Air Quality Estimates. DC will interact with Data Storage (DS) subsystem for saving the collected data.
Data Processing (DP): this subsystem is intended to solve the problems with inconsistency of data that come from different sources. In particular, DP subsystem should perform data harmonization via coercion to comparable physical variables for satellite-based AQ estimates for selected pollutants with machine learning techniques (Skakun et al. Citation2016). DP subsystem also will serve the tasks of satellite products validation with available in-situ data (both official and obtained from citizen observations) as well as data fusion with different spatial and temporal resolution. As a result of DP, raw products will be provided to the Data Postprocessing system. DP will interact with DS subsystem for saving the obtained raw products.
Data Postprocessing (DPP): this subsystem will perform interpolation of Air Quality estimates obtained as raw products from DP subsystem with further interaction with DS subsystem for saving final products.
Data Storage (DS): this subsystem is based on local computational and storage resources with backing up to Amazon S3 storage. DS component operates as storage for DC, DP, DPP subsystems as well as for data visualization subsystems.
Data Visualization (DV): this subsystem will operate as a Web Mapping Service (WMS) and a Web Feature Server (WFS) hosted at the premises of Kyiv smart city and SRI with different set of available products addressed to different groups of end-users. It’ll be possible to visualize data at the web-portal via GIS-client, additionally data will be importable to GIS-software via WMS/WFS protocols.
Connection to the agents that are external to the developed AQ system will be performed via GEOSS platform connector that is a default way to interact with the GEOSS portal.
The GEOSS platform supports routine data access operations and treated as the architectural framework essential to supporting the GEO Data Sharing Principles. The utilization of GEOSS API is an efficient way to ensure service interoperability and standardization.
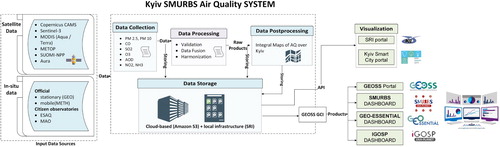
The GEOSS platform plays a key role providing the collected data from the storage system to the GEOSS Portal, and to the dashboards of the ERA-PLANET GEOEssential, SMURBS and IGOSP projects ().
Figure 10. Kyiv Air Quality System and connections with the GEOSS platform and ERA-PLANET projects.
6.3. Modern data sources on air quality and data access tools
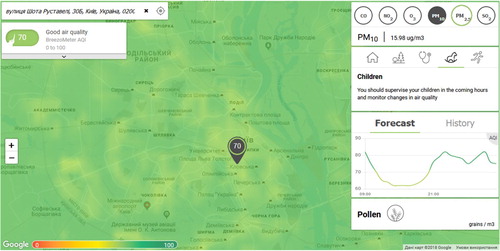
There are several data portals publicly available over the Internet that provide air quality estimates on a regular basis. Their data are of different nature and do not correspond to each other. For instance, one of the sources (https://breezometer.com) provides air quality estimates in the form of IndexofAirPollution from 0 to 100 with qualitative estimates named as Excellent (100), Fair (60–79), Moderate (40–50), Low (20–39) and Poor (0–19) (). The service calculates IndexofAirPollution from local monitoring stations, satellite and weather data, as well as mathematical models for pollutants distribution. Concentrations of carbon monoxide, nitrogen dioxide, ozone, sulfurous anhydride, together with solid and liquid particles in the air (PMs) are provided.
Figure 11. Air Quality Indicator – https://breezometer.com.
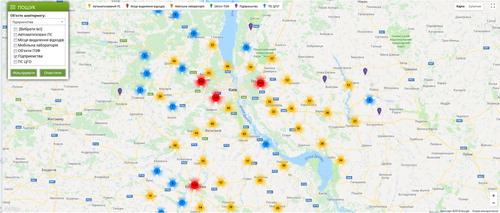
The other one is a portal of ecological monitoring of Kyiv region (http://www.ecobase.iisd.com.ua) that provides information on location (actually hot spots for potential air pollutant distribution) of garbage dumps, industrial objects, as well as locations of permanent posts of air quality monitoring operated by Central Geophysical Laboratory and automated monitoring stations (). This portal does not contain actual information on air quality estimates.
Figure 12. Database of ecological monitoring for the Kyiv region.
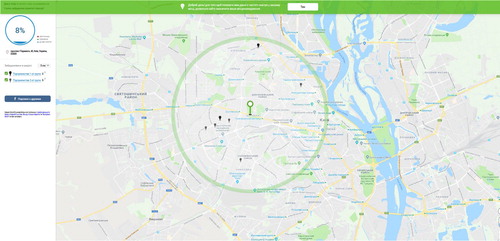
Another portal is ECOINFO (https://ecoinfo.pro) that provides information about air quality in percentage (from 0 to 100) (). Estimates are based on location of different industrial objects, observation stations of Ukrainian Hydrometeorological Center, and observation stations of industrial objects. At the moment, service performs estimates (Critical, Very critical, Normal levels) at point level based on location of various sources of pollutants within a radius of 5, 10 or 15 km.
Figure 13. ECOINFO portal, point level air quality estimates.
These sources of information could be valuable input for air quality assessment but these estimates are performed in non-harmonized manner and based on different datasets and different methods. The main challenge is the harmonization of the data from different sources and publishing ready to use information on air quality in the city portal and in GEOSS. The ERA-PLANET project in general, and the SMURBS and GEOEssential sub projects in particular, aim at provisioning information services from harmonized information. The main difference is the focus of these two projects – SMURBS focuses on information that is important for average citizen of smart city, while GEOEssential focuses on large scale products – both national and regional levels.
7. Conclusions
A comprehensive PM2.5/PM10 monitoring has been started in the framework of the H2020 projects ERA-PLANET SMURBS and GEOEssential, with the following scientific and management aims: (1) to establish an infrastructure to measure the PM2.5/PM10 load of the atmosphere over Kyiv city using modern monitoring instruments; (2) to create information tools and network for informing Kyiv city community on the state of PM pollution. It is planned that new infrastructure will be created on the basis of existing air quality monitoring stations, providing long-term PM2.5/PM10 observations, which potentially could be included in the AirBase network. The developed infrastructure will be a proxy for data exchange between standardized GEOSS platform and local state geospatial portals of the Kyiv city.
It was found that in Kyiv the annual concentration of РМ10 is about 35 μg/m3 and РМ2.5 – 22 μg/m3. The number of days in a year with an excess of daily average concentration for PM10 measured during 53 days, for PM2.5 – 84 days. The calculations of AQI for РМ10/РМ2.5 showed that the most significant pollutant is РМ2.5. The preventive measures are needed to reduce the impact of PM on human health according to AQI indices data.
For the preliminary evaluations of the PM2.5 and PM10 contamination in different regions of Kyiv city, the measurements using mobile monitor SDL607 in Kyiv were carried out. The average monthly PM2.5 and PM10 values were determined. It was found a significant excess of maximum allowed daily PM2.5 values according to the EPA standards from January to March. The average values of PM2.5 more than 2 times exceeded the PM2.5 level for the average annual values of the EEA. In May, the average PM2.5 and PM10 values are relatively low. These were three times less than in January–March period. The reason for this significant reduction in pollution can be connected with the start–end of the heating season.
The pollution of suspended particles PM2.5 and PM10 in several districts of Kyiv were estimated. It was found that the level of urban pollution in Ukraine is close to these parameters in some European cities, and is much lower than, for example, in Changchun city (China). For better understanding the dependencies and average levels of contamination by PM2.5 and PM10, it is necessary to receive regular data, especially in the permanent sites in different areas of Kyiv city.
The experiments dedicated to study the influence of PM on human health have revealed the minimal dose of wood smoke PM that can initiate harmful health effects. It was shown that PM 2.5 air pollution poses potential toxicity risk and triggers the development of neurological pathologies.
A cheap device for measurement of the number of air pollution indicators for outdoor air quality monitoring have been developed and tested. A GEO harmonized infrastructure for air quality measurements have been designed. We plan to provide air quality data to GEOSS Portal.
Finally, while the discussion about a set of EVs for air quality estimation is still continuing, it is proposed that the set of EAQVs could be a part of Urban EVs and Health EVs.
Acknowledgement
The authors are grateful to Tatyana Maremukha from Laboratory of Air Quality, Marzeiev Institute for Public Health, National Academy of Medical Science of Ukraine, Kyiv, Ukraine for provision results of PM data analysis in Table 2.
Disclosure statement
No potential conflict of interest was reported by the authors.
ORCID
Andrii Shelestov http://orcid.org/0000-0001-9256-4097
Andrii Kolotii http://orcid.org/0000-0002-6972-4483
Additional information
Funding
References
- Beloconi, A., Y. Kamarianakis, and N. Chrysoulakis. 2016. “Estimating Urban PM10 and PM2.5 Concentrations, Based on Synergistic MERIS/AATSR Aerosol Observations, Land Cover and Morphology Data.” Remote Sensing of Environment 172: 148–164. doi:10.1016/j.rse.2015.10.017.
- Bey, I., D. J. Jacob, R. M. Yantosca, J. A. Logan, B. D. Field, A. M. Fiore, Q. Li, H. Y. Liu, L. J. Mickley, and M. G. Schultz. 2001. “Global Modeling of Tropospheric Chemistry with Assimilated Meteorology: Model Description and Evaluation.” Journal of Geophysical Research: Atmospheres 106 (D19): 23073–23095. doi:10.1029/2001JD000807.
- Birmili, W., K. Schepanski, A. Ansmann, G. Spindler, I. Tegen, B. Wehner, A. Nowak, et al. 2008. “A Case of Extreme Particulate Matter Concentrations Over Central Europe Caused by Dust Emitted Over the Southern Ukraine.” Atmospheric Chemistry and Physics 8: 997–1016. doi:10.5194/acp-8-997-2008.
- Bojinski, S., M. Verstraete, T. C. Peterson, C. Richter, A. Simmons, and M. Zemp. 2014. “The Concept of Essential Climate Variables in Support of Climate Research, Applications, and Policy.” Bulletin of the American Meteorological Society 95: 1431–1443. doi:10.1175/BAMS-D-13-00047.1.
- Bombelli, A., J. Masó, I. Serral, H.-P. Plag, J.-P. Shelley, P. Blonda, and S. Nativi. 2016. “D2.3: Proposal of EVs for Selected Themes.” https://ddd.uab.cat/record/163483.
- Bombelli, A., I. Serral, P. Blonda, J. Masó, H.-P. Plag, J.-P. Shelley, and I. McCallum. 2015. “D2.2. EVs Current Status in Different Communities and Way to Move Forward.” https://ddd.uab.cat/record/146882.
- Borisova, Tatiana. 2013. Cholesterol and Presynaptic Glutamate Transport in the Brain. New York: Springer. doi.org/10.1007/978-1-4614-7759-4.
- Borisova, Tatiana. 2014. “The Neurotoxic Effects of Heavy Metals: Alterations in Acidification of Synaptic Vesicles and Glutamate Transport in Brain Nerve Terminals.” In Horizons in Neuroscience Research, edited by Andres Costa and Eugenio Villalba, 89–112. New York: Nova Science.
- Borisova, T. 2016. “Permanent Dynamic Transporter-Mediated Turnover of Glutamate Across the Plasma Membrane of Presynaptic Nerve Terminals: Arguments in Favor and Against.” Reviews in the Neurosciences 27 (1): 71–81. doi:10.1515/revneuro-2015-0023.
- Borisova, T. 2018. “Nervous System Injury in Response to Contact with Environmental, Engineered and Space Micro- and Nano-Sized Particles.” Frontiers in Physiology. doi:10.3389/fphys.2018.00728.
- Borisova, T. 2019. “Express Assessment of Neurotoxicity of Particles of Planetary and Interstellar Dust.” npj Microgravity 5 (1). doi:10.1038/s41526-019-0062-7.
- Borisova, T., and A. Borysov. 2016. “Putative Duality of Presynaptic Events.” Reviews in the Neurosciences 27 (4): 377–383. doi:10.1515/revneuro-2015-0044.
- Borisova, T., A. Borysov, A. Pastukhov, and N. Krisanova. 2016. “Dynamic Gradient of Glutamate Across the Membrane: Glutamate/Aspartate-Induced Changes in the Ambient Level of l-[14C]Glutamate and d-[3H]Aspartate in Rat Brain Nerve Terminals.” Cellular and Molecular Neurobiology 36 (8): 1229–1240. doi:10.1007/s10571-015-0321-4.
- Borysov, A., N. Pozdnyakova, A. Pastukhov, and T. Borisova. 2018. “Comparative Analysis of Neurotoxic Potential of Synthesized, Native, and Physiological Nanoparticles.” In Use of Nanoparticles in Neuroscience, edited by F. Santamaria and X. Peralta, 203–229. New York: Springer.
- Bovchaliuk, A. 2013a. “The Spatial Variability of PM2.5 Over Europe Using Satellite POLDER-3/PARASOL Data.” Advances in Astronomy and Space Physics 3 (2): 102–108. http://aasp.kiev.ua/index.php?text=v3-102-108-BovchaliukA.
- Bovchaliuk, A. P. 2013b. “Вплив пожеж на розподіл аерозолю над Україною за даними супутникових та наземних вимірювань.” [ Fire Impact on Aerosol Distribution Over Ukraine From Satellite and Ground-Based Measurements]. Space Science and Technology 19 (5): 27–41.
- Clements, A. L., W. G. Griswold, A. Rs, J. E. Johnston, M. M. Herting, J. Thorson, A. Collier-Oxandale, and M. Hannigan. 2017. “Low-Cost Air Quality Monitoring Tools: From Research to Practice (a Workshop Summary).” Sensors 17 (11): 2478. doi:10.3390/s17112478.
- Danylevsky, V., V. Ivchenko, G. Milinevsky, A. Grytsai, M. Sosonkin, Ph Goloub, Z. Li, and O. Dubovik. 2011. “Aerosol Layer Properties Over Kyiv From AERONET/PHOTONS Sunphotometer Measurements During 2008–2009.” International Journal of Remote Sensing 32 (3): 657–669. doi.10.1080/01431161.2010.517798.
- Dubovik, O., M. Herman, A. Holdak, T. Lapyonok, D. Tanré, J. L. Deuzé, F. Ducos, A. Sinyuk, and A. Lopatin. 2011. “Statistically Optimized Inversion Algorithm for Enhanced Retrieval of Aerosol Properties From Spectral Multi-Angle Polarimetric Satellite Observations.” Atmospheric Measurement Techniques 4: 975–1018. doi:10.5194/amt-4-975-2011 doi: 10.5194/amt-4-975-2011
- Dumitrache, R. C., A. Iriza, B. A. Maco, C. D. Barbu, M. Hirtl, S. Mantovani, O. Nicola, et al. 2016. “Study on the Influence of Ground and Satellite Observations on the Numerical Air-Quality for PM10 Over Romanian Territory.” Atmospheric Environment 143: 278–289. doi:10.1016/j.atmosenv.2016.08.063.
- EC (European Commission). 2004. “Directive 2004/107/EC of the European Parliament and of the Council of 15 December 2004 Relating to Arsenic, Cadmium, Mercury, Nickel and Polycyclic Aromatic Hydrocarbons in Ambient Air.” https://eur-lex.europa.eu/eli/dir/2004/107/oj.
- EC (European Commission). 2008. “Directive 2008/50/EC of the European Parliament and of the Council of 21 May 2008 on Ambient Air Quality and Cleaner Air for Europe.” http://extwprlegs1.fao.org/docs/pdf/eur80016.pdf.
- ECOSOC (United Nations Economic and Social Council, Statistical Commission). 2017. “Report of the Inter-Agency and Expert Group on Sustainable Development Goal Indicators.” UN Doc. E/CN.3/2017/2. https://unstats.un.org/unsd/statcom/48th-session/documents/2017-2-IAEG-SDGs-E.pdf.
- EEA (European Environmental Agency). 2016. “Air Quality in Europe – 2016 Report.” http://www.eea.europa.eu/publications/air-quality-in-europe-2016.
- EPA (U.S. Environmental Protection Agency). 2016. “Technical Assistance Document for the Reporting of Daily Air Quality – The Air Quality Index (AQI).” U.S. Environmental Protection Agency, Office of Air Quality Planning and Standards, Research Triangle Park, NC. Publication No. EPA-454/B-16-002. May.
- Galytska, E., V. Danylevsky, R. Hommel, and J. P. Burrows. 2018. “Increased Aerosol Content in the Atmosphere Over Ukraine During Summer 2010.” Atmospheric Measurement Techniques 11: 2101–2118. doi:10.5194/amt-11-2101-2018.
- GEO (Group on Earth Observations). 2010. “GEO Task US-09-01a: Critical Earth Observations Priorities. Health Societal Benefit Area: Air Quality.” https://sbageotask.larc.nasa.gov/AirQuality_US0901a-FINAL.pdf.
- Guo, H., T. Cheng, X. Gu, H. Chen, Y. Wang, F. Zheng, and K. Xiang. 2016. “Comparison of Four Ground-Level PM2.5 Estimation Models Using PARASOL Aerosol Optical Depth Data From China.” International Journal of Environmental Research and Public Health 13 (2): 180. doi:10.3390/ijerph13020180.
- Kabashnikov, V., G. Milinevsky, A. Chaikovsky, N. Miatselskaya, V. Danylevsky, A. Aculinin, D. Kalinskaya, et al. 2014. “Localization of Aerosol Sources in East-European Region by Back-Trajectory Statistics.” International Journal of Remote Sensing 35: 6993–7006. doi:10.1080/01431161.2014.960621.
- Kacenelenbogen, M., J.-F. Léon, I. Chiapello, and D. Tanré. 2006. “Characterization of Aerosol Pollution Events in France Using Ground-Based and POLDER-2 Satellite Data.” Atmospheric Chemistry and Physics 6: 4843–4849. doi:10.5194/acp-6-4843-2006.
- Kussul, N., A. Kolotii, A. Shelestov, B. Yailymov, and M. Lavreniuk. 2017a. “Land Degradation Estimation from Global and National Satellite Based Datasets Within UN Program.” In 2017 9th IEEE International Conference on Intelligent Data Acquisition and Advanced Computing Systems: Technology and Applications (IDAACS), Vol. 1, 383–386.
- Kussul, N., M. Lavreniuk, S. Skakun, and A. Shelestov. 2017b. “Deep Learning Classification of Land Cover and Crop Types Using Remote Sensing Data.” IEEE Geoscience and Remote Sensing Letters 14 (5): 778–782. doi: 10.1109/LGRS.2017.2681128
- Kussul, N., G. Lemoine, F. J. Gallego, S. Skakun, M. Lavreniuk, and A. Shelestov. 2016. “Parcel-Based Crop Classification in Ukraine Using Landsat-8 Data and Sentinel-1A Data.” IEEE Journal of Selected Topics in Applied Earth Observations and Remote Sensing 9 (6): 2500–2508. doi: 10.1109/JSTARS.2016.2560141
- Kussul, N., S. Skakun, A. Shelestov, O. Kravchenko, F. J. Gallego, and O. Kussul. 2012. “Crop Area Estimation in Ukraine Using Satellite Data within the MARS Project.” In 2012 IEEE International Geoscience and Remote Sensing Symposium, 3756–3759.
- Kussul, N., S. Skakun, A. Shelestov, and O. Kussul. 2014. “The Use of Satellite SAR Imagery to Crop Classification in Ukraine within JECAM Project.” In 2014 IEEE Geoscience and Remote Sensing Symposium, 1497–1500.
- Landrigan, Philip J., Richard Fuller, Nereus J. R. Acosta, Olusoji Adeyi, Robert Arnold, Niladri (Nil) Basu, Abdoulaye Bibi Baldé, et al. 2018. “The Lancet Commission on Pollution and Health.” The Lancet 391 (10119): 462–512. doi:10.1016/S0140-6736(17)32345-0.
- Lawford, R. 2014. The GEOSS Water Strategy: From Observations to Decisions. Geneva: Group on Earth Observations. ftp://ftp.earthobservations.org/TEMP/Water/GEOSS_WSR_Full_Report.pdf.
- Lee, H. J., R. B. Chatfield, and A. W. Strawa. 2016. “Enhancing the Applicability of Satellite Remote Sensing for PM2.5 Estimation Using MODIS Deep Blue AOD and Land Use Regression in California, United States.” Environmental Science & Technology 50 (12): 6546–6555. doi:10.1021/acs.est.6b01438.
- Lehmann, A., S. Nativi, P. Mazzetti, J. Maso, I. Serral, D. Spengler, A. Niamir, et al. 2019. “GEOEssential – Mainstreaming Workflows From Essential Variables to Environment Policy Indicators.” International Journal of Digital Earth. https://www.tandfonline.com/doi/full/10.1080/17538947.2019.1585977?af=R.
- Lin, C. Q., G. Liu, A. K. H. Lau, Y. Li, C. C. Li, J. C. H. Fung, and X. Q. Lao. 2018. “High-Resolution Satellite Remote Sensing of Provincial PM2.5 Trends in China From 2001 to 2015.” Atmospheric Environment 180: 110–116. doi:10.1016/j.atmosenv.2018.02.045.
- Miatselskaya, N., V. Kabashnikov, G. Milinevsky, A. Chaikovsky, V. Danylevsky, and V. Bovchaliuk. 2016. “Atmospheric Aerosol Distribution in the Belarus-Ukraine Region by the GEOS–Chem Model and AERONET Measurements.” International Journal of Remote Sensing 37 (14): 3181–3195. doi:10.1080/01431161.2016.1194541.
- Milinevsky, G., and V. Danylevsky. 2018. “Atmospheric Aerosol Over Ukraine Region: Current Status of Knowledge and Research Efforts.” Frontiers in Environmental Science 6: 59. doi:10.3389/fenvs.2018.00059.
- Milinevsky, G., V. Danylevsky, V. Bovchaliuk, A. Bovchaliuk, Ph Goloub, O. Dubovik, V. Kabashnikov, et al. 2014. “Aerosol Seasonal Variations Over Urban–Industrial Regions in Ukraine According to AERONET and POLDER Measurements.” Atmospheric Measurement Techniques 7: 1459–1474. doi:10.5194/amt-7-1459-2014.
- Molod, A., L. Takacs, M. Suarez, J. Bacmeister, I.-S. Song, and A. Eichmann. 2012. “The GEOS-5 Atmospheric General Circulation Model: Mean Climate and Development from MERRA to Fortuna.” NASA Goddard Space Flight Center; Greenbelt, MD, United States, Technical Report Series on Global Modeling and Data Assimilation. https://ntrs.nasa.gov/search.jsp?R=20120011790.
- O'Neill, N. T., T. F. Eck, A. Smirnov, B. N. Holben, and S. Thulasiraman. 2003. “Spectral Discrimination of Coarse and Fine Mode Optical Depth.” Journal of Geophysical Research 108 (D17): 4559–4573. doi:10.1029/2002JD002975.
- Schaap, M., A. Apituley, R. M. A. Timmermans, R. B. A. Koelemeijer, and G. de Leeuw. 2009. “Exploring the Relation Between Aerosol Optical Depth and PM2.5 at Cabauw, the Netherlands.” Atmospheric Chemistry and Physics 9: 909–925. doi:10.5194/acp-9-909-2009.
- Sciare, J., K. Oikonomou, O. Favez, E. Liakakou, Z. Markaki, H. Cachier, and N. Mihalopoulos. 2008. “Long-Term Measurements of Carbonaceous Aerosols in the Eastern Mediterranean: Evidence of Long-Range Transport of Biomass Burning.” Atmospheric Chemistry and Physics 8: 5551–5563. doi:10.5194/acp-8-5551-2008.
- Segura, S., V. Estellés, M. P. Utrillas, and J. A. Martínez-Lozano. 2017. “Long Term Analysis of the Columnar and Surface Aerosol Relationship at an Urban European Coastal Site.” Atmospheric Environment 167: 309–322. doi:10.1016/j.atmosenv.2017.08.012.
- Shelestov, A., A. Kolotii, S. Skakun, B. Baruth, R. Lopez Lozano, and B. Yailymov. 2017a. “Biophysical Parameters Mapping Within the SPOT-5 Take 5 Initiative.” European Journal of Remote Sensing 50 (1): 300–309. doi: 10.1080/22797254.2017.1324743
- Shelestov, A., M. Lavreniuk, N. Kussul, A. Novikov, and S. Skakun. 2017b. “Exploring Google Earth Engine Platform for Big Data Processing: Classification of Multi-Temporal Satellite Imagery for Crop Mapping.” Frontiers in Earth Science 5: 17. doi: 10.3389/feart.2017.00017
- Skakun, S., N. Kussul, A. Shelestov, and O. Kussul. 2015. “The Use of Satellite Data for Agriculture Drought Risk Quantification in Ukraine.” Geomatics, Natural Hazards and Risk 7 (3): 901–917. doi: 10.1080/19475705.2015.1016555
- Skakun, S., N. Kussul, A. Shelestov, M. Lavreniuk, and O. Kussul. 2016. “Efficiency Assessment of Multitemporal C-Band Radarsat-2 Intensity and Landsat-8 Surface Reflectance Satellite Imagery for Crop Classification in Ukraine.” IEEE Journal of Selected Topics in Applied Earth Observations and Remote Sensing 9 (8): 3712–3719. doi: 10.1109/JSTARS.2015.2454297
- van Donkelaar, A., R. V. Martin, R. C. Levy, A. M. da Silva, M. Krzyzanowski, N. E. Chubarova, E. Semutnikova, and A. J. Cohen. 2011. “Satellite-Based Estimates of Ground-Level Fine Particulate Matter During Extreme Events: A Case Study of the Moscow Fires in 2010.” Atmospheric Environment 45: 6225–6232. doi:10.1016/j.atmosenv.2011.07.068.
- Vienneau, D., K. de Hoogh, M. J. Bechle, R. Beelen, A. van Donkelaar, R. V. Martin, D. B. Millet, G. Hoek, and J. D. Marshall. 2013. “Western European Land Use Regression Incorporating Satellite- and Ground-Based Measurements of NO2 and PM10.” Environmental Science & Technology 47 (23): 13555–13564. doi:10.1021/es403089q.
- WHO (World Health Organization). 2006. “WHO Air Quality Guidelines for Particulate Matter, Ozone, Nitrogen Dioxide and Sulfur Dioxide: Global Update 2005. Summary of Risk Assessment.” http://apps.who.int/iris/bitstream/10665/69477/1/WHO_SDE_PHE_OEH_06.02_eng.pdf.
- WHO (World Health Organization). 2013. “Health Effects of Particulate Matter. Policy Implications for Countries in Eastern Europe, Caucasus and central Asia.” http://www.euro.who.int/__data/assets/pdf_file/0006/189051/Health-effects-of-particulate-matter-final-Eng.pdf.
- WHO (World Health Organization). 2016. “Ambient Air Pollution: A Global Assessment of Exposure and Burden of Disease”. http://apps.who.int/iris/bitstream/handle/10665/250141/9789241511353-eng.pdf.