
ABSTRACT
There is a growing recognition of the interdependencies among the supply systems that rely upon food, water and energy. Billions of people lack safe and sufficient access to these systems, coupled with a rapidly growing global demand and increasing resource constraints. Modeling frameworks are considered one of the few means available to understand the complex interrelationships among the sectors, however development of nexus related frameworks has been limited. We describe three open-source models well known in their respective domains (i.e. TerrSysMP, WOFOST and SWAT) where components of each if combined could help decision-makers address the nexus issue. We propose as a first step the development of simple workflows utilizing essential variables and addressing components of the above-mentioned models which can act as building-blocks to be used ultimately in a comprehensive nexus model framework. The outputs of the workflows and the model framework are designed to address the SDGs.
1. Introduction
Human demands for the consumption of food, water and energy are all forecast to continue rising in the coming decades (OECD Citation2012; Rasul Citation2016). The challenge will be to meet these increasing demands with a sustainable and affordable supply of these services for all (Obersteiner et al. Citation2016). Nexus frameworks are considered one of the only means available for decision makers to understand the complex interrelationships among the food, water and energy sectors, however development of nexus related frameworks has been limited. Exceptions include publications which among others address climate change (Byers et al. Citation2018; Parkinson et al. Citation2019) and water (Kahil et al. Citation2018). Most existing global models are however largely resource-centric, meaning that individual models are primarily designed to address the impacts on and or management of a single resource and its associated supply chain. However, there is a growing awareness of the relationships between different sectors, leading to the concept of the food, water and energy (FWE) nexus approach. Given these interdependencies, the concept of nexus thinking (Ringler, Bhaduri, and Lawford Citation2013) is taking hold within the global modeling community. In our study, we define the food, water and energy nexus as being any effort which considers at least two of the three components to some degree.
In this study, we investigate three open-source models for their potential application as part of a nexus framework. They include the Terrestrial System Modeling Platform (TerrSysMP) (Gasper et al. Citation2014; Shrestha et al. Citation2014), the Soil and Water Assessment Tool (SWAT) (Abbaspour et al. Citation2015) and the World Food Studies (WOFOST) (Ceglar et al. Citation2018) model. Ideally, development of a single nexus model may potentially be the way forward but coupling compartmental models to an FWE framework is likely a more pragmatic way to advance at this stage. This also eases the implementation of advances in single compartments, especially if this is designed in a plug and play fashion. Hence, we recommend moving forward with basic components of individual models via the implementation of workflows (). These workflows will rely on the use of Earth Observation (EO) data wherever possible and, in order to harmonize the data inputs, will rely on the use of Essential Variables (EVs).
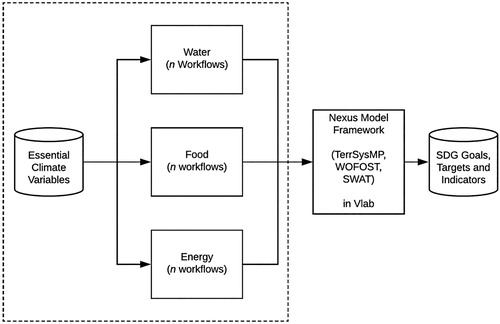
Figure 1. The general framework of the study. Drawing from the essential climate variables, n number of workflows are created for each of the water, food and energy sectors as required. Outputs from these workflows are standardized in terms of spatial and temporal resolution and then feed into a nexus model framework (which may include components of the TerrSysMP, WOFOST and SWAT models or others) in a Virtual Laboratory. This study focuses on the elements within the dashed box.
The 2030 Agenda for Sustainable Development provides a universal agenda for all countries and stakeholders to address the nexus challenge. The agenda is anchored by seventeen Sustainable Development Goals (SDGs), associated Targets, and a global Indicator Framework. Collectively, these elements enable countries and the global community to measure, manage, and monitor progress on economic, social and environmental sustainability, providing guidance for humanity to prosper in the long term (Griggs et al. Citation2013). In order to anchor this effort to a global policy agenda, outputs from both the workflows and the nexus framework will be designed to address the SDGs.
2. Data and methods
2.1. Essential variables
Essential Variables (EVs) are increasingly used in EO communities to identify those variables that have a high socioeconomic impact with a priority in designing, deploying and maintaining observation and model systems, and making data and products available. The concept of EVs assumes that there are a (small) number of variables that are essential to characterize the state and trends in a system without losing significant information. It is that set of variables that needs to be observed if past changes in the system are to be documented and if predictability of future changes is to be developed. Identifying this set of EVs allows for a commitment of inherently scarce resources to the essential observation needs. It also supports and eases the management of data and observations all along the chain from the actual measurement, through the processing of raw data to the delivery of products, information and services needed by end users. By far the most established sets of essential variables to date are in the climate (Bojinski et al. Citation2014) and biodiversity (Pereira et al. Citation2013) domains. Essential Climate Variables (ECVs) include precipitation, temperature, land cover and others while Essential Biodiversity Variables (EBVs) include species distribution, habitat structure, nutrient retention and more.
2.2. EO data
The rapidly increasing EO capacity is greatly expanding the ability to provide information that is complimentary to individual measurements, e.g. to interpolate point data, integrate observations at different scales, and estimate unmeasured quantities (NRC Citation2008). In a nexus approach, model frameworks are able to clarify links and to uncover hidden and complex connections between compartments. Moreover, models can also be used to forecast future and hindcast past conditions, and to simulate hypothetical scenarios. The integration of EO data into models can be performed in different ways. The most straightforward and often applied method is the use of EO data as a driving force (e.g. meteorological data) and as a parameter (e.g. land cover). Model states (e.g. soil water content) can be updated by a data assimilation (DA) procedure, typically by analysis of the specific model and observation uncertainties (Reichle et al. Citation2013). Often applied are Bayesian DA methods such as the Ensemble Kalman Filter (Evensen Citation1994) and the Particle Filter (Gordon, Salmond, and Smith Citation1993), but also variational approaches such as 4D-VAR (Courtier, Thépaut, and Hollingsworth Citation1994).
As a FWE nexus covers a broad spectrum of conditions for potential EO DA, multi-variate DA for state updating, i.e. the simultaneous assimilation of observation data for multiple model state variables into a simulation model, will gain importance (Han et al. Citation2013; Kaminski et al. Citation2012; Montzka et al. Citation2012). The assimilation of fluxes such as evapotranspiration (i.e. latent heat flux) is questionable and much care is needed in the implementation of the assimilation procedure. The reason is that models typically calculate discrete time steps which contradicts with fluxes which determine the rate of flow of some quantity from one time-step to another. In the following we describe a selection of FWE nexus capable models with different model structure philosophies and DA abilities. In a data assimilation system, it is critical to understand and manage terrestrial systems.
To ensure that the available EO data (e.g. Copernicus Services) is in a suitable format for uptake by the models, machine learning algorithms will be employed to develop Reduced-Order Models (ROMs) of satellite data. These ROMs can then effectively be employed in developing dynamic simulators for the Essential Variables of interest. Within this context, we will investigate techniques to describe the time-evolution of the considered quantities, e.g. soil moisture, by means of kernel-based methods, a set of machine learning approaches that are of wide-spread use and allow a tight coupling with the called Caratheodory-Tchakaloff Least Squares (CTLS) approach (Piazzon, Sommariva, and Vianello Citation2017). The basic idea behind these kinds of schemes allows anyone to implicitly compute vector similarities by means of appropriate scalar products. We will study the applicability of several approaches that utilize different Radial Basis Functions, assess the accuracy and stability properties, and identify suitable changes of basis that minimize the condition numbers of the systems to be solved to ensure solvability and computational efficiency.
It is envisaged that the EO data required for this study will be sourced from a database of EVs being produced in the context of the GEOEessential project (http://www.geoessential.eu/). Specifically an EV service is to be developed which will host a variety of EO derived data. This will have the advantage that data will be harmonized, standardized, etc., and that data processing will be minimized. Data included in this database will include but not be limited to Copernicus data.
2.3. Models
Three models are considered for this study: namely TerrSysMP, SWAT and WOFOST which are described further below. These models were chosen for this study because the authors had access to the model code and/or were involved in the development of the models, the models each addressed at least one aspect of the FWE nexus, the models are open-source and the models lent themselves to the use of earth observation data. However, many models would lend themselves to this study, including among others BIOME-BGC (Ryu, Berry, and Baldocchi Citation2019) and GLOBIOM (Havlík et al. Citation2014). These models or components of them will appear in whole or in part in the nexus model framework to be hosted in the Virtual Laboratory (Vlab).
2.3.1. TerrSysMP
The Terrestrial Systems Modeling Platform (TerrSysMP), closes the terrestrial water and energy cycles and also biogeochemical cycles from groundwater across the land surface into the atmosphere (Shrestha et al. Citation2014). TerrSysMP allows for a physically-based representation of transport processes across scales down to sub-km resolution with explicit feedbacks between the individual compartments. TerrSysMP consists of three component models that are COSMO for the atmosphere (Baldauf et al. Citation2011; Doms and Schättler Citation2002), the Community Land Model (CLM) for the land surface (Oleson et al. Citation2008) and ParFlow for the surface-subsurface (Jones and Woodward Citation2001; Kollet and Maxwell Citation2006).
The component models are coupled in a modular fashion using OASIS3-MCT (Valcke Citation2013), which allows to remove different components in a plug-and-play fashion and perform, e.g. offline hydrologic simulations replacing the dynamics of the atmosphere with an atmospheric forcing time series. In fully coupled mode, TerrSysMP provides all states and fluxes of the terrestrial water and energy cycle from groundwater to atmosphere. The platform has been applied in a number of verification and experimental simulations studies (Keune et al. Citation2016; Sulis et al. Citation2017) from regional domains to the European continent including a study on the impact of human water use on the terrestrial cycles (Keune et al. Citation2016). More information is available online.
2.3.2. SWAT
The Soil and Water Assessment Tool (SWAT) has been applied in studies ranging from catchment to continental scales (Gassman, Sadeghi, and Srinivasan Citation2014). The SWAT program is a comprehensive, semi-distributed, continuous-time, process-based model (Abbaspour et al. Citation2015). The calibrated model and results provide information support to the European Water Framework Directive and lay the basis for further assessment of the impact of climate change on water availability and quality.
The approach and methods developed are general and can be applied to any large region around the world. Among other impediments to the SWAT model, a lack of data on soil moisture and/or deep aquifer percolation prevents calibration/validation of these components. There exists however an abundance of soil moisture data both in-situ (Gruber et al. Citation2013) and EO-derived (Bauer-Marschallinger et al. Citation2019) and investigations will take place to see how this could be applied within SWAT.
2.3.3. WOFOST
WOFOST (WOrld FOod STudies) is a simulation model for the quantitative analysis of the growth and production of annual field crops. From a spatial perspective WOFOST is a one-dimensional simulation model, i.e. without reference to a geographic scale. This is resolved by splitting the model spatial domain into small spatial units where the model inputs (weather, crop, soil, management) can be assumed constant (i.e. response units). In Europe, WOFOST is typically applied at spatial units of 25 × 25 or 50 × 50 km. From a temporal perspective, WOFOST typically simulates crop growth with a temporal resolution of one day.
It is a mechanistic and dynamic model that explains crop growth on the basis of the underlying processes, such as photosynthesis, respiration and how these processes are influenced by environmental conditions (Ceglar et al. Citation2018). With WOFOST, one can calculate attainable crop production, biomass, water use, etc. for a location given knowledge about soil type, crop type, weather data and crop management factors (e.g. sowing date). To be able to deal with the ecological diversity of agriculture, three hierarchical levels of crop growth can be distinguished: potential growth, limited growth and reduced growth. Each of these growth levels corresponds to a level of crop production: potential, limited and reduced production. More information is available online.
2.4. Model nexus workflows
Workflows were designed to produce nexus related outputs in a simplified manner which could ultimately be ingested by a nexus framework. Scientific workflows have emerged to tackle the problem of excessive complexity in scientific experiments and applications. They provide a formal description of a process for accomplishing a scientific objective, typically expressed in terms of tasks and data dependencies among them. They allow users to easily express multi-step computational tasks, for example retrieve data from an instrument or a database, reformat the data, and run an analysis.
One of the major properties of a scientific workflow is that it manages data flow. The tasks in a scientific workflow can be anything from short serial tasks to very large parallel tasks surrounded by a large number of small, serial tasks used for pre- and post-processing. Workflows can vary from simple to complex. Various types of tasks that can be performed within a workflow can be implemented by local services, remote Web services, scripts, and sub-workflows (complete workflows used as subroutines in larger ones). Each component is only responsible for a small fragment of functionality; therefore, many components need to be chained in a pipeline in order to obtain a workflow that can perform a useful task.
The following initial demonstration workflows have been designed for this study:
focus on water-stress
focus on productive agriculture
focus on water extent
These initial workflows are for demonstration purposes only, with more to follow for each of the nexus domains (food, energy and water). The intention was to generate simple tasks which when run in parallel would then populate the nexus framework. These workflows could then provide input to the above-mentioned models in the nexus framework or components of those models or could be combined in other ways to create a nexus framework. The spatial extent of all workflows will cover continental Europe. The baseline year is set to 2015 to align with the SDGs, however, we will consider previous years to understand trends. Daily to annual timesteps shall be applied across the workflows. A spatial resolution of 1km2 is applied across all workflows as an initial starting point. In order to simplify the process at this stage, and to align the efforts with the SDGs, we have chosen a representative SDG indicator which will be addressed by each workflow.
2.5. Nexus model framework (virtual laboratory)
Beyond the scope of this study, the intention is to utilize the Virtual Laboratory Platform (VLab) which allows for the connection of resource users to resource producers through an intermediate service layer that will harmonize the various resources (data, workflows, models, etc.) and expose them as web services. This will provide a unique environment in which to establish a nexus framework.
3. Results & discussion
The three initial workflow examples described below utilize components from each of the respective models along with EO data, to produce nexus relevant output. Many more workflows would need to be developed within each of the sectors. Ultimately these would then be brought together in a nexus framework. Combining these three workflows, we obtain an image for Europe over time of the levels of water stress, the proportion of area under sustainable agriculture and the extent of surface water.
3.1. Workflows
3.1.1. Water stress
This workflow is partially addressing SDG indicator 6.4.2: the level of water stress.
Crop yield is severely affected during drought (water-stress) conditions. Crops in an early stage of drought stress may show reduced yield, in a later stage they may change over to early senescence. Groundwater abstraction and river basin management (Famiglietti Citation2014) are strategies to mitigate crop-related water stress, but the issue of sustainability is largely not considered. EO can observe important compartments of the water cycle, e.g. groundwater storage change by the Gravity Recovery and Climate Experiment (GRACE-FO) (Fletcher et al. Citation2016), soil moisture estimation by the Soil Moisture Ocean Salinity (SMOS) mission (Kerr et al. Citation2010), river discharge by the TOPEX/Poseidon mission (Zakharova et al. Citation2006), and crop yield by JECAM (Kussul et al. Citation2015) among others.
Results from this workflow will come in the form of maps of water stress (drought) levels and text reports (tables) containing various water stress levels for each country based on the percentage of the total land area of that country. In this workflow, we simply use daily actual and reference satellite evapotranspiration (ET) products to quantify water stress levels (Anderson et al. Citation2016).
The initial output of the workflow are daily maps of the evaporative drought index.
3.1.2. Productive agriculture
This workflow is partially addressing SDG indicator 2.4.1: the proportion of agricultural area under productive and sustainable agriculture.
Using a land cover map (Kussul et al. Citation2015) we estimate the total area of agricultural land and the trend of the NDVI index change over cropland. We define productive and sustainable land as the cropland that has a non-negative trend of NDVI index change. The final output of this method is a proportion of the cropland area with a non-negative NDVI trend compared to all area of agricultural land in percentage [0–100].
Going forward we will produce a series of related workflows using the WOFOST model. For each point that covers the territory of interest, the WOFOST model is used for crop simulation. Using outputs from the model (e.g. LAI, total biomass, crop phenology and yield) clusters of points with the largest mean value of all the criteria for each crop type are identified, then the centroid of this productivity cluster is indexed with this value. Using the crop classification map, it’s possible to calculate a productivity index for every agricultural field and produce a productivity map. Analyzing such maps for several years, it’s feasible to estimate the productivity trend for each point. Thus, productive and sustainable agriculture areas could be considered as areas with a positive productivity trend.
The output of the workflow is the proportion of agricultural area under productive and sustainable agriculture. An example of this workflow is available on GitHub at https://github.com/AndriiKolotii/vlablandprod.git
3.1.3. Water extent
This workflow is partially addressing SDG indicator 6.6.1: the change in the extent of water-related ecosystems over time.
Measurement of spatial extent of water is important as this provides an indication of the availability of these ecosystems and the potential they have to provide ecosystem services. Both Earth Observation (EO), ground-based surveys and models provide data that are used to determine the change in the spatial extent of water-related ecosystems over time. This part of the indicator measures the geographic or spatial extent of vegetated wetlands (such as swamps, marshes and peat, and including mangroves, swamp forests and even rice paddies) as well as inland open water (rivers, floodplains and estuaries, lakes and reservoirs).
Ultimately the SWAT model will be used to design workflows creating outputs on water quality and quantity, food productivity and hydropower potential over Europe. Many of the difficulties and limitations with continental modeling using SWAT arose from data-related issues and included among others a lack of data on soil moisture making cal/val of these components impossible. EO meanwhile provides globally consistent soil moisture datasets over a long time-series (e.g. http://hsaf.meteoam.it/). New workflows will test the inclusion of additional EO datasets (e.g. soil moisture) derived from EO in SWAT.
The output of this workflow is a number representing the total area in km2 of water extent lost, gained and unchanged between the years 1984 and 2015. This workflow is available on GitHub https://github.com/irmccallum/GeoEssential.
4. Summary and outlook
It is widely recognized that a nexus approach is required when attempting to understand the complex interrelationships between sectors including food, water and energy. However, approaches to tackle the inherent complexities in such systems are only recently becoming available (Kim et al. Citation2016), leaving decision-makers in a challenging position when it comes to policy setting. Hence, it is important to look at how to work with existing models and methods to find solutions.
This study lays out the framework for a data-driven and modeling approach to the FWE nexus. It is proposed to utilize essential variable data, derived from earth observation. Use of essential variable services will ensure that common standards are applied and harmonized datasets are utilized. We have reviewed a suite of three models (SWAT, TerrSysMP and WOFOST). No single model or approach can completely address all aspects of the FWE nexus. Hence the optimal solution is to capitalize on the strengths of each of the different approaches. We have designed a suite of workflows which when combined in a nexus framework along with models or components of them, could act as a roadmap to reach nexus informed decisions.
Going forward it is suggested to use a virtual laboratory or similar environment within which to operate the food, water and energy nexus framework. Furthermore, it appears beneficial to associate the outcomes both in terms of workflows and the resulting framework to the SDGs.
Acknowledgements
We also thank two anonymous reviewers who provided significant time and insight to greatly improve the manuscript.
Disclosure statement
No potential conflict of interest was reported by the authors.
ORCID
Bagher Bayat http://orcid.org/0000-0002-7761-9544
Andrii Kolotii http://orcid.org/0000-0002-6972-4483
Nataliia Kussul http://orcid.org/0000-0002-9704-9702
Mykola Lavreniuk http://orcid.org/0000-0003-2183-8833
Anthony Lehmann http://orcid.org/0000-0002-8279-8567
Paolo Mazzetti http://orcid.org/0000-0002-8291-1128
Additional information
Funding
Related Research Data
References
- Abbaspour, K. C., E. Rouholahnejad, S. Vaghefi, R. Srinivasan, H. Yang, and B. Kløve. 2015. “A Continental-Scale Hydrology and Water Quality Model for Europe: Calibration and Uncertainty of a High-Resolution Large-Scale SWAT Model.” Journal of Hydrology 524: 733–752. doi:10.1016/j.jhydrol.2015.03.027.
- Anderson, M. C., C. A. Zolin, P. C. Sentelhas, C. R. Hain, K. Semmens, M. Tugrul Yilmaz, F. Gao, J. A. Otkin, and R. Tetrault. 2016. “The Evaporative Stress Index as an Indicator of Agricultural Drought in Brazil: An Assessment Based on Crop Yield Impacts.” Remote Sensing of Environment 174: 82–99. doi:10.1016/j.rse.2015.11.034.
- Baldauf, M., A. Seifert, J. Förstner, D. Majewski, M. Raschendorfer, and T. Reinhardt. 2011. “Operational Convective-Scale Numerical Weather Prediction with the COSMO Model: Description and Sensitivities.” Monthly Weather Review 139: 3887–3905. doi:10.1175/MWR-D-10-05013.1.
- Bauer-Marschallinger, B., V. Freeman, S. Cao, C. Paulik, S. Schaufler, T. Stachl, S. Modanesi, et al. 2019. “Toward Global Soil Moisture Monitoring With Sentinel-1: Harnessing Assets and Overcoming Obstacles.” IEEE Transactions on Geoscience and Remote Sensing 57: 520–539. doi:10.1109/TGRS.2018.2858004.
- Bojinski, S., M. Verstraete, T. C. Peterson, C. Richter, A. Simmons, and M. Zemp. 2014. “The Concept of Essential Climate Variables in Support of Climate Research, Applications, and Policy.” Bulletin of the American Meteorological Society 95: 1431–1443. doi:10.1175/BAMS-D-13-00047.1.
- Byers, E., M. Gidden, D. Leclère, J. Balkovic, P. Burek, K. Ebi, P. Greve, et al. 2018. “Global Exposure and Vulnerability to Multi-Sector Development and Climate Change Hotspots.” Environmental Research Letters 13: 055012. doi: 10.1088/1748-9326/aabf45
- Ceglar, A., R. van der Wijngaart, A. de Wit, R. Lecerf, H. Boogaard, L. Seguini, M. van den Berg, et al. 2018. “Improving WOFOST Model to Simulate Winter Wheat Phenology in Europe: Evaluation and Effects on Yield.” Agricultural Systems. doi:10.1016/j.agsy.2018.05.002.
- Courtier, P., J.-N. Thépaut, and A. Hollingsworth. 1994. “A Strategy for Operational Implementation of 4D-Var, Using an Incremental Approach.” Quarterly Journal of the Royal Meteorological Society 120: 1367–1387. doi:10.1002/qj.49712051912.
- Doms, G., and U. Schättler. 2002. A Description of the Nonhydrostatic Regional Model LM, Part I: Dynamics and Numerics.
- Evensen, G. 1994. “Sequential Data Assimilation with a Nonlinear Quasi-Geostrophic Model Using Monte Carlo Methods to Forecast Error Statistics.” Journal of Geophysical Research 99: 10143–10162. doi:10.1029/94JC00572.
- Famiglietti, J. S. 2014. “The Global Groundwater Crisis.” Nature Climate Change 4: 945–948. doi: 10.1038/nclimate2425
- Fletcher, F., K. H. Neumayer, C. Dahle, H. Dobslaw, E. Fagiolini, J. C. Raimondo, and A. Güntner. 2016. “What Can Be Expected from the GRACE-FO Laser Ranging Interferometer for Earth Science Applications?” Surveys in Geophysics 37: 453–470. doi:10.1007/s10712-015-9338-y.
- Gasper, F., K. Goergen, P. Shrestha, M. Sulis, J. Rihani, M. Geimer, and S. Kollet. 2014. “Implementation and Scaling of the Fully Coupled Terrestrial Systems Modeling Platform (TerrSysMP v1.0) in a Massively Parallel Supercomputing Environment – a Case Study on JUQUEEN (IBM Blue Gene/Q).” Geoscientific Model Development 7: 2531–2543. doi:10.5194/gmd-7-2531-2014.
- Gassman, P., A. Sadeghi, and R. Srinivasan. 2014. “Applications of the SWAT Model Special Section: Overview and Insights.” doi:10.2134/jeq2013.11.0466.
- Gordon, N. J., D. J. Salmond, and A. F. M. Smith. 1993. “Novel Approach to Nonlinear/Non-Gaussian Bayesian State Estimation.” IEE Proceedings F Radar and Signal Processing 140: 107–113. doi:10.1049/ip-f-2.1993.0015.
- Griggs, D., M. Stafford-Smith, O. Gaffney, J. Rockström, M. C. Öhman, P. Shyamsundar, W. Steffen, G. Glaser, N. Kanie, and I. Noble. 2013. “Sustainable Development Goals for People and Planet.” Nature 495: 305–307. doi: 10.1038/495305a
- Gruber, A., W. A. Dorigo, S. Zwieback, A. Xaver, and W. Wagner. 2013. “Characterizing Coarse-Scale Representativeness of in situ Soil Moisture Measurements from the International Soil Moisture Network.” Vadose Zone Journal 12. doi:10.2136/vzj2012.0170.
- Han, X., H.-J. Hendricks Franssen, X. Li, Y. Zhang, C. Montzka, and H. Vereecken. 2013. “Joint Assimilation of Surface Temperature and L-Band Microwave Brightness Temperature in Land Data Assimilation.” Vadose Zone Journal 12, vzj2012.0072-vzj2012.0072. doi:10.2136/vzj2012.0072.
- Havlík, P., H. Valin, M. Herrero, M. Obersteiner, E. Schmid, M. C. Rufino, A. Mosnier, et al. 2014. “Climate Change Mitigation Through Livestock System Transitions.” Proceedings of the National Academy of Sciences 111: 3709–3714. doi:10.1073/pnas.1308044111.
- Jones, J. E., and C. S. Woodward. 2001. “Newton–Krylov-Multigrid Solvers for Large-Scale, Highly Heterogeneous, Variably Saturated Flow Problems.” Advances in Water Resources 24: 763–774. doi:10.1016/S0309-1708(00)00075-0.
- Kahil, T., S. Parkinson, Y. Satoh, P. Greve, P. Burek, T. I. E. Veldkamp, R. Burtscher, et al. 2018. “A Continental-Scale Hydroeconomic Model for Integrating Water-Energy-Land Nexus Solutions.” Water Resources Research 54: 7511–7533. doi:10.1029/2017WR022478.
- Kaminski, T., W. Knorr, M. Scholze, N. Gobron, B. Pinty, R. Giering, and P.-P. Mathieu. 2012. “Consistent Assimilation of MERIS FAPAR and Atmospheric CO2 into a Terrestrial Vegetation Model and Interactive Mission Benefit Analysis.” Biogeosciences 9: 3173–3184. doi:10.5194/bg-9-3173-2012.
- Kerr, Y. H., P. Waldteufel, J. P. Wigneron, S. Delwart, F. Cabot, J. Boutin, M. J. Escorihuela, et al. 2010. “The SMOS Mission: New Tool for Monitoring Key Elements of the Global Water Cycle.” Proceedings of the IEEE 98: 666–687. doi:10.1109/JPROC.2010.2043032.
- Keune, J., F. Gasper, K. Goergen, A. Hense, P. Shrestha, M. Sulis, and S. Kollet. 2016. “Studying the Influence of Groundwater Representations on Land Surface-Atmosphere Feedbacks during the European Heat Wave in 2003.” Journal of Geophysical Research: Atmospheres 121 (13): 301–13,325. doi:10.1002/2016JD025426.
- Kim, S. H., M. Hejazi, L. Liu, K. Calvin, L. Clarke, J. Edmonds, P. Kyle, P. Patel, M. Wise, and E. Davies. 2016. “Balancing Global Water Availability and Use at Basin Scale in an Integrated Assessment Model.” Climatic Change 136: 217–231. doi:10.1007/s10584-016-1604-6.
- Kollet, S. J., and R. M. Maxwell. 2006. “Integrated Surface–Groundwater Flow Modeling: A Free-Surface Overland Flow Boundary Condition in a Parallel Groundwater Flow Model.” Advances in Water Resources 29: 945–958. doi:10.1016/j.advwatres.2005.08.006.
- Kussul, N., G. Lemoine, J. Gallego, S. Skakun, and M. Lavreniuk. 2015. “Parcel Based Classification for Agricultural Mapping and Monitoring Using Multi-Temporal Satellite Image Sequences, in: 2015 IEEE International Geoscience and Remote Sensing Symposium (IGARSS).” Presented at the 2015 IEEE International Geoscience and Remote Sensing Symposium (IGARSS), 165–168. doi:10.1109/IGARSS.2015.7325725.
- Montzka, C., R. V. Pauwels, H. H.-J. Franssen, X. Han, and H. Vereecken. 2012. “Multivariate and Multiscale Data Assimilation in Terrestrial Systems: A Review.” Sensors 12: 16291–16333. doi:10.3390/s121216291.
- NRC. 2008. Integrating Multiscale Observations of U.S. Waters. Washington, DC: The National Academies Press. doi:10.17226/12060.
- Obersteiner, M., B. Walsh, S. Frank, P. Havlík, M. Cantele, J. Liu, A. Palazzo, et al. 2016. “Assessing the Land Resource–Food Price Nexus of the Sustainable Development Goals.” Science Advances 2: e1501499. doi:10.1126/sciadv.1501499.
- OECD. 2012. OECD Environmental Outlook to 2050: The Consequences of Inaction. Paris: OECD Publishing.
- Oleson, K. W., G-Y Niu, Z-L Yang, D. M. Lawrence, P. E. Thornton, P. J. Lawrence, R. Stöckli, et al. 2008. “Improvements to the Community Land Model and their Impact on the Hydrological Cycle.” Journal of Geophysical Research: Biogeosciences 113. doi:10.1029/2007JG000563.
- Parkinson, S., V. Krey, D. Huppmann, T. Kahil, D. McCollum, O. Fricko, Gidden Edward Byers, et al. 2019. “Balancing Clean Water-Climate Change Mitigation Trade-Offs.” Environmental Research Letters 14: 014009. doi: 10.1088/1748-9326/aaf2a3
- Pereira, H. M., S. Ferrier, M. Walters, G. N. Geller, R. H. G. Jongman, R. J. Scholes, M. W. Bruford, et al. 2013. “Essential Biodiversity Variables.” Science 339: 277–278. doi:10.1126/science.1229931.
- Piazzon, F., A. Sommariva, and M. Vianello. 2017. “Caratheodory-tchakaloff Least Squares, in: 2017 International Conference on Sampling Theory and Applications (SampTA).” Presented at the 2017 International Conference on Sampling Theory and Applications (SampTA), 672–676. doi:10.1109/SAMPTA.2017.8024337.
- Rasul, G. 2016. “Managing the Food, Water, and Energy Nexus for Achieving the Sustainable Development Goals in South Asia.” Environmental Development 18: 14–25. doi:10.1016/j.envdev.2015.12.001.
- Reichle, R. H., G. J. M. De Lannoy, B. A. Forman, C. S. Draper, and Q. Liu. 2013. “Connecting Satellite Observations with Water Cycle Variables Through Land Data Assimilation: Examples Using the NASA GEOS-5 LDAS.” doi:10.1007/s10712-013-9220-8.
- Ringler, C., A. Bhaduri, and R. Lawford. 2013. “The Nexus Across Water, Energy, Land and Food (WELF): Potential for Improved Resource Use Efficiency?” Current Opinion in Environmental Sustainability 5: 617–624. doi:10.1016/j.cosust.2013.11.002.
- Ryu, Y., J. A. Berry, and D. D. Baldocchi. 2019. “What is Global Photosynthesis? History, Uncertainties and Opportunities.” Remote Sensing of Environment 223: 95–114. doi:10.1016/j.rse.2019.01.016.
- Shrestha, P., M. Sulis, M. Masbou, S. Kollet, and C. Simmer. 2014. “A Scale-Consistent Terrestrial Systems Modeling Platform Based on COSMO, CLM, and ParFlow.” Monthly Weather Review 142: 3466–3483. doi:10.1175/MWR-D-14-00029.1.
- Sulis, M., J. L. Williams, P. Shrestha, M. Diederich, C. Simmer, S. J. Kollet, and R. M. Maxwell. 2017. “Coupling Groundwater, Vegetation, and Atmospheric Processes: A Comparison of Two Integrated Models.” Journal of Hydrometeorology 18: 1489–1511. doi:10.1175/JHM-D-16-0159.1.
- Valcke, S. 2013. “The OASIS3 Coupler: A European Climate Modelling Community Software.” Geoscientific Model Development 6: 373–388. doi:10.5194/gmd-6-373-2013.
- Zakharova, E. A., A. V. Kouraev, A. Cazenave, and F. Seyler. 2006. “Amazon River Discharge Estimated from TOPEX/Poseidon Altimetry.” Comptes Rendus Geoscience 338: 188–196. doi:10.1016/j.crte.2005.10.003.