
 ?Mathematical formulae have been encoded as MathML and are displayed in this HTML version using MathJax in order to improve their display. Uncheck the box to turn MathJax off. This feature requires Javascript. Click on a formula to zoom.
ABSTRACT
In recent years, social media platforms have played a critical role in mitigation for a wide range of disasters. The highly up-to-date social responses and vast spatial coverage from millions of citizen sensors enable a timely and comprehensive disaster investigation. However, automatic retrieval of on-topic social media posts, especially considering both of their visual and textual information, remains a challenge. This paper presents an automatic approach to labeling on-topic social media posts using visual-textual fused features. Two convolutional neural networks (CNNs), Inception-V3 CNN and word embedded CNN, are applied to extract visual and textual features respectively from social media posts. Well-trained on our training sets, the extracted visual and textual features are further concatenated to form a fused feature to feed the final classification process. The results suggest that both CNNs perform remarkably well in learning visual and textual features. The fused feature proves that additional visual feature leads to more robustness compared with the situation where only textual feature is used. The on-topic posts, classified by their texts and pictures automatically, represent timely disaster documentation during an event. Coupling with rich spatial contexts when geotagged, social media could greatly aid in a variety of disaster mitigation approaches.
1. Introduction
The rising of microblogging platforms renders us an important way to share information online, especially during severe disaster events. Social media including Twitter, Facebook, and Flickr empower millions of citizens, as eyewitnesses, to voluntarily document their observations and thoughts in a highly up-to-date manner (Crampton Citation2009; Ashktorab et al. Citation2014). Guided by the idea ‘citizen as sensors’ proposal by Goodchild (Citation2007), volunteers may contribute useful information regarding the intensity, severity as well as the extent of a disaster, providing time-critical situational awareness before authoritative information becomes available. Given the importance of on-topic (disaster related) social media, extensive studies have attempted to harness useful volunteered information within social media for understanding and mitigating disasters, both natural and human-induced. Studies have demonstrated the utility of social media in mitigating a wide range of disasters including wildfire (Sutton, Palen, and Shklovski Citation2008; Vieweg et al. Citation2010; Kent and Capello Citation2013; Slavkovikj et al. Citation2014), flood (Schnebele and Cervone Citation2013; Schnebele, Cervone, and Waters Citation2014; Fohringer et al. Citation2015; Avvenuti et al. Citation2016; Huang, Wang, and Li Citation2018a; Huang, Wang, and Li Citation2018b; Li et al. Citation2018), earthquake (Sakaki, Okazaki, and Matsuo Citation2010; Yates and Paquette Citation2010; Muralidharan et al. Citation2011; Earle, Bowden, and Guy Citation2012; Yin et al. Citation2012; Avvenuti et al. Citation2014; Avvenuti, Cresci, Del Vigna et al. Citation2018; Resch, Usländer, and Havas Citation2018), extreme precipitation and droughts (Hannak et al. Citation2012; Ruiz Sinoga and León Gross Citation2013; Tang et al. Citation2015), and flu outbreak (Dredze Citation2012; Lampos and Cristianini Citation2012; Schmidt Citation2012; Gao et al. Citation2018). The timely, individual level characteristic coupling with their rich spatial contexts makes disaster related social media a distinct source of ambient geospatial information (Verma et al. Citation2011; Stefanidis, Crooks, and Radzikowski Citation2013; Middleton, Middleton, and Modafferi Citation2014) and a proxy to enhance disaster awareness (Imran et al. Citation2015; Gao et al. Citation2018).
Given the fact that on-topic social media only comprises a small proportion of the enormous volume of information in social media space, the practicality of social media has been greatly hampered by the limited approaches of automatic on-topic social media retrieval. The automation remains challenging because (1) the enormousness of social media pool that requires great computational power (Zikopoulos and Eaton Citation2011; Xu et al. Citation2016); (2) the complexity of the visual (picture) and textual (text) information that impedes the efficiency of traditional classification methods (Lew et al. Citation2006); and (3) the lack of an integrated approach that considers fused characteristics from both visual and textual information (Gao et al. Citation2013). The first challenge has been addressed by the development of cloud-computing, parallel computing, and the popular application of GPU (graphics processing unit) acceleration. The second challenge is being addressed with the advance of machine learning algorithms that greatly improve the classification accuracy of complex visual and textual information. For example, the state-of-the-art convolutional neural network (CNN) techniques have achieved great performance on both picture labeling (Simonyan and Zisserman Citation2014; Szegedy et al. Citation2017) and text classification (Kim Citation2014). The third challenge, however, has not been thoroughly explored in the current literature. As two major components of a social media post, text and picture are both important when classifying on-topic social media posts. It is believed that the classification approach using a fused feature from visual and textual information allows cross-validation of each source, thus leading to better classification results (You et al. Citation2016). Therefore, the third challenge relies on an advanced visual-textual fused classification approach and merits further investigation.
This paper presents an approach to classifying on-topic social media by integrating their visual and textual information via a fused CNN architecture. Specifically, two CNN architectures are employed targeting on visual and textual information of social media posts, separately. The outputs of the two CNNs, extracted features respectively representing visual and textual characteristics from a social media post, are further concatenated to form a fused representation, participating in the final classification step. Taking 2017 Houston Flood as a study case, this paper assesses the practicality of using visual-textual fused representation to label on-topic social media posts during a flood event. It also evaluates the performances of popular machine learning algorithms on the training of visual-textual fused vector. More importantly, it provides direct evidence on how much the accuracy for labeling can be improved with the involvement of visual information.
The remainder of this paper is organized as follows. Section 2 reviews previous work regarding the visual, textual, and visual-textual classification approaches. Section 3 explains the visual-textual fusion approach proposed in this study. Section 4 describes a case study of classifying flood-related tweets utilizing the proposed approach. Section 5 analyses the results. Section 6 describes the limitations and future directions. Lastly, section 7 concludes the paper.
2. Related work
2.1. Visual information labeling
The development of machine learning techniques enables automation of labeling pictures via their visual characteristics. The traditional approaches have proven relatively efficient (Gupta et al. Citation2013; Ofli et al. Citation2016). Those approaches include Random Forests that learns features via a multitude of decisive structures (Bosch, Zisserman, and Munoz Citation2007); Support Vector Machines (SVM) that constructs one or multiple hyperplanes (Chapelle, Haffner, and Vapnik Citation1999); and Naïve Bayes that learns probabilistically by assuming strong independence between features (McCann and Lowe Citation2012). These baseline models have been outperformed by the rapidly evolving convolutional neural networks (CNNs) (Ciresan et al. Citation2011; Krizhevsky, Sutskever, and Hinton Citation2012). Inspired by biological processes, a CNN is a hierarchical neural network composed of input, output, and multiple hidden layers. Its form varies upon how those hidden layers are organized and realized. Since its proposal, CNN has been widely applied in various of fields that require advanced image processing technique, including remote sensing (Hu et al. Citation2015), social media analysis (Nguyen et al. Citation2017;), medical imaging processing (Bar et al. Citation2015), signal processing (Hershey et al. Citation2017) and video recognition (Yue-Hei Ng et al. Citation2015). The great potential of CNN and the advance in high-performance computing markedly flourish the development of CNN architecture in picture recognition. AlexNet by Krizhevsky, Sutskever, and Hinton (Citation2012), for instance, consists of only 8 layers but was able to achieve a top 5 test error rate of 15.4% on ILSVRC (ImageNet Large-Scale Visual Recognition Challenge). VGG Net by Simonyan and Zisserman (Citation2014) significantly improved the performance by utilizing a simpler but much deeper convolutional structure. Diverging from the mainstream of stacking layers following a sequential structure, GoogleLeNet (Szegedy et al. Citation2015) used a composition of multiple inception modules and achieved improved performance (5.6% top-5 error) as well as computational efficiency. With a depth of up to 152 layers, the ResNet proposed by He et al. (Citation2016) further improved the classification performance above human-level (3.57% top-5 error) by going deeper and leveraging residual networks.
In this study, the CNN architecture used to label visual information from social media is a transfer-learned and find-tuned Inception-V3 architecture. More details about the architecture design and transfer leaning phrase are presented in Section 3.1.
2.2. Textual information labeling
Apart from the success in picture labeling, CNN models have also shown a great potential in natural language process (NLP) and achieved excellent performances in semantic parsing (Yih, He, and Meek Citation2014), sentimental analysis (Ouyang et al. Citation2015), sentence modeling (Kalchbrenner, Grefenstette, and Blunsom Citation2014), sentence labeling (Wang et al. Citation2012; Kim Citation2014) and other NLP tasks (Sutskever, Vinyals, and Le Citation2014). Within the NLP tasks, CNN models are able to capitalize on distributed word representations by first learning word vectors through neural language models, then forming a matrix to be used for classification (Collobert et al. Citation2011; Zhang and Wallace Citation2015). Extensive studies have explored the capability of CNN in labeling texts to a certain topic. Kim (Citation2014), for example, designed a simple one-layer CNN architecture for sentence classification utilizing word vectors trained by Mikolov et al. (Citation2013) and achieved a remarkable classification accuracy across several datasets. Kalchbrenner, Grefenstette, and Blunsom (Citation2014) designed a CNN architecture by applying a dynamic K-Max Pooling strategy over linear sequences and found that it outperformed the baseline models including SVM and neural bag-of-words (NBOW). Feng and Sester (Citation2018) found that CNN coupling with word vector representations performed better in flood related text classification than traditional machine learning algorithms including SVM, Random Forest, Logistic Regression, and Naïve Bayes. Lin et al. (Citation2016) adopted Kim’s network (Kim Citation2014) and tested on Weibo, a Chinese microblogging service, to extract information related to earthquake and achieved accuracy up to 90.7% in labeling on-topic posts.
The strong performance achieved with those relatively simple CNN architectures suggests their great potentials in text labeling. This study modifies the architecture proposed by Kim (Citation2014) for text classification. More details can be found in Section 3.2.
2.3. Towards a fused labeling
The outstanding performances of CNN in picture and text classification have raised a tendency to merge visual and textual information towards a fused classification approach. Under the assumption that a visual-textual fused classification allows self-correction of intrinsic errors from a single source (You et al. Citation2016; Laura et al. Citation2017), a fused classification method combines the features extracted from both picture and text and therefore leads to a more robust classification. This is especially the case when dealing with disaster related social media posts where both their visual and textual information may contain important information. A few attempts have been made to combine visual and textual information. Huang et al. (Citation2018c) proposed a visual-textual fused approach in labeling flood-related tweets by integrating flood sensitive words to remove wrongly classified pictures by CNN. However, it only proves that textual information (flood sensitive words) can be applied to refine the result from picture labeling. You et al. (Citation2016) designed a cross-modality regression for joint visual-textual sentimental analysis of social multimedia and achieved a great performance. Avgerinakis et al. (Citation2017) proposed a visual and textual analysis by fusing the results from two modalities using non-linear graph-based techniques. Bischke et al. (Citation2017) proposed a fused framework that combined both features to a single vector for final classification.
The visual-textual approach proposed in this study integrates a transfer-learned Inception-V3 architecture (extracting visual features) and modified word embedded CNN architecture (extracting textual features). More details can be found in Section 3.3.
3. Methodology
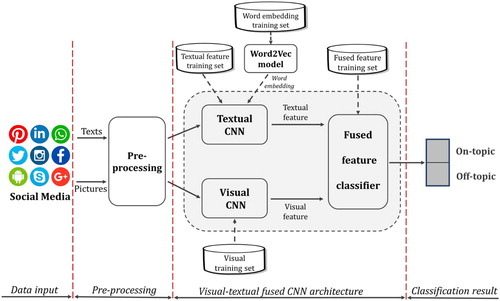
The conceptual workflow of the proposed methodology is presented in . Texts and pictures from a social media post are refined in the pre-processing process (Section 4.3) and fed to visual CNN (Section 3.1) and textual CNN (Section 3.2) respectively for feature extraction. Well-trained on the designed training datasets, both CNN architectures have the capability of providing feature vectors that describe the characteristics of texts and pictures. Concatenating the visual vectors and textual vectors, a fused feature vector is developed and input to the final classification architecture (Section 3.3). The final output is a binary class (on-topic or off-topic) of any given social media post.
Figure 1. Conceptual workflow.
3.1. Transfer-learned and fine-tuned CNN architecture (Visual CNN)
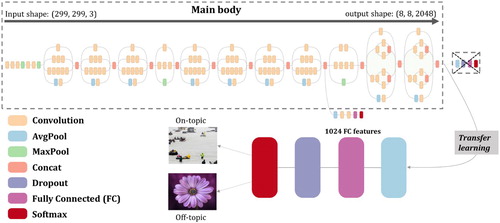
Transfer learning is the technique that transfers the network weights on a previous task to a new task, under the assumption that features extracted from the previous dataset are generic enough to be useful in the context of new dataset (Yosinski et al. Citation2014). The base model to tackle visual classification problem in this study is Inception-V3 architecture with 3.6% top-5 error (Szegedy et al. Citation2016). To transfer this network to a binary classifier (on-topic or off-topic), several top layers specific to ILSVRC problems are removed. New layers are added to the model in the following order: AvgPool, FC (1024 features), Dropout and Softmax (2 classes), as shown in .
Figure 2. Transfer learned model from Inception-v3; the original Inception-v3 architecture graph (Main body) is adopted from Serengil (Citation2018).
To retrain the newly composed model, a two-stage transfer learning strategy is applied:
Stage 1: freeze all but the penultimate layer and re-train the last FC layer;
Stage 2: unfreeze lower convolutional layers and fine tune their weights.
After the completion of stage 1, lower convolutional layers are further released to be trainable on the same training dataset in stage 1 through the backpropagation process. This stage is motivated by the idea that the earlier features in a CNN model contain more generic features that can be generalized to other tasks (no need to be fine-tuned), but the later features in the model become more specific to previous designated classes (need to be fine-tuned). In this stage, the top 2 inception blocks in the main body inception-v3 are further released to be trainable while other low-level layers are still kept frozen to prevent model being overfitted.
The functionality of various layers in is summarized in :
Table 1. Layer functionality summary.
3.2. Word embedded CNN architecture (Textual CNN)
The construction of a word embedded CNN consists of two steps:
High-dimensional word representation (word vector) acquisition;
Application of CNN in sentence matrix formed by word vectors.
Given the fact that textual patterns differ a lot in short-text posts in social media compared to formal sources including news and formal articles, it is necessary to train word vectors specifically for social media posts. To acquire word vectors, the technique used in this study is Word2Vec, a shallow neural network with single hidden layer, but proved to be powerful in providing 300-dimention vectors representing the word characteristics (Mikolov et al. Citation2013). A word vector database is then built to enable the formation of sentence matrix, which is the input for a CNN architecture designed based on the work by Kim (Citation2014) ().
Figure 3. Word embedded CNN architecture.
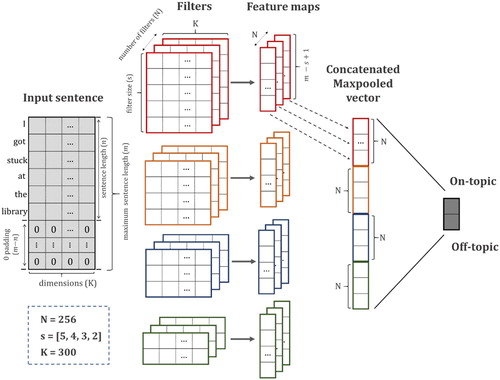
The input sentence is described by multiple 300-dimension vectors, which forms an image-like matrix that can be processed by convolutional algorithms. Suppose that the maximum word length in a sentence is and the dimension of a word vector is
, the sentence matrix that serves as the input to the CNN model can be represented by
. Let
be the K-dimensional word vector to the
-th word in the input sentence. Each sentence can be represented as:
(1)
(1) where
is the concatenation operator.
Given that not every sentence reaches the maximum length (), 0 padding strategy is applied when necessary. Suppose that a sentence has a length of
, the input sentence can be rewritten as:
(2)
(2) where
denotes a vector padded with 0.
Let refer to the subset of concatenation words from word
to word
. Let
to be the domain of a certain filter with a vertical size of
words. When this 2D filter is applied to a window of word from
, a new feature
is generated:
(3)
(3) where
is the bias term,
is an activation function (following the work of Kim (Citation2014), a hyperbolic tangent function is applied) and
is the dot product from the filter and the word matrix from
to
. When this filter is moving in a stride of 1, it generates a feature map
as:
(4)
(4) After the generation of feature map
for a certain filter
, a pooling function is applied to induce a fixed-length vector (Lin et al. Citation2016). A commonly used max pooling strategy (Collobert et al. Citation2011) is applied, taking the maximum value from each feature map
:
(5)
(5) where
represents the maximum value in its elements.
The application of this max pooling strategy provides a single feature () corresponding with its filter (
). In this study, given a certain filter size
, a total number of N filters are used to obtain a comprehensive understanding of the input sentence, resulting in a dense N-dimensional vector z:
(6)
(6) Those z vectors are further concatenated to a long dense vector. Let
be the total number of filter size. The final concatenated vector
can be represented as:
(7)
(7) The concatenated textual vector
is further processed by Softmax regression to generate two neurons with binary labels.
3.3. Fusing visual and textual information
The fusion of visual and textual information in this section utilizes the penultimate layer in word embedded CNN architecture and a transfer-learned and fine-tuned Inception-V3 architecture. Both CNN models are well trained with on-topic and off-topic disaster social media ().
Figure 4. Fusion of visual and textual information.
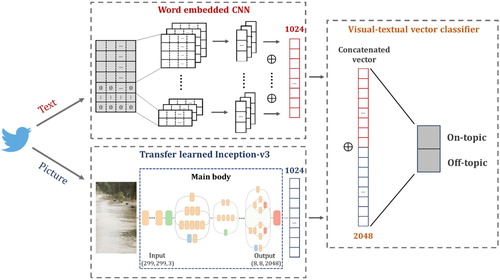
When a social media post is fed to the fused architecture, its textual and visual information is simultaneously and respectively passed through a well-trained word embedded CNN for generating textual features and a transfer-learned Inception-V3 for generating visual features. Each model returns a 1024-dimension vector characterizing the visual and textual information of a social media post separately. The concatenated vector with 2048 dimensions, therefore, represents a fused feature describing visual-textual information integrally:(8)
(8) where
and
denote textual vector and visual vector respectively, both with 1024 dimensions.
denotes the concatenated vector with 2048 dimensions, describing a fused characteristic from both text and picture of a social media post. Noted that the proposed approach doesn’t require the coexistence of visual and textual input. The corresponding feature in the fused 2048-dimension vector is automatically padded with 0 if the input lacks an information source, either visual or textual. In this study, we noticed almost all social media posts in the study case contain textual information but only a proportion of them contain visual information. Therefore, we targeted on the influence of
, the additional visual information input, on the classification merely based on
.
The fused vector is further trained using popular machine learning algorithms to derive binary labels: on-topic and off-topic. Those machine learning algorithms used in this study include Logistic Regression (LogR), Linear Discriminant Analysis (LDA), Decision Tree (DT), Support Vector Machine (SVM), Random Forest (RF) and Naïve Bayes (NB). To train the algorithms above, a training set is developed, containing labeled social media posts with text only and with both text and pictures. This training phrase enables the algorithms to handle a variety of inputs and make classification decisions accordingly. The performances of the algorithms are presented in Section 5.
4. Experimental design
4.1. Study case
A specific disaster, flood, is used in this study to demonstrate the feasibility and efficiency of the proposed approach. As for social media, we target on Twitter, a widely used and open-source social media platform with more than 68 million U.S. monthly active users (Twitter MAU in the United States Citation2018). Flood-related tweets provide real-time flood information at the posted location, which is essential for first responders to identify areas in need of immediate attention, especially when authoritative data sources are not available. The highly up-to-date flood information provided by Twitter users aids in acquiring in-time flooding situation, greatly contributing to real-time flood monitoring, inundation mapping, and damage assessment. Two specific floods, 2015 SC flood and 2017 Houston flood (), are selected as the a study case. Geotagged tweets containing verified texts derived from 2015 SC flood ((b)) and flood pictures from various sources () are applied to train the textual CNN and visual CNN respectively. Their concatenated feature extracted from well-trained CNNs is further evaluated using geotagged tweets derived from 2017 Houston flood ((c)).
Figure 5. Research area for two flooding cases with their geotagged tweets; (a) Continental U.S; (b) South Carolina flood in 2015 with 934,896 geotagged tweets from October 2 to October 9; (c) Houston flood in 2017 with 501,516 geotagged tweets from August 25 to September 1.
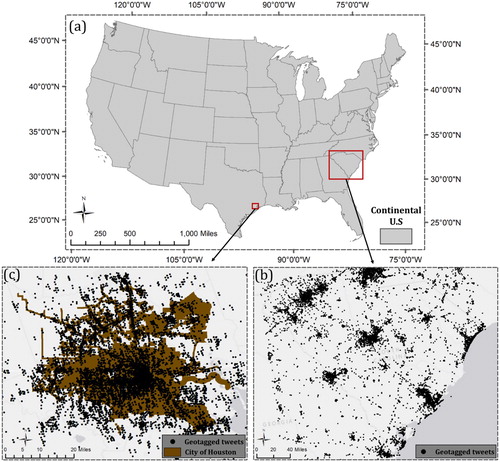
Table 2. Visual training set.
4.2. Datasets
4.2.1. Visual training set
To transfer-learn and fine-tune the CNN architecture designed in Section 3.1, we developed a balanced visual training set from popular searching engines and social media platforms. The multi-source characteristic of the training set allows better generalization that reduces model overfitting. The dataset contains 5500 flood pictures (positive samples) and 5500 non-flood pictures (negative samples) as summarized in . We followed a stratified k-fold (k = 5) cross-validation rule to split the training set. It is a commonly used estimation approach that partitions the dataset randomly into k equal-size subsamples, where one single subsample is retained for validation and the remaining k-1 subsamples are used for training.
4.2.2. Textual training set
The textual training set in this study contains two subsets: (1) word embedding training set, aiming train the embedding model, Word2Vec (Mikolov et al. Citation2013), to learn high-dimensional word representation (word vector); (2) Textual feature training, aiming to train the textual CNN to provide textual feature (1024-dimension vector) that characterizes the textual information ().
Table 3. Textual training set.
The word embedding training set contains a total of 13,830,023 selected sample tweets in 2017. They were downloaded using Twitter Stream API and are stored in a Hadoop computer cluster. The usage of a large corpus of tweets to train the word embedding model contributes to well-summarized word vectors that are specifically for short-text social media posts.
After training the word embedding model, we further trained the textual CNN architecture (described in Section 3.2) to provide textual features (1024-dimension vector) that characterize the textual information posts. In this textual feature training set, we manually labeled 5706 tweets during the 2015 SC flood (October 2 to October 9) based on their textual content only. This balanced dataset contains 2852 positive samples (flood related) and 2852 negative samples (non-flood related).
4.2.3. Fused feature training set
The fused feature training set aims to train the visual-textual feature (2048-dimension vector) classifier (described in Section 3.3) to generate on-topic or off-topic labels. The dataset used in this training phase was developed during 2017 Houston Flood period (August 25 to September 1). We manually verified 2092 positive tweets based on the content of their texts, pictures or both, among which 825 are picture included tweets. The same amount of negative tweets (2092) during the event were randomly selected and verified as non-flood related, among which 1042 were picture included tweets. The fused feature training set enables the visual-textual classifier to produce binary labels given both sufficient inputs (a tweet contains both text and picture) and insufficient inputs (a tweet contains text but lacks picture).
4.3. Pre-processing of texts and pictures
Tweeted texts are noisy and messy, and therefore, a textual pre-processing is necessary to trim and formalize the inputs before feeding to the Word2Vec and word embedded CNN. During the pre-processing, we removed the punctuation marks, emoticons, and numbers from the text. Stemming and lemmatization techniques were also applied in the process. Stemming identifies the common root form of a word by removing or replacing word suffixes (e.g. ‘flooding’ is stemmed as ‘flood’), while lemmatization identifies the inflected forms of a word and returns its base form (e.g. ‘better’ is lemmatized as ‘good’). For tweets that contain URL, regular expression is used to match and remove URLs in their texts. Stopwords represent the most common words in a language, hardly contributing to the meaning of a sentence. In this pre-processing step, a list of stopwords were retrieved from Natural Language Toolkit (NLTK) library (http://www.nltk.org/) and words in the list are further removed. We also applied some basic transformations, such as ‘’ve’ to ‘have’, ‘’ll’ to ‘will’, ‘n’t’ to ‘not’, ‘’re’ to ‘are’, to enhance the comprehension of the algorithm.
All pictures are resampled to 299299 via bilinear interpolation algorithm before feeding to the visual CNN.
5. Results and discussion
5.1. Visual CNN
The visual CNN architecture was trained on the visual training set described in Section 4.2 using 5-fold cross-validation strategy. The training phase (2 stages) took 24 min 41 s for a single fold using NVIDIA GeForce GTX 1080Ti GPU for acceleration.
The model reached a stable performance for all folds with an average accuracy of 92.94% and a standard deviation (SD) of 0.95% (). The AUCs (Area Under the Curve) for all ROC (Receiver Operating Characteristic) curves in (a) were summarized in . The average AUC for all 5 folds is 0.982 out of 1 (perfect classifier), also indicating the high performance and high stability of our visual CNN.
Figure 6. Model performance of the visual CNN: (a) the ROC curves for all 5 folds; (b) the training and validation accuracy curves for fold 3 (best fold) in two stages.
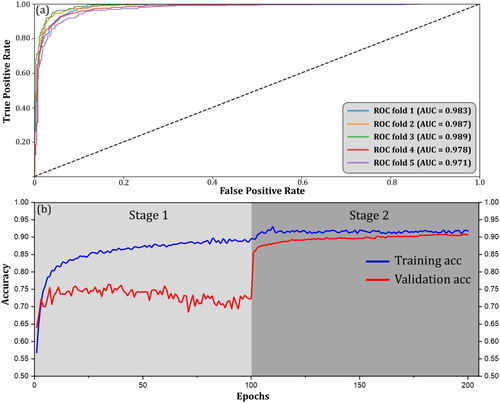
Table 4. Visual CNN performance.
The accuracy curves for fold 3 are demonstrated in (b). After 200 epochs, it reached an accuracy higher than 90% in both training and validation sets. The gradual convergence of the training accuracy curve and validation accuracy curve indicates that the two-stage learning strategy successfully prevents the overfitting. The significant validation improvement at the beginning of Stage 2 is due to fine-tuning of the newly released inception-v3 blocks. Given the unique characteristics of flood pictures and the popularity of pictures with similar patterns (Feng and Sester Citation2018), an accuracy over 90% with AUC curve over 0.95 is considered acceptable compared with other flood picture classification results (Avgerinakis et al. Citation2017; Bischke et al. Citation2017).
The good performance of visual CNN in classifying flood and non-flood pictures guarantees that the intermediate penultimate layer (1024-dimension vector) effectively summaries the characteristics of flood pictures. The vector thus can be used to represent visual feature of a social media post.
5.2. Textual CNN
Given the fact that well-trained word vectors are the prerequisite for a robust textual CNN, we first evaluated the 300-dimension word vectors generated by Word2Vec, specifically trained on our developed social media pool. Cosine-similarity distance was applied to examine the similarity of word vectors to a target vector in hyper-dimensional space. A cosine distance ranges from −1 meaning exact opposite, to 1 meaning exact the same, with 0 meaning unrelated.
demonstrates some common words and the Word2Vec-generated top 5 words with similar meanings ranked in cosine-similarity distance. For example, the closest word vector to ‘bad’ is the word vector of ‘terrible’ with a cosine distance of 0.635, followed by ‘horrible’ (0.610), ‘shitty’ (0.553), ‘awful’ (0.524) and ‘crappy’ (0.469). A similar pattern is also found for ‘good’, whose close word vectors include ‘great’, ‘decent’, etc, all with the same sentimental preference. For disaster related keywords like ‘flood’ and ‘hurricane’, word vectors with high similarity tend to have either high sentence structure relevance (‘hurricane’ and ‘Harvey’), high synonymousness (‘hurricane’ and ‘storm’) or strong causal relationship (‘flood’ and ‘damage’, ‘hurricane’ and ‘flood’).
Table 5. Word2Vec training results (top 5 neighboring words with their cosine-similarity distances).
The linear relationship between different vectors was maintained throughout the training phase. For example, the vector ‘flood’ minus vector ‘water’ (flood-induced) was similar to that of ‘thunderstorm’, ‘storm’ and ‘tornado’ minus ‘wind’ (storm-induced). Similarly, the vector pattern of ‘earthquake quake’ is most similar to ‘flood
water’, and that of ‘father
son’ is most similar to ‘mother
daughter’ (). Trained from a massive social media training pool, the Word2Vec model not only extracted meaningful vector representations but also preserved linear relations among different word vectors.
We then evaluated the classification performance of textual CNN using the sentence matrix build from these word vectors.
Accelerated by GPU and CUDA architecture, the designed CNN finished the training in 21 s through 200 epochs for a single fold. The results indicate a high performance with stability. The average accuracy for all 5 folds reaches 93.45% with an SD of 0.63% and the average AUC reaches 0.965 with an SD of 0.004 (). Detailed ROC curves for all 5 folds and training curve for fold 1 (best performance) are presented in . After the 75th epoch, both of the training accuracy curve and the validation accuracy curve started to level and stabled above 90%, indicating no significant overfitting problem ((b)). Consecutive and stable training loss was also observed throughout the training phase ((c)).
Figure 7. (a) Textual CNN ROC curve for all 5 folds; (b) Training accuracy curve for fold 1 during 200 epochs; (b) Training loss curve for fold 1 during 200 epochs.
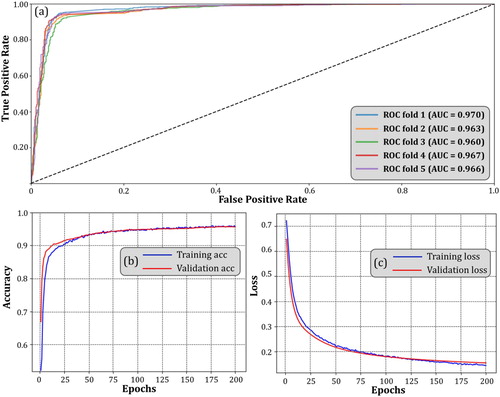
Table 6. Textual CNN performance.
In general, the designed textual CNN performs remarkably well in classifying flood-related and non-flood related tweets based on their textual information. It is partly due to the uniqueness of word patterns in social media during a flood event. For instance, we found that the majority of texts in flood-related tweets in the training pool contain high flood-relevant keywords like ‘flood’, ‘rain’, ‘underwater’, etc. This pattern can be easily recognized and adopted as a classification strategy by the designed textual CNN architecture, thus resulting in high classification accuracy. That being said, with the same keyword distribution patterns noticed in other disasters like hurricane (Bakillah, Li, and Liang Citation2015), earthquake, and wildfire (Slavkovikj et al. Citation2014), this method could be easily generalized to other disaster cases given a proper training set.
5.3. Visual-textual fused classification
The high performance of the designed visual CNN and textual CNN proves the functionality of their extracted feature vectors. In this section, we evaluated the performance of various machine learning algorithms in giving binary labels based on , the concatenated fused vector with 2048 dimensions. Similar to training the visual and textual CNN, the 5-fold cross validation was applied to test LogR, DT, RF, NB (Gaussian), NB (Multinomial), NB (Bernoulli), DA (LDA), DA (QDA), SVM (Linear), SVM (Polynomial), SVM (RBF) and SVM (Sigmoid). As shown in , LogR achieved the best performance with an average accuracy of 96.5%, followed by SVM (Linear) with 96.3%, SVM (RBF) with 94.4% and SVM (Sigmoid) with 94.1%. RF and DT also performed well with average accuracy reaching over 90%. Significant overfitting was observed in SVM (Polynomial) as it has a low average accuracy (69.7%) and the highest SD (4.87%).
Table 7. Visual-textual fused classification accuracy.
To examine whether classification using visual-textual fused vector () is better than using textual vector alone (
), we tested the algorithms with average accuracy over 90% in using
and
as input, respectively. Those algorithms include LogR, DT, RF, SVM (Linear), SVM(RBF) and SVM (Sigmoid). The whole dataset was randomly divided into a training set (70%) and a testing set (30%). The results suggest that all the algorithms benefited from the additional input of visual information (). For instance, LogR achieved a classification accuracy of 95.2% using
, a 12.6% increase from using
. Similar improvements were found for DT with a 12.1% increase, RF with a 11.6% increase and SVM (Sigmoid) with a 14.4% increase ().
Table 8. Visual-textual fused classification compared with textual only.
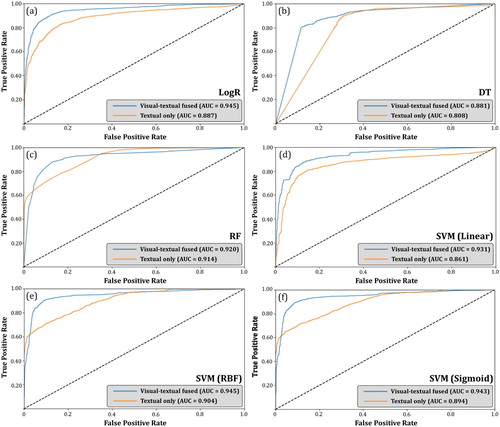
Adding visual inputs from social media, better classification performance for those algorithms above was also reflected in their ROC curves (). AUC improvements were observed, especially for LogR (AUC improved from 0.887 to 0.945), DT (AUC improved from 0.808 to 0.881) and SVM (Linear) (AUC improved from 0.861 to 0.931). The AUC improvement for all six algorithms suggests that the visual-textual fused feature exhibits more robustness in extracting on-topic posts.
Figure 8. ROC curves of the six algorithms using visual-textual fused vector () and using textual vector (
) alone; (a) LogR; (b) DT; (c) RF; (d) SVM (Linear); (e) SVM (RBF); (f) SVM (Sigmoid).
5.4. Uncertainties
After the evaluation of general performance, we further investigated individual cases to understand the uncertainties that our fusion mechanism might cause. presents some comparisons of classification results when textual features are used and when visual-textual fused features are used. In general, we noticed that when textual information and visual information of a certain post were both flood relevant, the fused feature tended to boost the probability ((b,c,e,f)). When textual information and visual information were contradictory, however, the probability that a fused feature indicated tended to favor the opposite direction of that a textual feature indicated ((a,d,f,g)).
Figure 9. Eight Examples of classification results. denotes the probability of a post being flood relevant. Blurring was applied to faces appeared in the photo.
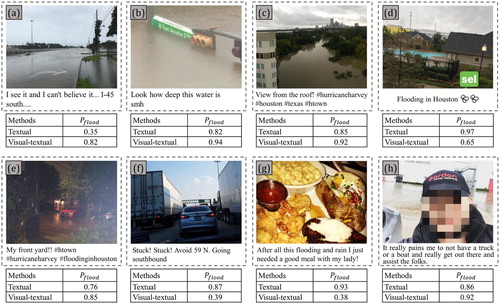
In some cases, visual-textual feature leads to the correction of wrongly classified textual information. For instance, the textual information in (a) was classified as non-flood relevant () due to the lack of flood relevant word vectors in its texts. When coupled with the visual information however, its visual-textual fused feature was successfully classified as flood relevant (
). Another example is (g), where its textual information was classified as flood relevant (
) and its visual-textual fused feature indicated otherwise (
). Similar example can also be found in (f).
During the case study, the biggest challenge we found in the visual-textual fusion is the association between text and image a post contains. As observed in Vadicamo et al. (Citation2017), the linkage between text content and image content is uncertain and sometimes rather weak. Moreover, it is still unclear how this linkage might change during a disaster event. Although this study proves that visual-textual fused feature is more robust in classifying flood tweets, the foundation of proposed fusion mechanism still relies on the strong linkage between them, meaning that a weak linkage between texts and images could potentially cause unmeasurable uncertainties to the model. To better utilize both visual and textual information from social media, more studies are needed to understand the linkage, especially how this linkage will change during different disaster events.
This study provides direct evidence that coupling visual and textual information aids in better classification accuracy. The fact that visual-textual representation outperforms textual representation alone demonstrates the importance of incorporating visual information into social media post labeling.
Derived in an automatic manner, the robustness of visual-textual fused classification guarantees a flood-related VGI pool with high quality. The water height information from those geotagged social media distributed in a large region could provide valuable local flooding awareness in a timely manner, significantly assisting rapid flood response by local authorities and first responders. In addition, the proposed visual-textual labeling approach can be applied to other disasters such as fire and earthquake given proper textual and visual training samples. The on-topic posts classified by their texts and pictures represent timely individual-level disaster documentation, coupling with rich spatial contexts when geotagged. Those posts extracted automatically can be utilized to aid in a variety of disaster mitigation approaches including urban system recovery, public sentimental analysis, damage assessment, evacuation investigation, first responder dispatch, recovery management, and so on.
6. Limitations and future directions
6.1. Limitations
One limitation of the proposed approach is that the performance of on-topic social media retrieval is highly reliant on the quantity and quality of training samples. This being said, any deficiency in numbers or defect in quality will potentially undermine the classification result. This limitation, the necessity of large training samples with high quality, widely exist in most of the deep learning algorithms. Besides, developing such high-quality training samples in a large quantity is time- and labor-consuming. It might not be feasible to provide real-time retrieval unless all the training samples are pre-prepared.
Another limitation is the fundamental assumption of the fusion algorithm. The better performance of visual-textual feature compared to textual feature alone relies on a rather strong association of textual and visual content in a social media post. This study only examined one specific social media platform (Twitter) during one specific event (flood). The strength of this linkage, however, may not hold the same for other social media platforms or other events. We advise caution when applying the proposed fusion algorithm to cross-media/event.
Thirdly, the integration is based on vector fusion mechanism where visual vector and textual vector are concatenated to form a visual-textual vector, participating in the final classification task. This fusion method implies equal weights on both visual and textual information a social media post contains. In some cases, however, this assumption might not be true.
Fourthly, this study only considers the textual content and visual content while the spatiotemporal dimension is neglected. Studies have proved that people who are close to the disaster location spatially tend to produce more disaster-related information on social media (Li et al. Citation2018). More disaster-related social media are usually found when a disaster reaches its peak (Sakaki, Okazaki, and Matsuo Citation2010). The prior probability derived from the spatiotemporal information of social media could contribute to better on-topic classification accuracy.
Lastly, only geotagged tweets serve as training samples in this study, which inevitably cause certain biases as geotagged tweets only consist of a small proportion. Sloan and Morgan (Citation2015) reported that 96.9% of their tweeters have no geotagged tweets in the study site of UK. Globally, Sloan et al. (Citation2013) concluded that only 0.85% of tweets were geotagged with longitude and latitude information. The small training datasets derived from only geotagged tweets in this study potentially undermine the robustness of the proposed classification model.
6.2. Future directions
This study has proved that, during a flood event, the proposed visual-textual fused approach contributes to an improved on-topic retrieval accuracy by taking advantage of both textual content and visual content a tweet contains. More studies, however, are needed to test the validity of visual-textual feature during other disaster events as the association between texts and pictures may not hold the same. A weak association can potentially undermine the fundamental assumption. More explorations are necessary to investigate how this association changes in different events so that useful guidance can be given on which source is more reliable, single or fused.
From a technical perspective, this study can be modified and improved in many ways. Firstly, this study combines the visual feature and textual feature extracted respectively from two specific architectures: Inception-V3 and word embedded CNN. With the rapid development of deep learning, however, more advanced networks have been proposed. Resnet (He et al. Citation2016) and Inception-V4 (Szegedy et al. Citation2017), for instance, have demonstrated their better image labeling capability and are widely used in many image recognition applications. Recurrent Neural Network (RNN), a neural network architecture that exhibits temporal dynamic behavior, has been proved rather efficient in handling sequential textual data (Hochreiter and Schmidhuber Citation1997; Mikolov et al. Citation2010; Tai, Socher, and Manning Citation2015). The integration of the aforementioned networks potentially leads to more robust visual-textual features, consequently resulting in better disaster related social media retrieval. In terms of embedding method, this study used Word2Vec embedding trained from self-designed social media corpus. Other embedding methods, including ELMo (Peters et al. Citation2018), FastText (Bojanowski et al. Citation2017) and GloVe (Pennington, Socher, and Manning Citation2014), are becoming more popular recently. Whether the word vectors derived from those embedding methods improve the proposed fusion algorithm deserves further exploration.
In addition, the spatiotemporal dimension of social media should be considered in future studies as previous studies have concluded the strong linkage between the content and spatiotemporal characteristics of social media posts. By analyzing the spatiotemporal distribution of extracted disaster related posts, a better understanding of the relationship between their spatiotemporal characteristics and their content can be achieved, which in turn contributes to better utilization of those characteristics in retrieving on-topic posts.
Finally, the training dataset can be expended by using geoparsing, a process of converting text description of places to unambiguous geographic identifiers (Cheng, Caverlee, and Lee Citation2010; Avvenuti, Cresci, Nizzoli et al. Citation2018). The additional training samples rendered by geoparsing techniques is expected to contribute to a better generalization of the proposal CNN architecture and largely facilitate follow-up analyses that require geoinformation within social media data.
7. Conclusion
Social media platforms have played a critical role in situation awareness and mitigation for a wide range of disasters. Admitting the enormous volume of social media posts during a disaster event, disaster related social media posts only consist of a small proportion. An automatic approach to on-topic social media retrieval is, therefore, in great need.
Under the assumption that texts and pictures, two major components of a social media post, are both essential in retrieving on-topic posts, this study presents a visual-textual fused CNN architecture for labeling on-topic social media posts in an automatic manner. We adopted two CNNs, transfer-learned Inception-V3 and word embedded CNN, specifically for visual and textual information labeling. A fused feature vector is then formed by concatenating the extracted visual and textual vectors, which is further utilized to retrieve the final binary labels (on-topic vs. off-topic) of the post. Taking flood as a disaster case and Twitter as a social media platform, the experimental results suggest that the visual CNN textual CNN perform remarkably well with classification accuracies of 92.92% and 93.45% respectively. During the fused classification phrase, all selected machine learning algorithms (including LogR, DT, RF, SVM-Linear, SVM-RBF, and SVM-Sigmoid) have confirmed the positive effect of additional visual information in classifying on-topic tweets, which are justified by the improvement of their classification accuracy and corresponding ROC curves. The visual-textual fused feature proves that additional visual vector leads to more robustness in on-topic social media retrieval, presumably due to the self-correction of uncertainties from single-source information.
Incorporating both texts and pictures in social media posts, the proposed visual-textual CNN architecture significantly automates the on-topic social media retrieval, largely expending searching scope, ensuring more robustness of classification, and seeding a wide range of social media based disaster studies. The direct evidence in this study that visual-textual representation outperforms textual representation alone urges future research regarding social media labeling towards a visual-textual fusion direction.
Source code availability
The proposed algorithm is available at https://github.com/xhuang316/visual-textual-tweets-retrival. This implementation is based on Python coding environment. A high-level neural network API, Keras (https://keras.io/), is used to enable fast experimentation. The code requires python 3.6 compiler and the installation of Keras with TensorFlow backend. The authors recommend the usage of GPU-supported TensorFlow to reduce the training time. Everyone is granted permission to copy, modify, and redistribute this code, but under the condition that the original copyright is preserved. The visual and textual training samples are available upon request.
Disclosure statement
No potential conflict of interest was reported by the authors.
Additional information
Funding
References
- Ashktorab, Z., C. Brown, M. Nandi, and A. Culotta. 2014. “Tweedr: Mining Twitter to Inform Disaster Response.” ISCRAM, May.
- Avgerinakis, K., A. Moumtzidou, S. Andreadis, E. Michail, I. Gialampoukidis, S. Vrochidis, and I. Kompatsiaris. 2017. “Visual and Textual Analysis of Social Media and Satellite Images for Flood Detection@ Multimedia Satellite Task MediaEval 2017.” Working Notes Proc. MediaEval Workshop, p. 2.
- Avvenuti, M., S. Cresci, F. Del Vigna, T. Fagni, and M. Tesconi. 2018. “CrisMap: A Big Data Crisis Mapping System Based on Damage Detection and Geoparsing.” Information Systems Frontiers, 1–19.
- Avvenuti, M., S. Cresci, F. Del Vigna, and M. Tesconi. 2016. “Impromptu Crisis Mapping to Prioritize Emergency Response.” Computer 49 (5): 28–37.
- Avvenuti, M., S. Cresci, A. Marchetti, C. Meletti, and M. Tesconi. 2014. “EARS (Earthquake Alert and Report System): A Real Time Decision Support System for Earthquake Crisis Management.” Proceedings of the 20th ACM SIGKDD International Conference on Knowledge Discovery and Data Mining, ACM, August, 1749–1758.
- Avvenuti, M., S. Cresci, L. Nizzoli, and M. Tesconi. 2018. “GSP (Geo-Semantic-Parsing): Geoparsing and Geotagging with Machine Learning on Top of Linked Data.” European Semantic Web Conference, Springer, Cham, June, 17–32.
- Bakillah, M., R. Y. Li, and S. H. Liang. 2015. “Geo-located Community Detection in Twitter with Enhanced Fast-greedy Optimization of Modularity: The Case Study of Typhoon Haiyan.” International Journal of Geographical Information Science 29 (2): 258–279.
- Bar, Y., I. Diamant, L. Wolf, and H. Greenspan. 2015. “Deep Learning with Non-medical Training used for Chest Pathology Identification.” Medical Imaging 2015: Computer-Aided Diagnosis, International Society for Optics and Photonics, March, Vol. 9414, 94140V.
- Bischke, B., P. Bhardwaj, A. Gautam, P. Helber, D. Borth, and A. Dengel. 2017. “Detection of Flooding Events in Social Multimedia and Satellite Imagery Using Deep Neural Networks.” Working Notes Proc. MediaEval Workshop, 2.
- Bojanowski, P., E. Grave, A. Joulin, and T. Mikolov. 2017. “Enriching Word Vectors with Subword Information.” Transactions of the Association for Computational Linguistics 5: 135–146.
- Bosch, A., A. Zisserman, and X. Munoz. 2007. “Image Classification Using Random Forests and Ferns.” Computer Vision, 2007. ICCV 2007. IEEE 11th International Conference, IEEE, October, 1–8.
- Chapelle, O., P. Haffner, and V. N. Vapnik. 1999. “Support Vector Machines for Histogram-Based Image Classification.” IEEE Transactions on Neural Networks 10 (5): 1055–1064.
- Cheng, Z., J. Caverlee, and K. Lee. 2010. “You are Where You Tweet: A Content-based Approach to Geo-locating Twitter Users.” Proceedings of the 19th ACM International Conference on Information and Knowledge Management, ACM, October, 759–768.
- Ciresan, D. C., U. Meier, J. Masci, L. Maria Gambardella, and J. Schmidhuber. 2011. “Flexible, High Performance Convolutional Neural Networks for Image Classification.” IJCAI Proceedings-International Joint Conference on Artificial Intelligence, Vol. 22, 1237, July.
- Collobert, R., J. Weston, L. Bottou, M. Karlen, K. Kavukcuoglu, and P. Kuksa. 2011. “Natural Language Processing (Almost) from Scratch.” Journal of Machine Learning Research 12: 2493–2537.
- Crampton, J. W. 2009. “Cartography: Maps 2.0.” Progress in Human Geography 33 (1): 91–100.
- Dredze, M. 2012. “How Social Media Will Change Public Health.” IEEE Intelligent Systems 27 (4): 81–84.
- Earle, P. S., D. C. Bowden, and M. Guy. 2012. “Twitter Earthquake Detection: Earthquake Monitoring in a Social World.” Annals of Geophysics 54 (6): 708–715.
- Feng, Y., and M. Sester. 2018. “Extraction of Pluvial Flood Relevant Volunteered Geographic Information (VGI) by Deep Learning from User Generated Texts and Photos.” ISPRS International Journal of Geo-Information 7 (2): 39.
- Fohringer, J., D. Dransch, H. Kreibich, and K. Schröter. 2015. “Social Media as an Information Source for Rapid Flood Inundation Mapping.” Natural Hazards and Earth System Sciences 15 (12): 2725–2738.
- Gao, Y., S. Wang, A. Padmanabhan, J. Yin, and G. Cao. 2018. “Mapping Spatiotemporal Patterns of Events Using Social Media: A Case Study of Influenza Trends.” International Journal of Geographical Information Science 32 (3): 425–449.
- Gao, Y., M. Wang, Z. J. Zha, J. Shen, X. Li, and X. Wu. 2013. “Visual-textual Joint Relevance Learning for Tag-based Social Image Search.” IEEE Transactions on Image Processing 22 (1): 363–376.
- Goodchild, M. F. 2007. “Citizens as Sensors: The World of Volunteered Geography.” GeoJournal 69 (4): 211–221.
- Gupta, A., H. Lamba, P. Kumaraguru, and A. Joshi. 2013. “Faking Sandy: Characterizing and Identifying Fake Images on Twitter during Hurricane Sandy.” Proceedings of the 22nd International Conference on World Wide Web, ACM, May, 729–736.
- Hannak, A., E. Anderson, L. F. Barrett, S. Lehmann, A. Mislove, and M. Riedewald. 2012. “Tweetin’ in the Rain: Exploring Societal-Scale Effects of Weather on Mood.” ICWSM, June.
- He, K., X. Zhang, S. Ren, and J. Sun. 2016. “Deep Residual Learning for Image Recognition.” Proceedings of the IEEE Conference on Computer Vision and Pattern Recognition, 770–778.
- Hershey, S., S. Chaudhuri, D. P. Ellis, J. F. Gemmeke, A. Jansen, R. C. Moore, and M. Slaney. 2017. “CNN Architectures for Large-scale Audio Classification.” 2017 IEEE International Conference on Acoustics, Speech and Signal Processing (ICASSP), IEEE, March, 131–135.
- Hochreiter, S., and J. Schmidhuber. 1997. “Long Short-term Memory.” Neural Computation 9 (8): 1735–1780.
- Hu, F., G. S. Xia, J. Hu, and L. Zhang. 2015. “Transferring Deep Convolutional Neural Networks for the Scene Classification of High-resolution Remote Sensing Imagery.” Remote Sensing 7 (11): 14680–14707.
- Huang, X., C. Wang, and Z. Li. 2018a. “Reconstructing Flood Inundation Probability by Enhancing Near Real-Time Imagery with Real-Time Gauges and Tweets.” IEEE Transactions on Geoscience and Remote Sensing. doi:10.1109/TGRS.2018.2835306.
- Huang, X., C. Wang, and Z. Li. 2018b. “A Near Real-Time Flood-Mapping Approach by Integrating Social Media and Post-Event Satellite Imagery.” Annals of GIS 24 (2): 113–123.
- Huang, X., C. Wang, Z. Li, and H. Ning. 2018c. “A Visual–Textual Fused Approach to Automated Tagging of Flood-Related Tweets During a Flood Event.” International Journal of Digital Earth. doi:10.1080/17538947.2018.1523956.
- Imran, M., C. Castillo, F. Diaz, and S. Vieweg. 2015. “Processing Social Media Messages in Mass Emergency.” ACM Computing Surveys 47 (4): 1–38.
- Kalchbrenner, N., E. Grefenstette, and P. Blunsom. 2014. “A Convolutional Neural Network for Modelling Sentences.” arXiv preprint arXiv:1404.2188.
- Kent, J. D., and H. T. Capello. 2013. “Spatial Patterns and Demographic Indicators of Effective Social Media Content During TheHorsethief Canyon Fire of 2012.” Cartography and Geographic Information Science 40 (2): 78–89.
- Kim, Y. 2014. “Convolutional Neural Networks for Sentence Classification.” arXiv preprint arXiv:1408.5882.
- Krizhevsky, A., I. Sutskever, and G. E. Hinton. 2012. “Imagenet Classification with Deep Convolutional Neural Networks.” In Advances in Neural Information Processing Systems, 1097–1105. Lake Tahoe, NV: Neural Information Processing Systems (NIPS).
- Lampos, V., and N. Cristianini. 2012. “Nowcasting Events from the Social Web with Statistical Learning.” ACM Transactions on Intelligent Systems and Technology (TIST) 3 (4): 72.
- Laura, L. F., W. Joost, B. Marc, and S. Harald. 2017. “Multi-modal Deep Learning Approach for Flood Detection.” Proceedings of the MediaEval. Workshop, Dublin Google Scholar.
- Lew, M. S., N. Sebe, C. Djeraba, and R. Jain. 2006. “Content-based Multimedia Information Retrieval: State of the Art and Challenges.” ACM Transactions on Multimedia Computing, Communications, and Applications 2 (1): 1–19.
- Li, Z., C. Wang, C. T. Emrich, and D. Guo. 2018. “A Novel Approach to Leveraging Social Media for Rapid Flood Mapping: A Case Study of the 2015 South Carolina Floods.” Cartography and Geographic Information Science 45 (2): 97–110.
- Lin, Z., H. Jin, B. Robinson, and X. Lin. 2016. “Towards an Accurate Social Media Disaster Event Detection System Based on Deep Learning and Semantic Representation.” Proceedings of the Australasian Data Mining Conference.
- McCann, S., and D. G. Lowe. 2012. “Local Naive Bayes Nearest Neighbor for Image Classification.” Computer Vision and Pattern Recognition (CVPR), 2012 IEEE Conference, IEEE, June, 3650–3656.
- Middleton, S. E., L. Middleton, and S. Modafferi. 2014. “Real-time Crisis Mapping of Natural Disasters Using Social Media.” IEEE Intelligent Systems 29 (2): 9–17.
- Mikolov, T., K. Chen, G. Corrado, and J. Dean. 2013. “Efficient Estimation of Word Representations in Vector Space.” arXiv preprint arXiv:1301.3781.
- Mikolov, T., M. Karafiát, L. Burget, J. Černocký, and S. Khudanpur. 2010. “Recurrent Neural Network Based Language Model.” Eleventh annual conference of the International Speech Communication Association.
- Muralidharan, S., L. Rasmussen, D. Patterson, and J. H. Shin. 2011. “Hope for Haiti: An Analysis of Facebook and Twitter Usage During the Earthquake Relief Efforts.” Public Relations Review 37 (2): 175–177.
- Nguyen, D. T., F. Ofli, M. Imran, and P. Mitra. 2017. “Damage Assessment from Social Media Imagery Data during Disasters.” Proceedings of the 2017 IEEE/ACM International Conference on Advances in Social Networks Analysis and Mining 2017, ACM, July, 569–576.
- Ofli, F., P. Meier, M. Imran, C. Castillo, D. Tuia, N. Rey, and S. Joost. 2016. “Combining Human Computing and Machine Learning to Make Sense of Big (Aerial) Data for Disaster Response.” Big Data 4 (1): 47–59.
- Ouyang, X., P. Zhou, C. H. Li, and L. Liu. 2015. “Sentiment Analysis Using Convolutional Neural Network.” In Computer and Information Technology; Ubiquitous Computing and Communications; Dependable, Autonomic and Secure Computing; Pervasive Intelligence and Computing (CIT/IUCC/DASC/PICOM), 2015 IEEE International Conference, IEEE, October, 2359–2364.
- Pennington, J., R. Socher, and C. Manning. 2014. “Glove: Global Vectors for Word Representation.” Proceedings of the 2014 Conference on Empirical Methods in Natural Language Processing (EMNLP), 1532–1543.
- Peters, M. E., M. Neumann, M. Iyyer, M. Gardner, C. Clark, K. Lee, and L. Zettlemoyer. 2018. “Deep Contextualized Word Representations.” arXiv preprint arXiv:1802.05365.
- Resch, B., F. Usländer, and C. Havas. 2018. “Combining Machine-Learning Topic Models and Spatiotemporal Analysis of Social Media Data for Disaster Footprint and Damage Assessment.” Cartography and Geographic Information Science 45 (4): 362–376.
- Ruiz Sinoga, J. D., and T. León Gross. 2013. “Droughts and Their Social Perception in the Mass Media (Southern Spain).” International Journal of Climatology 33 (3): 709–724.
- Sakaki, T., M. Okazaki, and Y. Matsuo. 2010. “Earthquake Shakes Twitter Users: Real-time Event Detection by Social Sensors.” In Proceedings of the 19th International Conference on World Wide Web, ACM, April, 851–860.
- Schmidt, C. W. 2012. “Trending Now: Using Social Media to Predict and Track Disease Outbreaks.” Environmental Health Perspectives 120 (1): a30.
- Schnebele, E., and G. Cervone. 2013. “Improving Remote Sensing Flood Assessment Using Volunteered Geographical Data.” Natural Hazards and Earth System Sciences 13: 669–677.
- Schnebele, E., G. Cervone, and N. Waters. 2014. “Road Assessment After Flood Events Using Non-Authoritative Data.” Natural Hazards and Earth System Sciences 14 (4): 1007–1015.
- Serengil, S. L. 2018. “Transfer Learning in Keras Using Inception V3.” March 12. Accessed June 12, 2018. https://sefiks.com/2017/12/10/transfer-learning-in-keras-using-inception-v3/.
- Simonyan, K., and A. Zisserman. 2014. “Very Deep Convolutional Networks for Large-scale Image Recognition.” arXiv preprint arXiv:1409.1556.
- Slavkovikj, V., S. Verstockt, S. Van Hoecke, and R. Van de Walle. 2014. “Review of Wildfire Detection Using Social Media.” Fire Safety Journal 68: 109–118.
- Sloan, L., and J. Morgan. 2015. “Who Tweets with Their Location? Understanding the Relationship Between Demographic Characteristics and the Use of Geoservices and Geotagging on Twitter.” PloS one 10 (11): e0142209.
- Sloan, L., J. Morgan, W. Housley, M. Williams, A. Edwards, P. Burnap, and O. Rana. 2013. “Knowing the Tweeters: Deriving Sociologically Relevant Demographics from Twitter.” Sociological Research Online 18 (3): 1–11.
- Srivastava, N., G. Hinton, A. Krizhevsky, I. Sutskever, and R. Salakhutdinov. 2014. “Dropout: A Simple Way to Prevent Neural Networks from Overfitting.” The Journal of Machine Learning Research 15 (1): 1929–1958.
- Stefanidis, A., A. Crooks, and J. Radzikowski. 2013. “Harvesting Ambient Geospatial Information from Social Media Feeds.” GeoJournal 78 (2): 319–338.
- Sutskever, I., O. Vinyals, and Q. V. Le. 2014. “Sequence to Sequence Learning with Neural Networks.” In Advances in Neural Information Processing Systems, 3104–3112. Montréal: Neural Information Processing Systems Foundation, Inc.
- Sutton, J. N., L. Palen, and I. Shklovski. 2008. “Backchannels on the Front Lines: Emergency Uses of Social Media in the 2007 Southern California Wildfires.” University of Colorado, 624–632.
- Szegedy, C., S. Ioffe, V. Vanhoucke, and A. A. Alemi. 2017. “Inception-v4, Inception-resnet and the Impact of Residual Connections on Learning.” AAAI, February, Vol. 4, p. 12.
- Szegedy, C., W. Liu, Y. Jia, P. Sermanet, S. Reed, D. Anguelov, and A. Rabinovich. 2015. “Going Deeper with Convolutions.” Proceedings of the IEEE conference on computer vision and pattern recognition, 1–9.
- Szegedy, C., V. Vanhoucke, S. Ioffe, J. Shlens, and Z. Wojna. 2016. “Rethinking the Inception Architecture for Computer Vision.” Proceedings of the IEEE Conference on Computer Vision and Pattern Recognition, 2818–2826.
- Tai, K. S., R. Socher, and C. D. Manning. 2015. “Improved Semantic Representations from Tree-structured Long Short-term Memory Networks.” arXiv preprint arXiv:1503.00075.
- Tang, Z., L. Zhang, F. Xu, and H. Vo. 2015. “Examining the Role of Social Media in California’s Drought Risk Management in 2014.” Natural Hazards 79 (1): 171–193.
- Twitter MAU in the United States 2018 | Statistic. 2018. Accessed August 21, 2018. https://www.statista.com/statistics/274564/monthly-active-twitter-users-in-the-united-states/.
- Vadicamo, L., F. Carrara, A. Cimino, S. Cresci, F. Dell’Orletta, F. Falchi, and M. Tesconi. 2017. “Cross-media Learning for Image Sentiment Analysis in the Wild.” Proceedings of the IEEE International Conference on Computer Vision, 308–317.
- Verma, S., S. Vieweg, W. J. Corvey, L. Palen, J. H. Martin, M. Palmer, and K. M. Anderson. 2011. “Natural Language Processing to the Rescue? Extracting’ Situational Awareness’ Tweets during Mass Emergency.” Fifth International AAAI Conference on Weblogs and Social Media, July.
- Vieweg, S., A. L. Hughes, K. Starbird, and L. Palen. 2010. “Microblogging during Two Natural Hazards Events: What Twitter May Contribute to Situational Awareness.” Proceedings of the SIGCHI Conference on Human Factors in Computing Systems, April, ACM, 1079–1088.
- Wang, T., D. J. Wu, A. Coates, and A. Y. Ng. 2012. “End-to-end Text Recognition with Convolutional Neural Networks.” Pattern Recognition (ICPR), 2012 21st International Conference, IEEE, November, 3304–3308.
- Xu, Z., Y. Liu, N. Yen, L. Mei, X. Luo, X. Wei, and C. Hu. 2016. “Crowdsourcing Based Description of Urban Emergency Events Using Social Media big Data.” IEEE Transactions on Cloud Computing. doi:10.1109/TCC.2016.2517638.
- Yates, D., and S. Paquette. 2010. “Emergency Knowledge Management and Social Media Technologies: A Case Study of the 2010 Haitian Earthquake.” Proceedings of the 73rd ASIS&T Annual Meeting on Navigating Streams in an Information Ecosystem-Volume 47, American Society for Information Science, October, p. 42.
- Yih, W. T., X. He, and C. Meek. 2014. “Semantic Parsing for Single-relation Question Answering.” Proceedings of the 52nd Annual Meeting of the Association for Computational Linguistics (Volume 2: Short Papers), Vol. 2, 643–648.
- Yin, J., A. Lampert, M. Cameron, B. Robinson, and R. Power. 2012. “Using Social Media to Enhance Emergency Situation Awareness.” IEEE Intelligent Systems 27 (6): 52–59.
- Yosinski, J., J. Clune, Y. Bengio, and H. Lipson. 2014. “How Transferable are Features in Deep Neural Networks?” Advances in Neural Information Processing Systems, 3320–3328.
- You, Q., J. Luo, H. Jin, and J. Yang. 2016. “Cross-modality Consistent Regression for Joint Visual-textual Sentiment Analysis of Social Multimedia.” Proceedings of the Ninth ACM International Conference on Web Search and Data Mining, ACM, February, 13–22.
- Yue-Hei Ng, J., M. Hausknecht, S. Vijayanarasimhan, O. Vinyals, R. Monga, and G. Toderici. 2015. “Beyond Short Snippets: Deep Networks for Video Classification.” Proceedings of the IEEE Conference on Computer Vision and Pattern Recognition, 4694–4702.
- Zhang, Y., and B. Wallace. 2015. “A Sensitivity Analysis of (and Practitioners’ Guide to) Convolutional Neural Networks for Sentence Classification.” arXiv preprint arXiv:1510.03820.
- Zikopoulos, P., and C. Eaton. 2011. Understanding Big Data: Analytics for Enterprise Class Hadoop and Streaming Data. New York: McGraw-Hill Osborne Media.